Blog
Insights on dashboards, data visualization, and making your spreadsheets work harder.
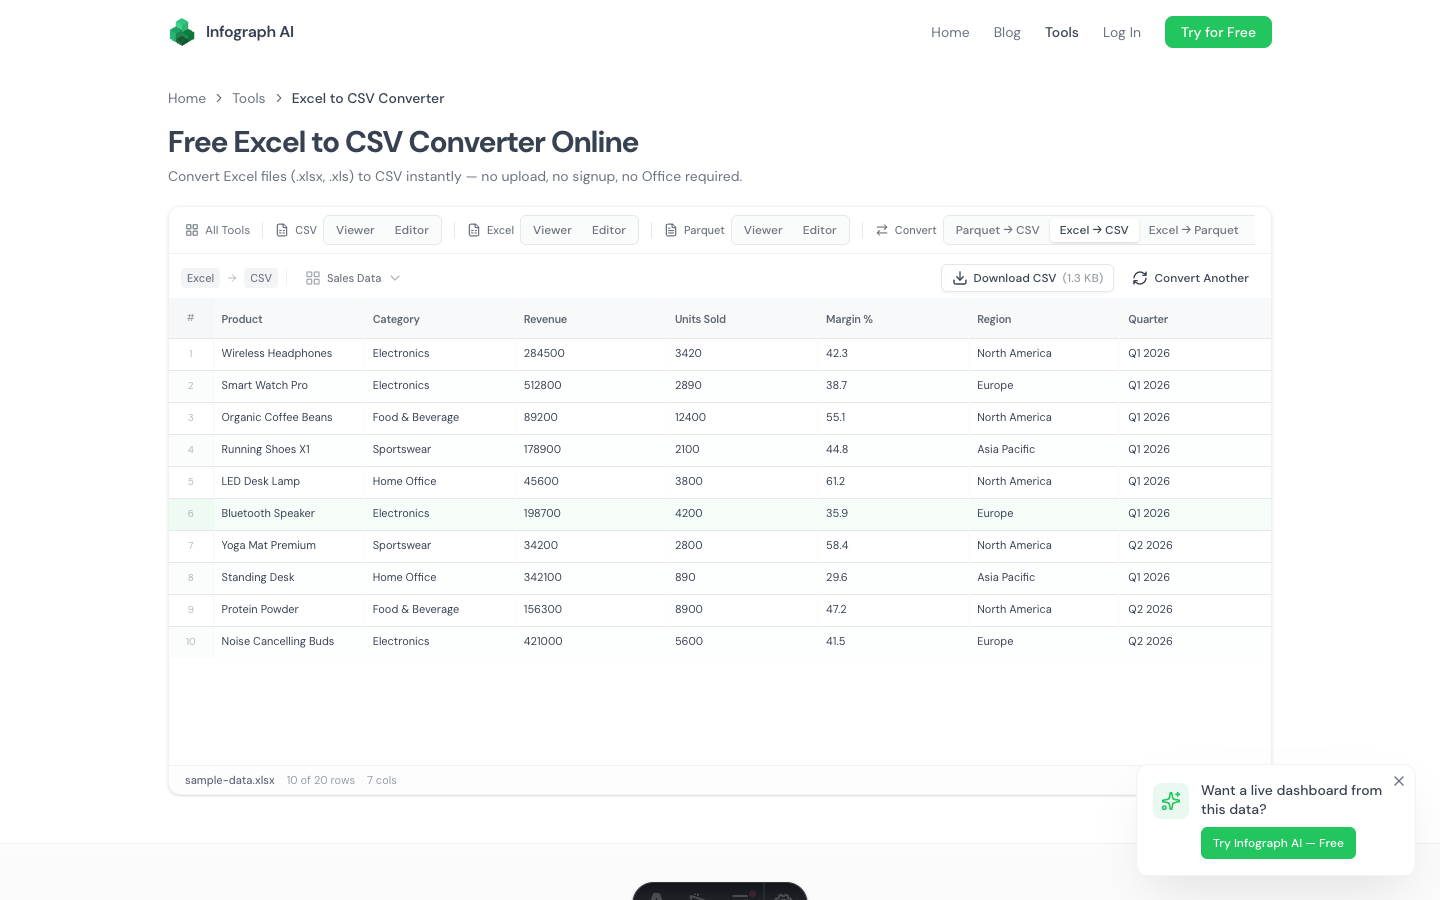
Free Excel to CSV Converter Online — No Upload, No Office Required
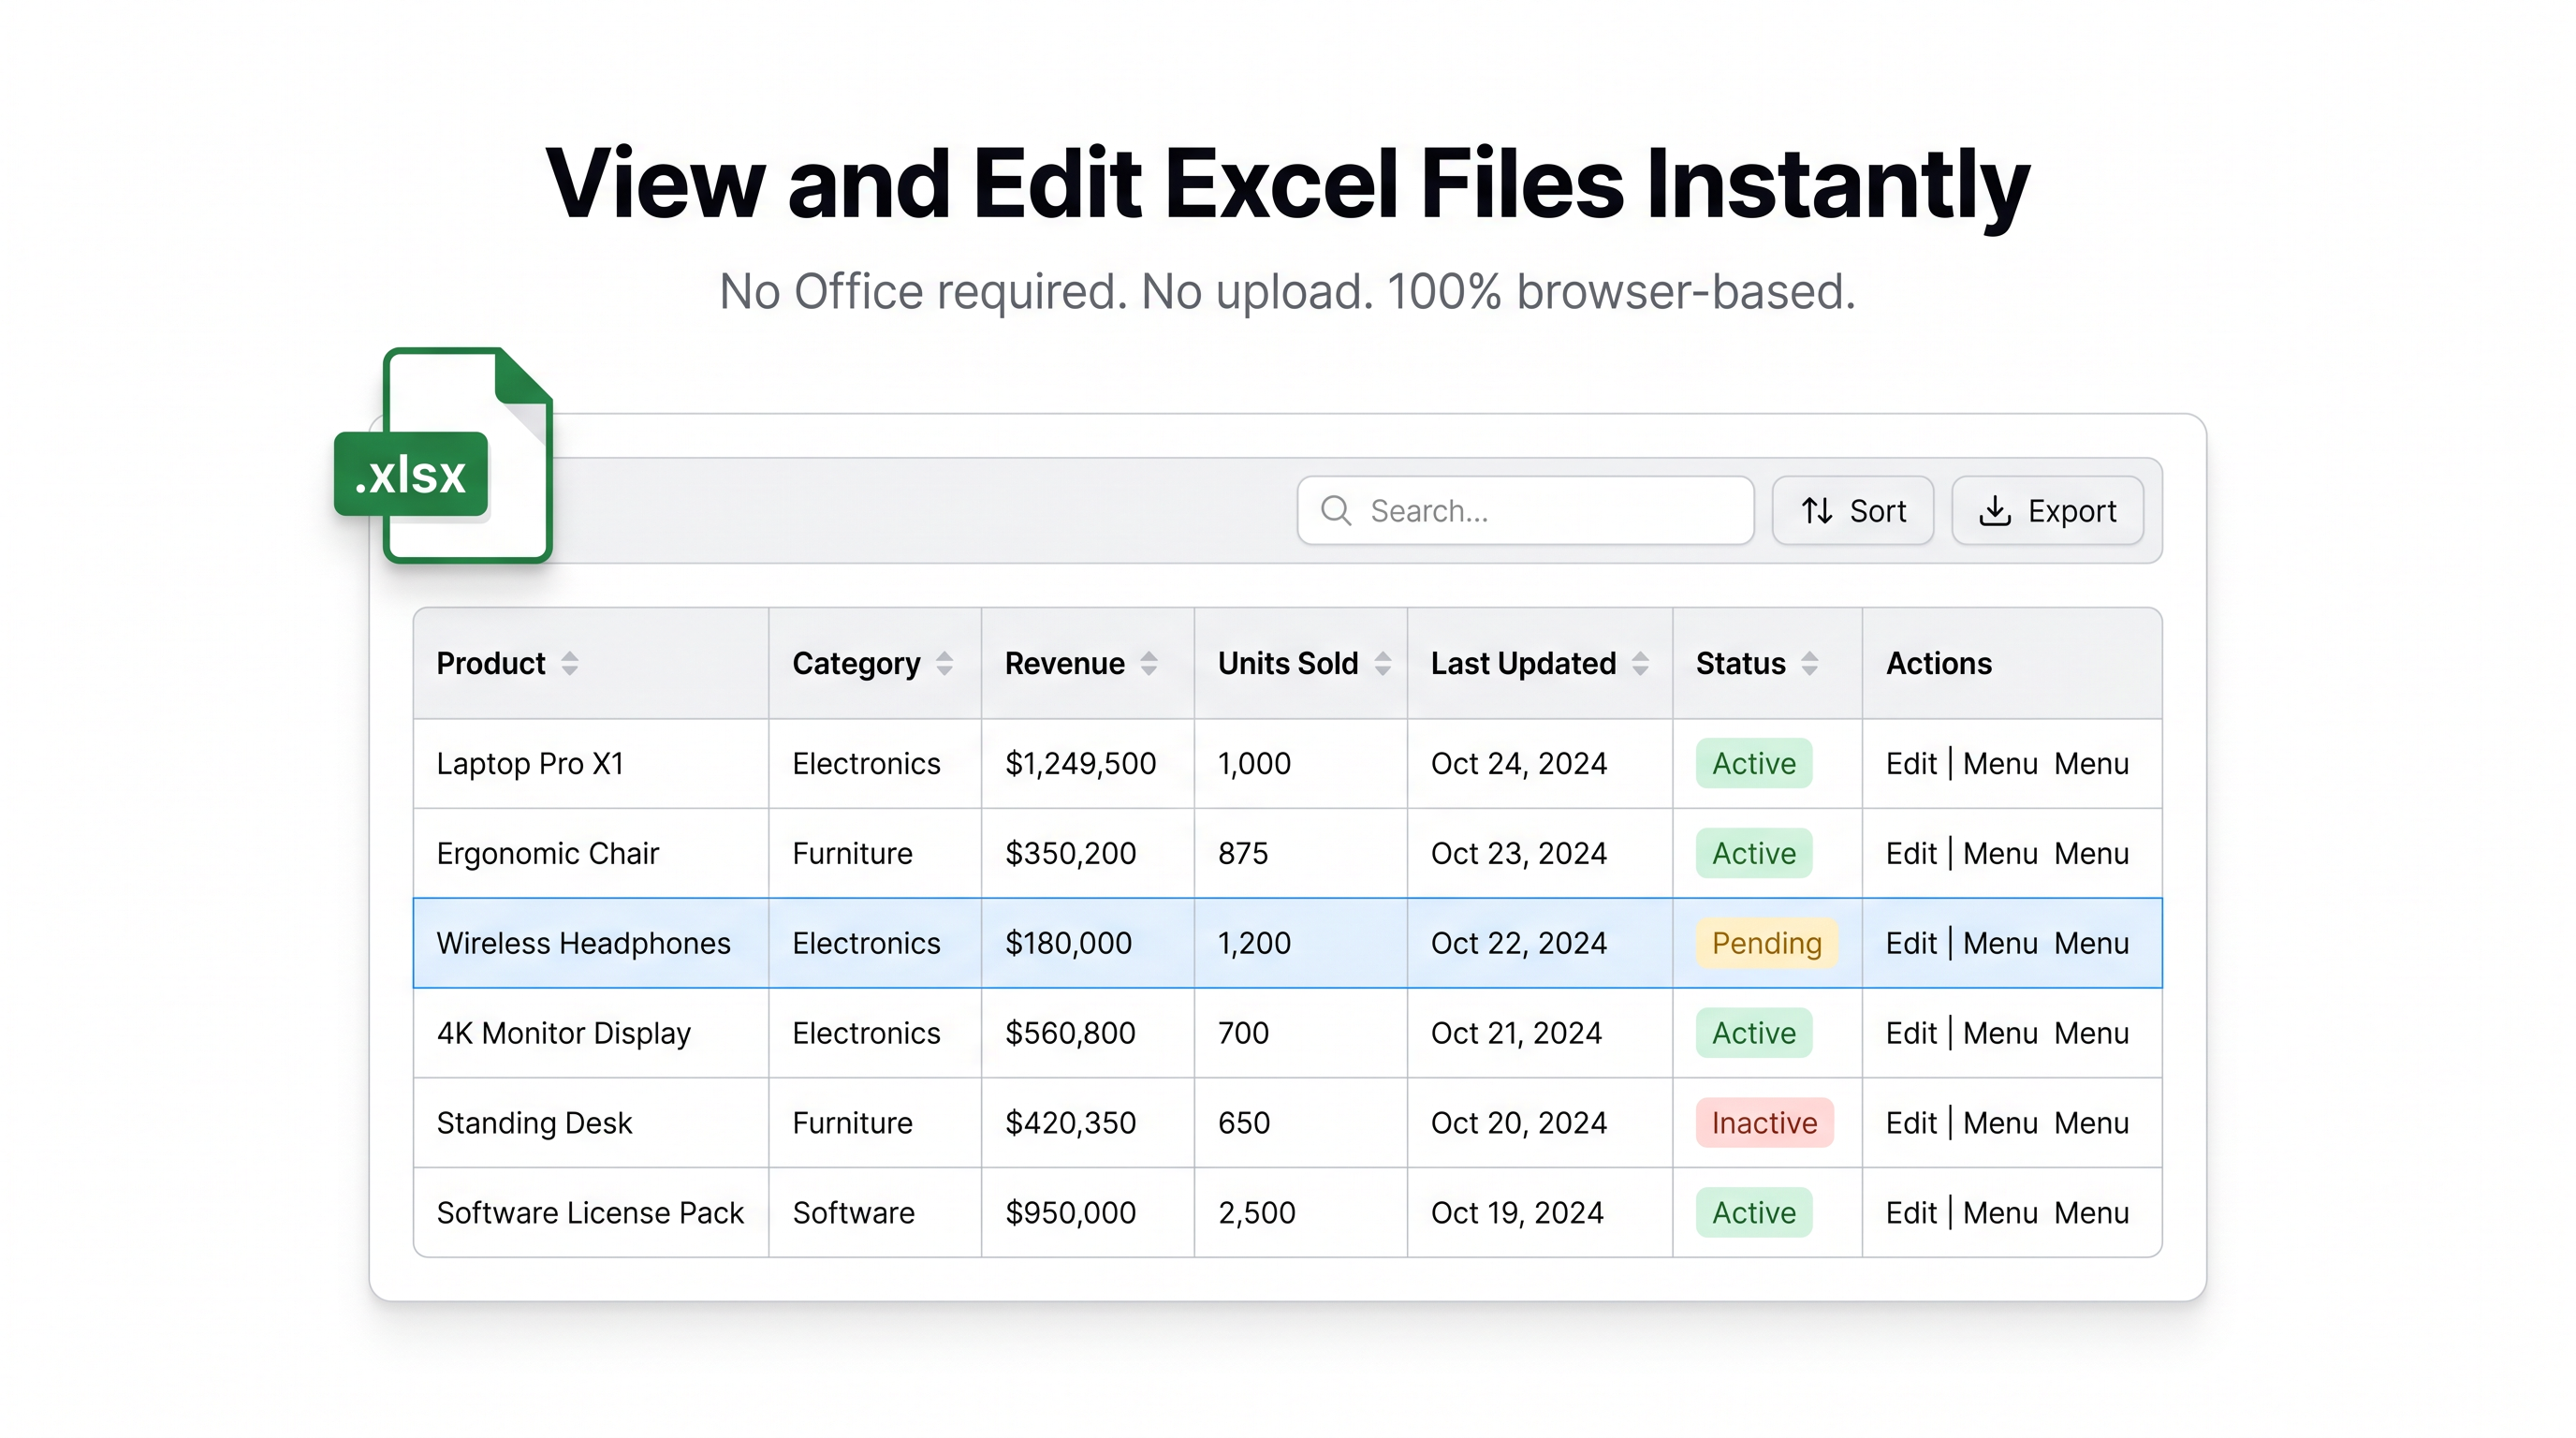
Free Online Excel Viewer & Editor — No Office, No Upload
Guide
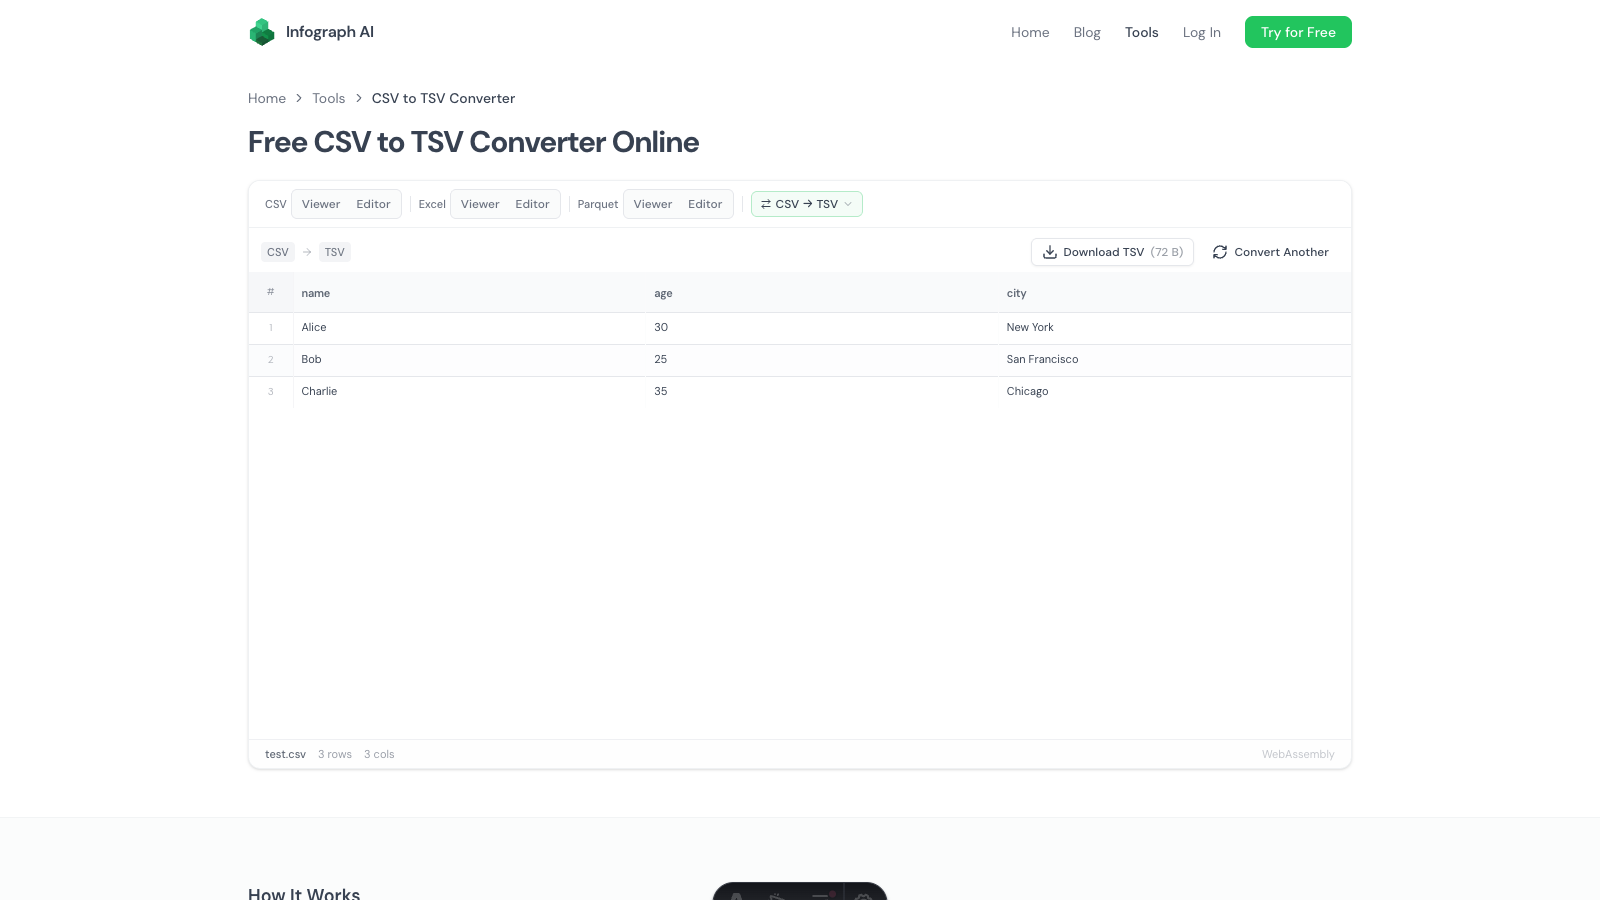
Free CSV to TSV Converter Online — Tab-Delimited in One Click
Convert CSV files to TSV (tab-separated values) instantly in your browser. No upload, no Python, no install. Your data never leaves your device.
Read articleMore articles
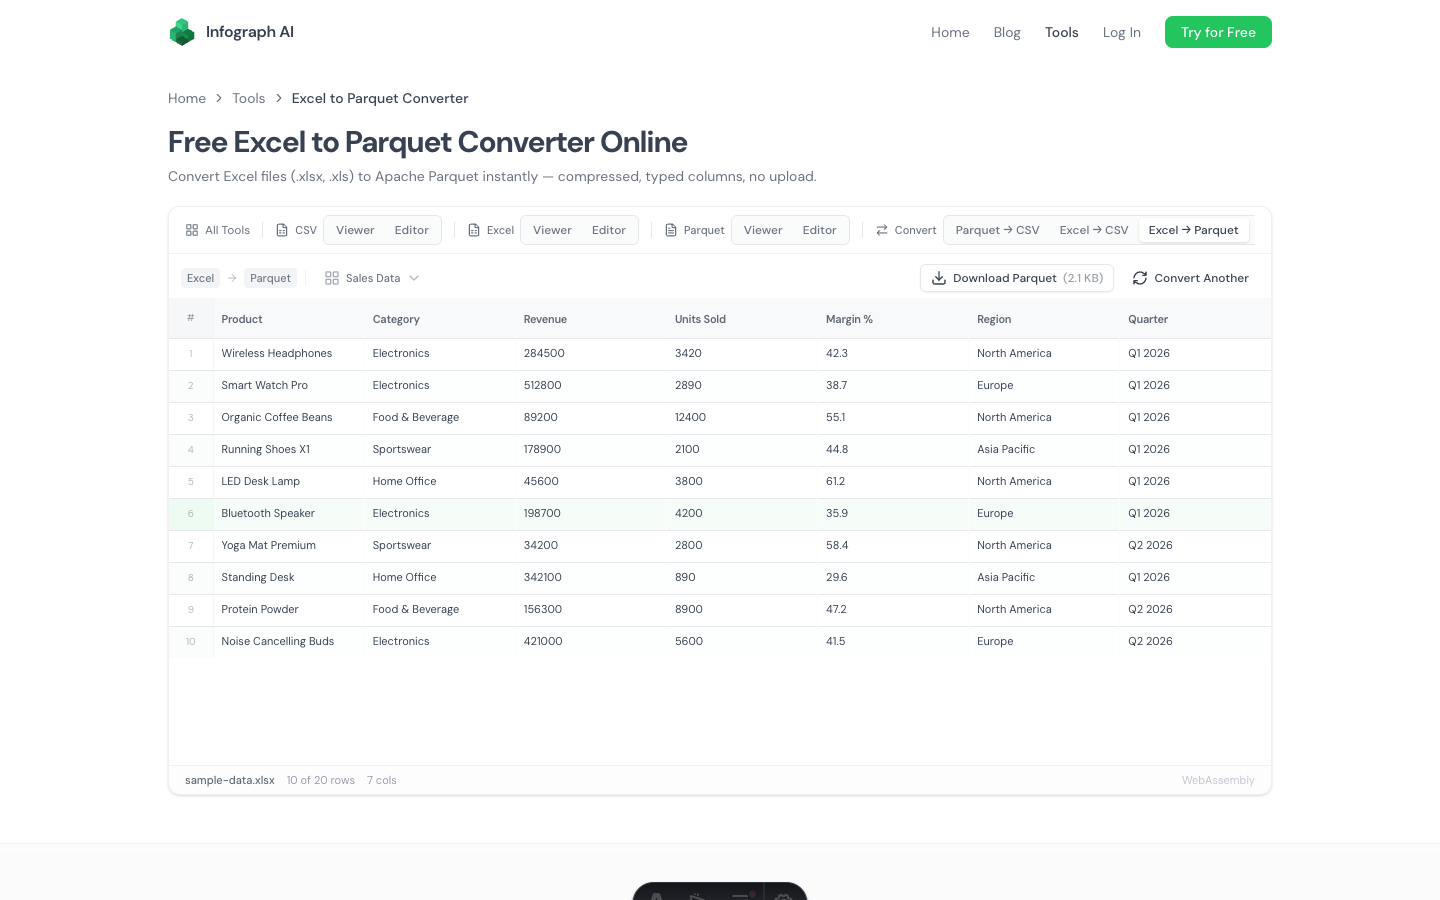
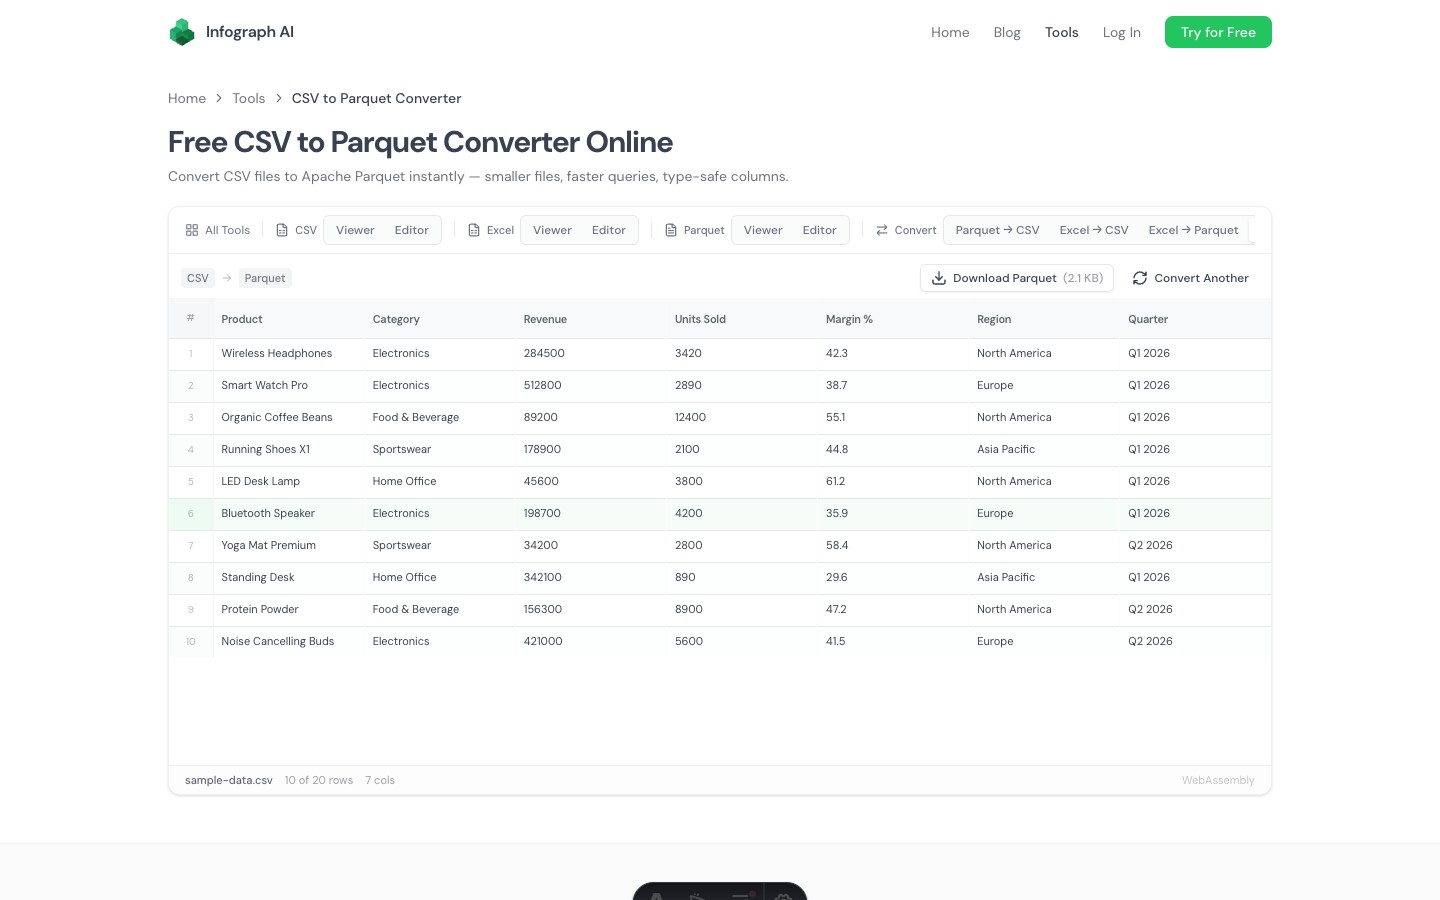
Free Excel to Parquet Converter Online — Skip the CSV Step

Free Parquet to CSV Converter Online — No Python, No Upload
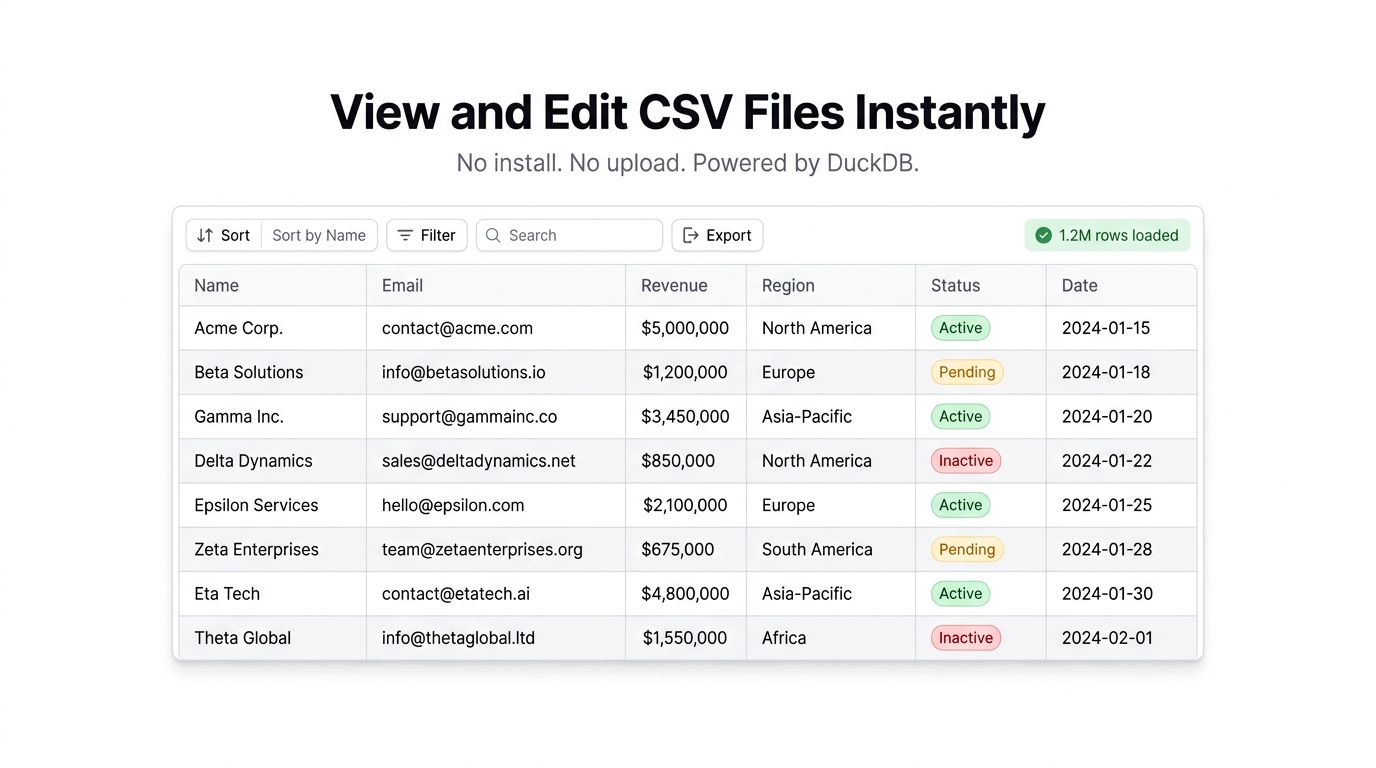
Free Online CSV Viewer & Editor — No Install, No Upload
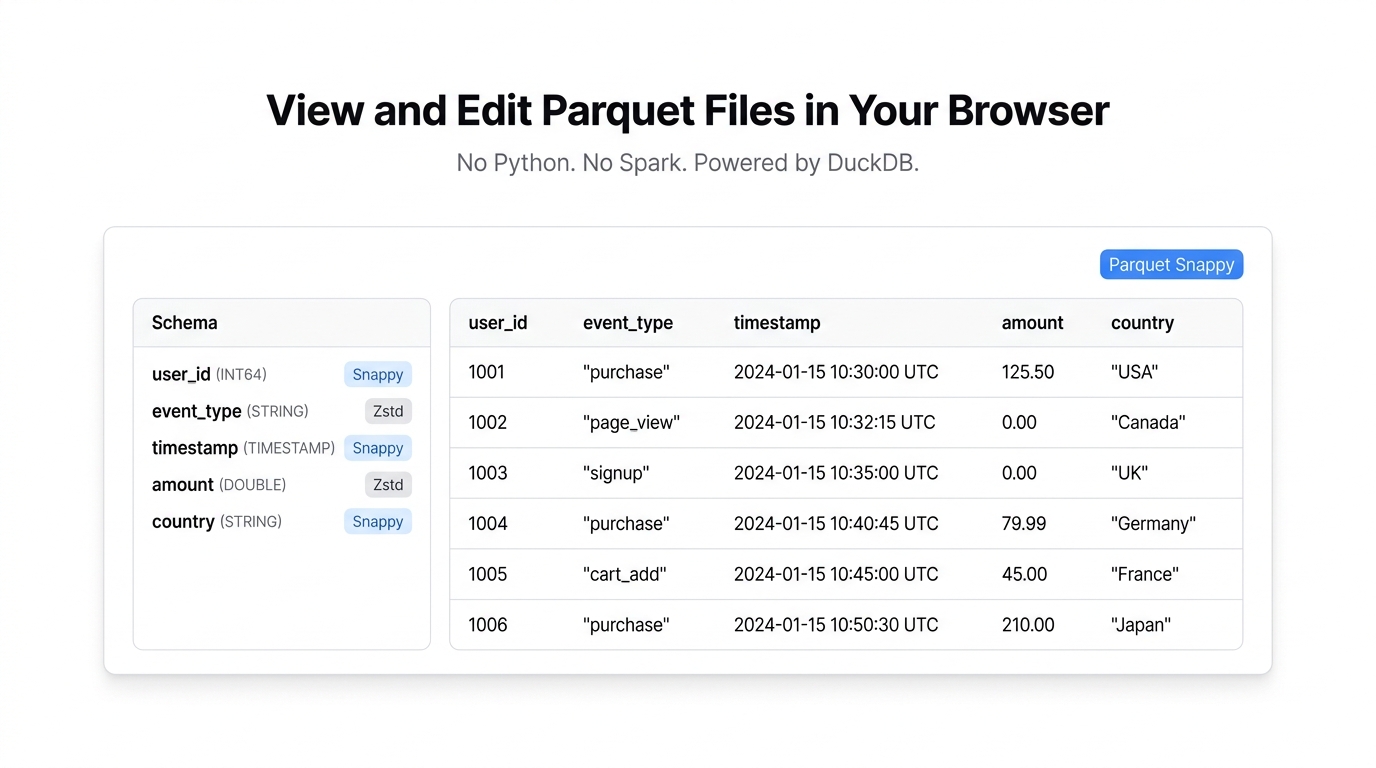
Free Online Parquet Viewer & Editor — No Python Required
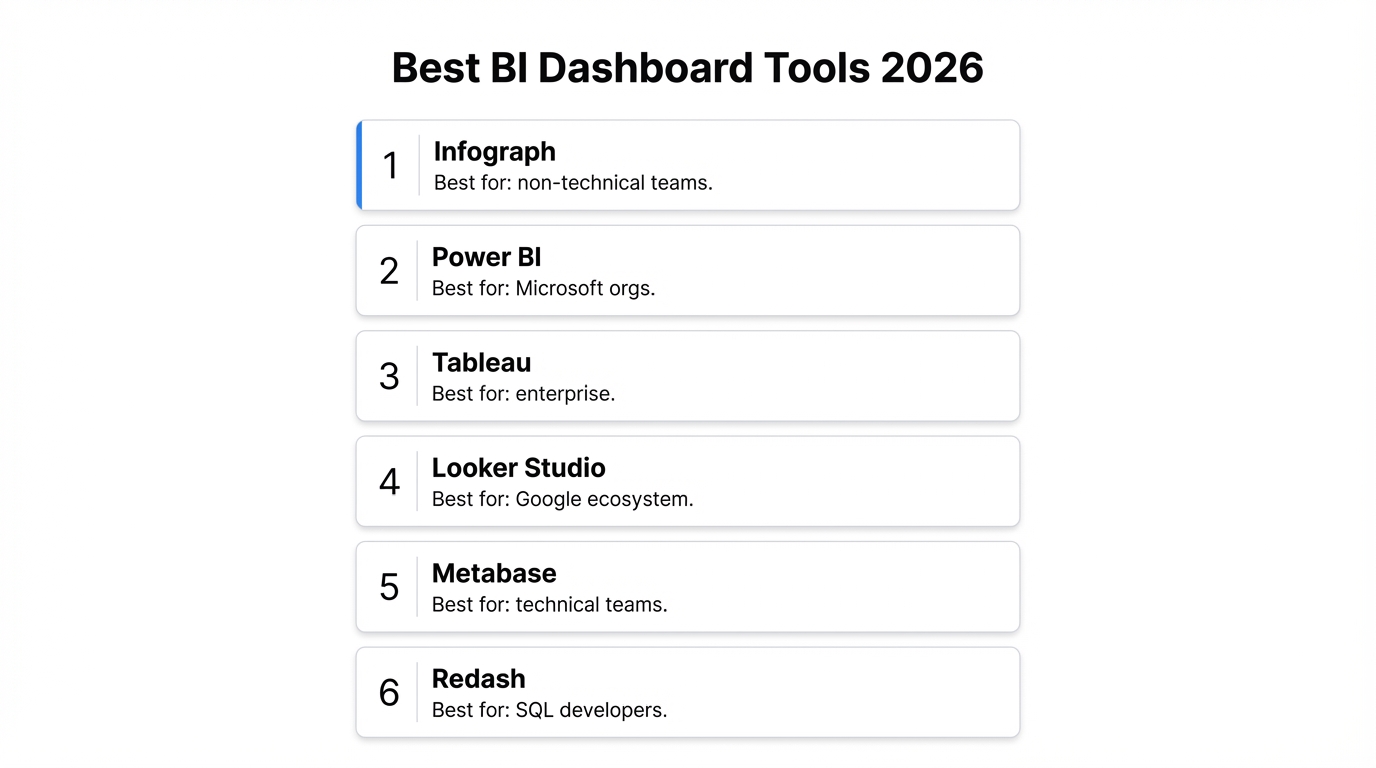
6 Best BI Dashboard Tools in 2026 (Honest Comparison)

Create a Dashboard Online for Free — No Credit Card Needed
Guide
8 Google Sheets Dashboard Examples You Can Build Today
Concrete Google Sheets dashboard examples with step-by-step build instructions, real limitations to watch for, and a faster alternative when Sheets hits its ceiling.
General
Power BI vs Excel Dashboard: An Honest Comparison
Power BI and Excel both build dashboards, but they solve different problems. Here's when each one wins, where they fall short, and what to use if neither fits.
Guide
How to Build a Sales Dashboard (Without Writing a Line of Code)
Sales teams deserve dashboards that show pipeline, revenue, and rep performance in real time — without waiting on engineering. Here's how to build one from your existing data in minutes.
Guide
The Best No-Code Dashboard Builder (Free Options Included)
Guide
How to Build a KPI Dashboard with AI
Guide
AI Data Visualisation Tools — What's Actually Worth Using
General
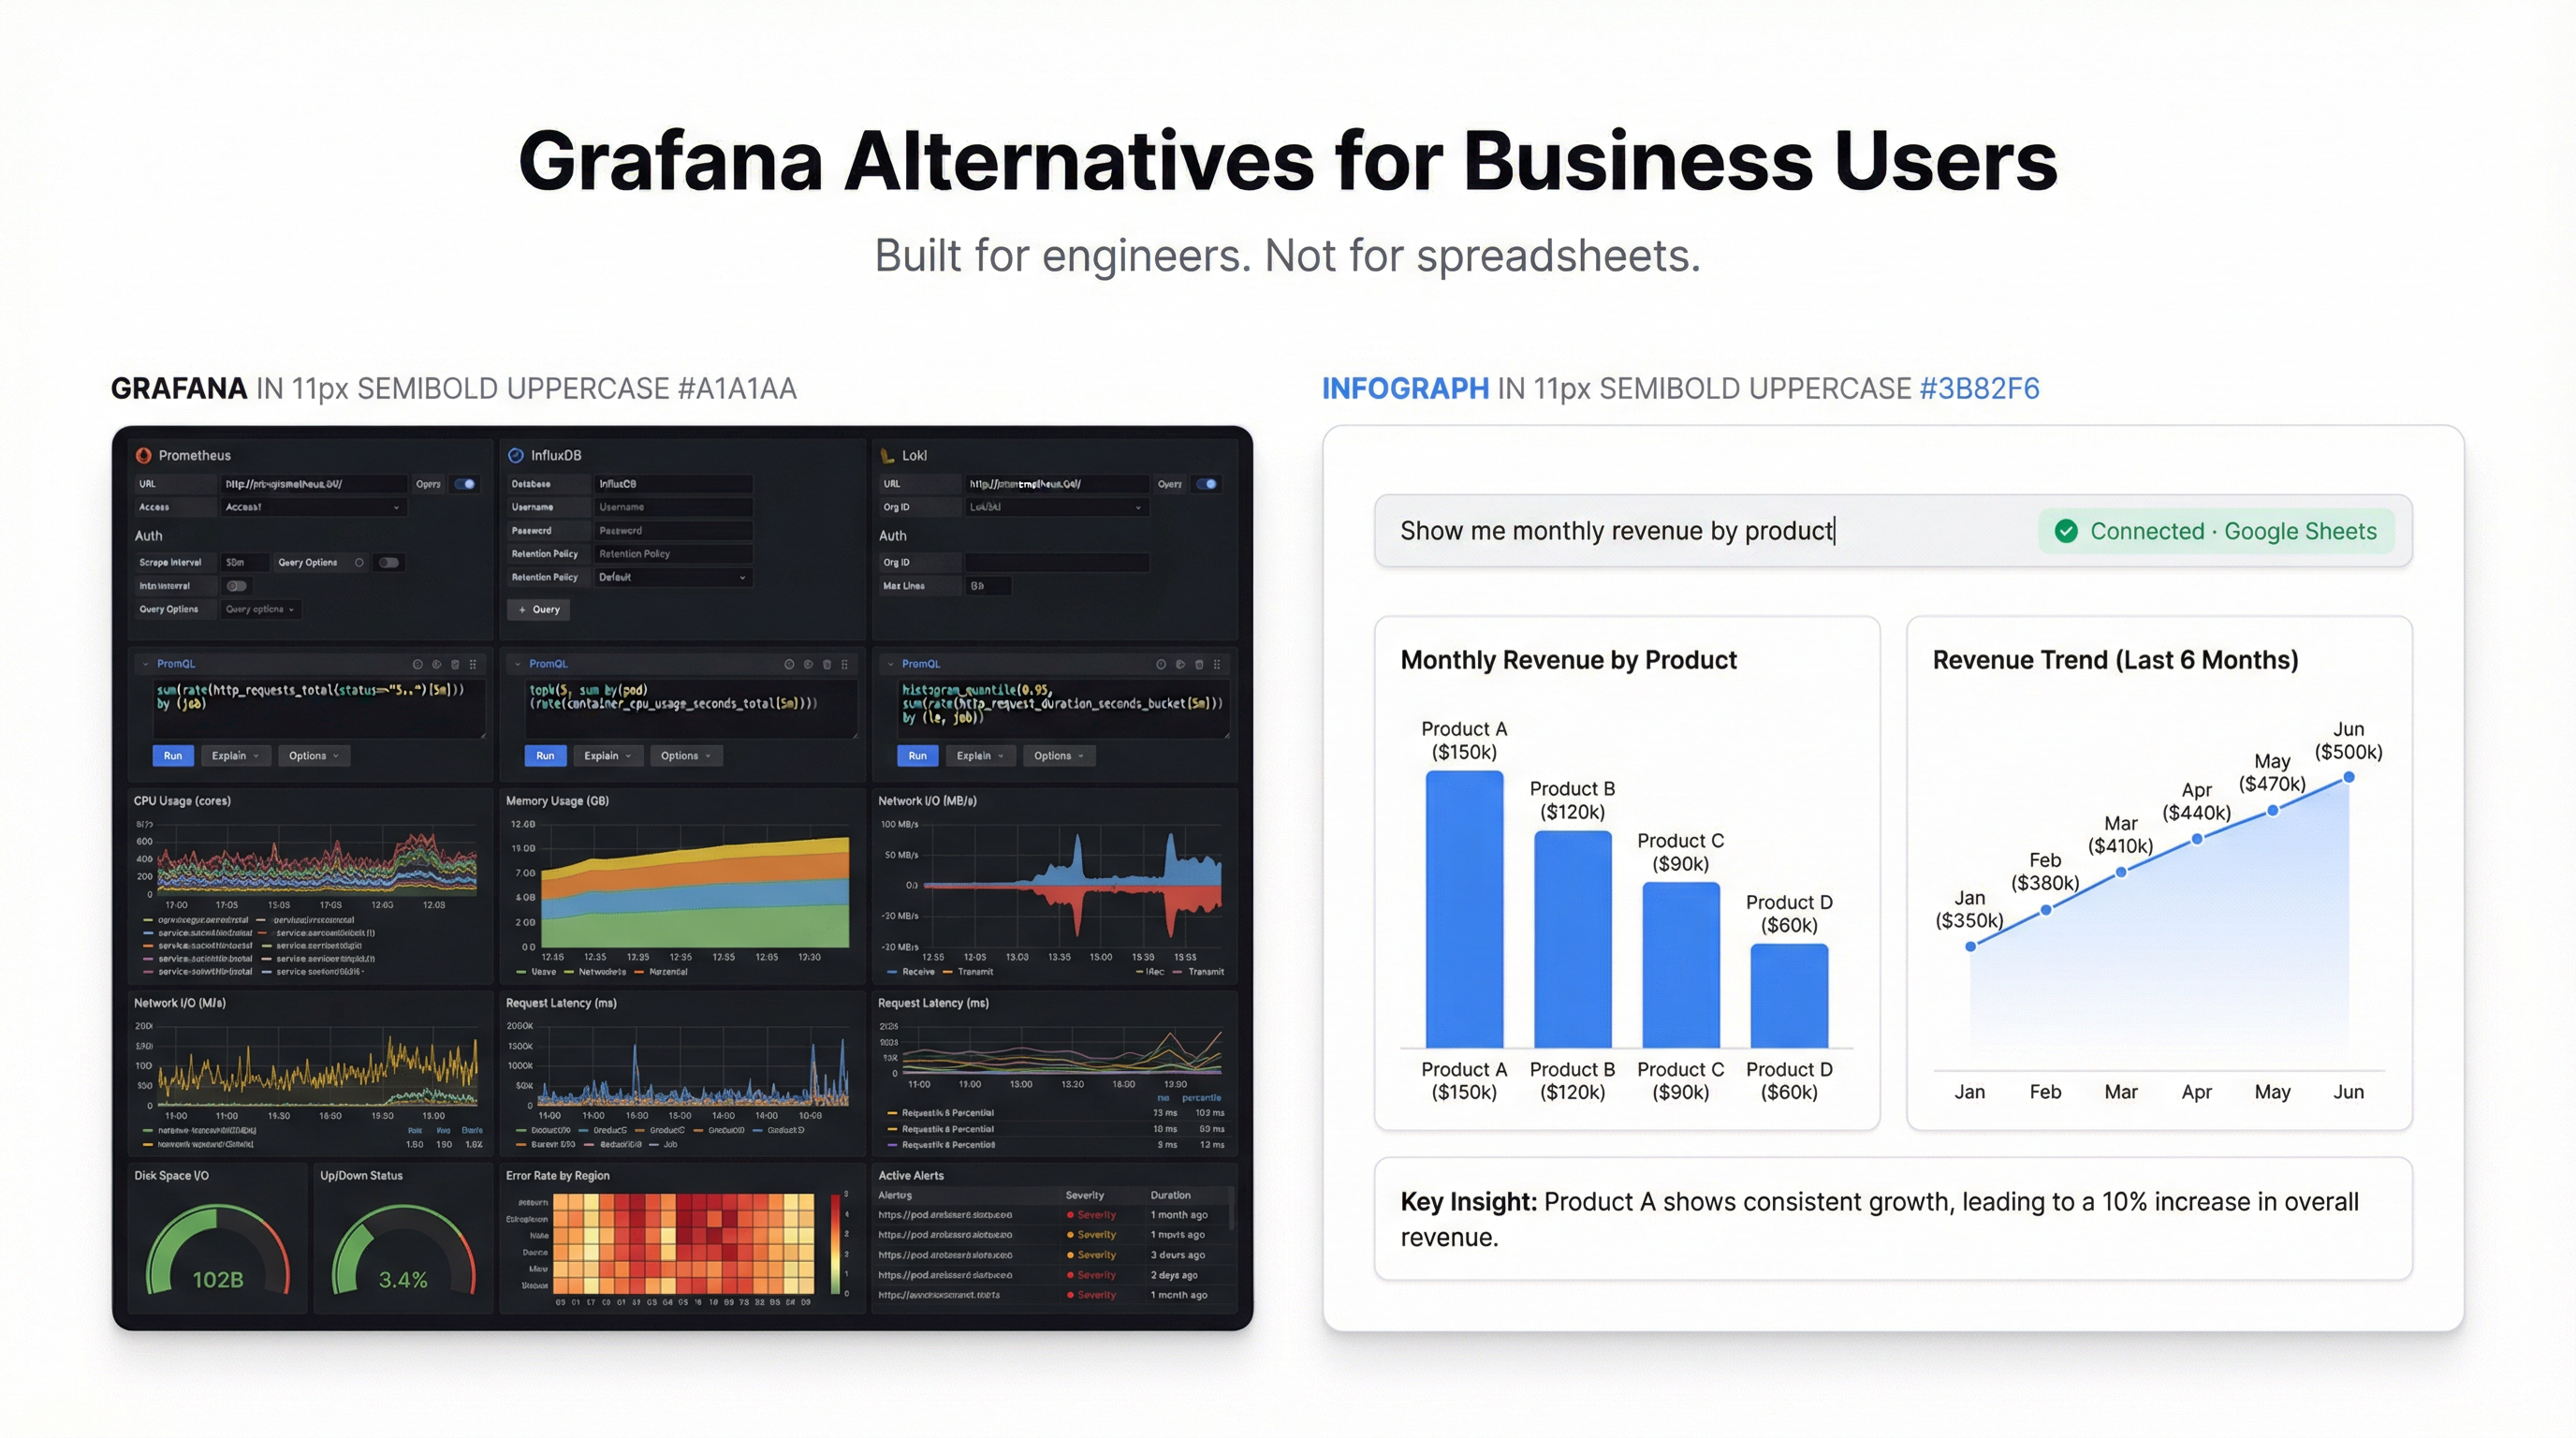
Grafana Alternative: Best Options for Business Users Who Don't Want to Touch PromQL
Dashboard
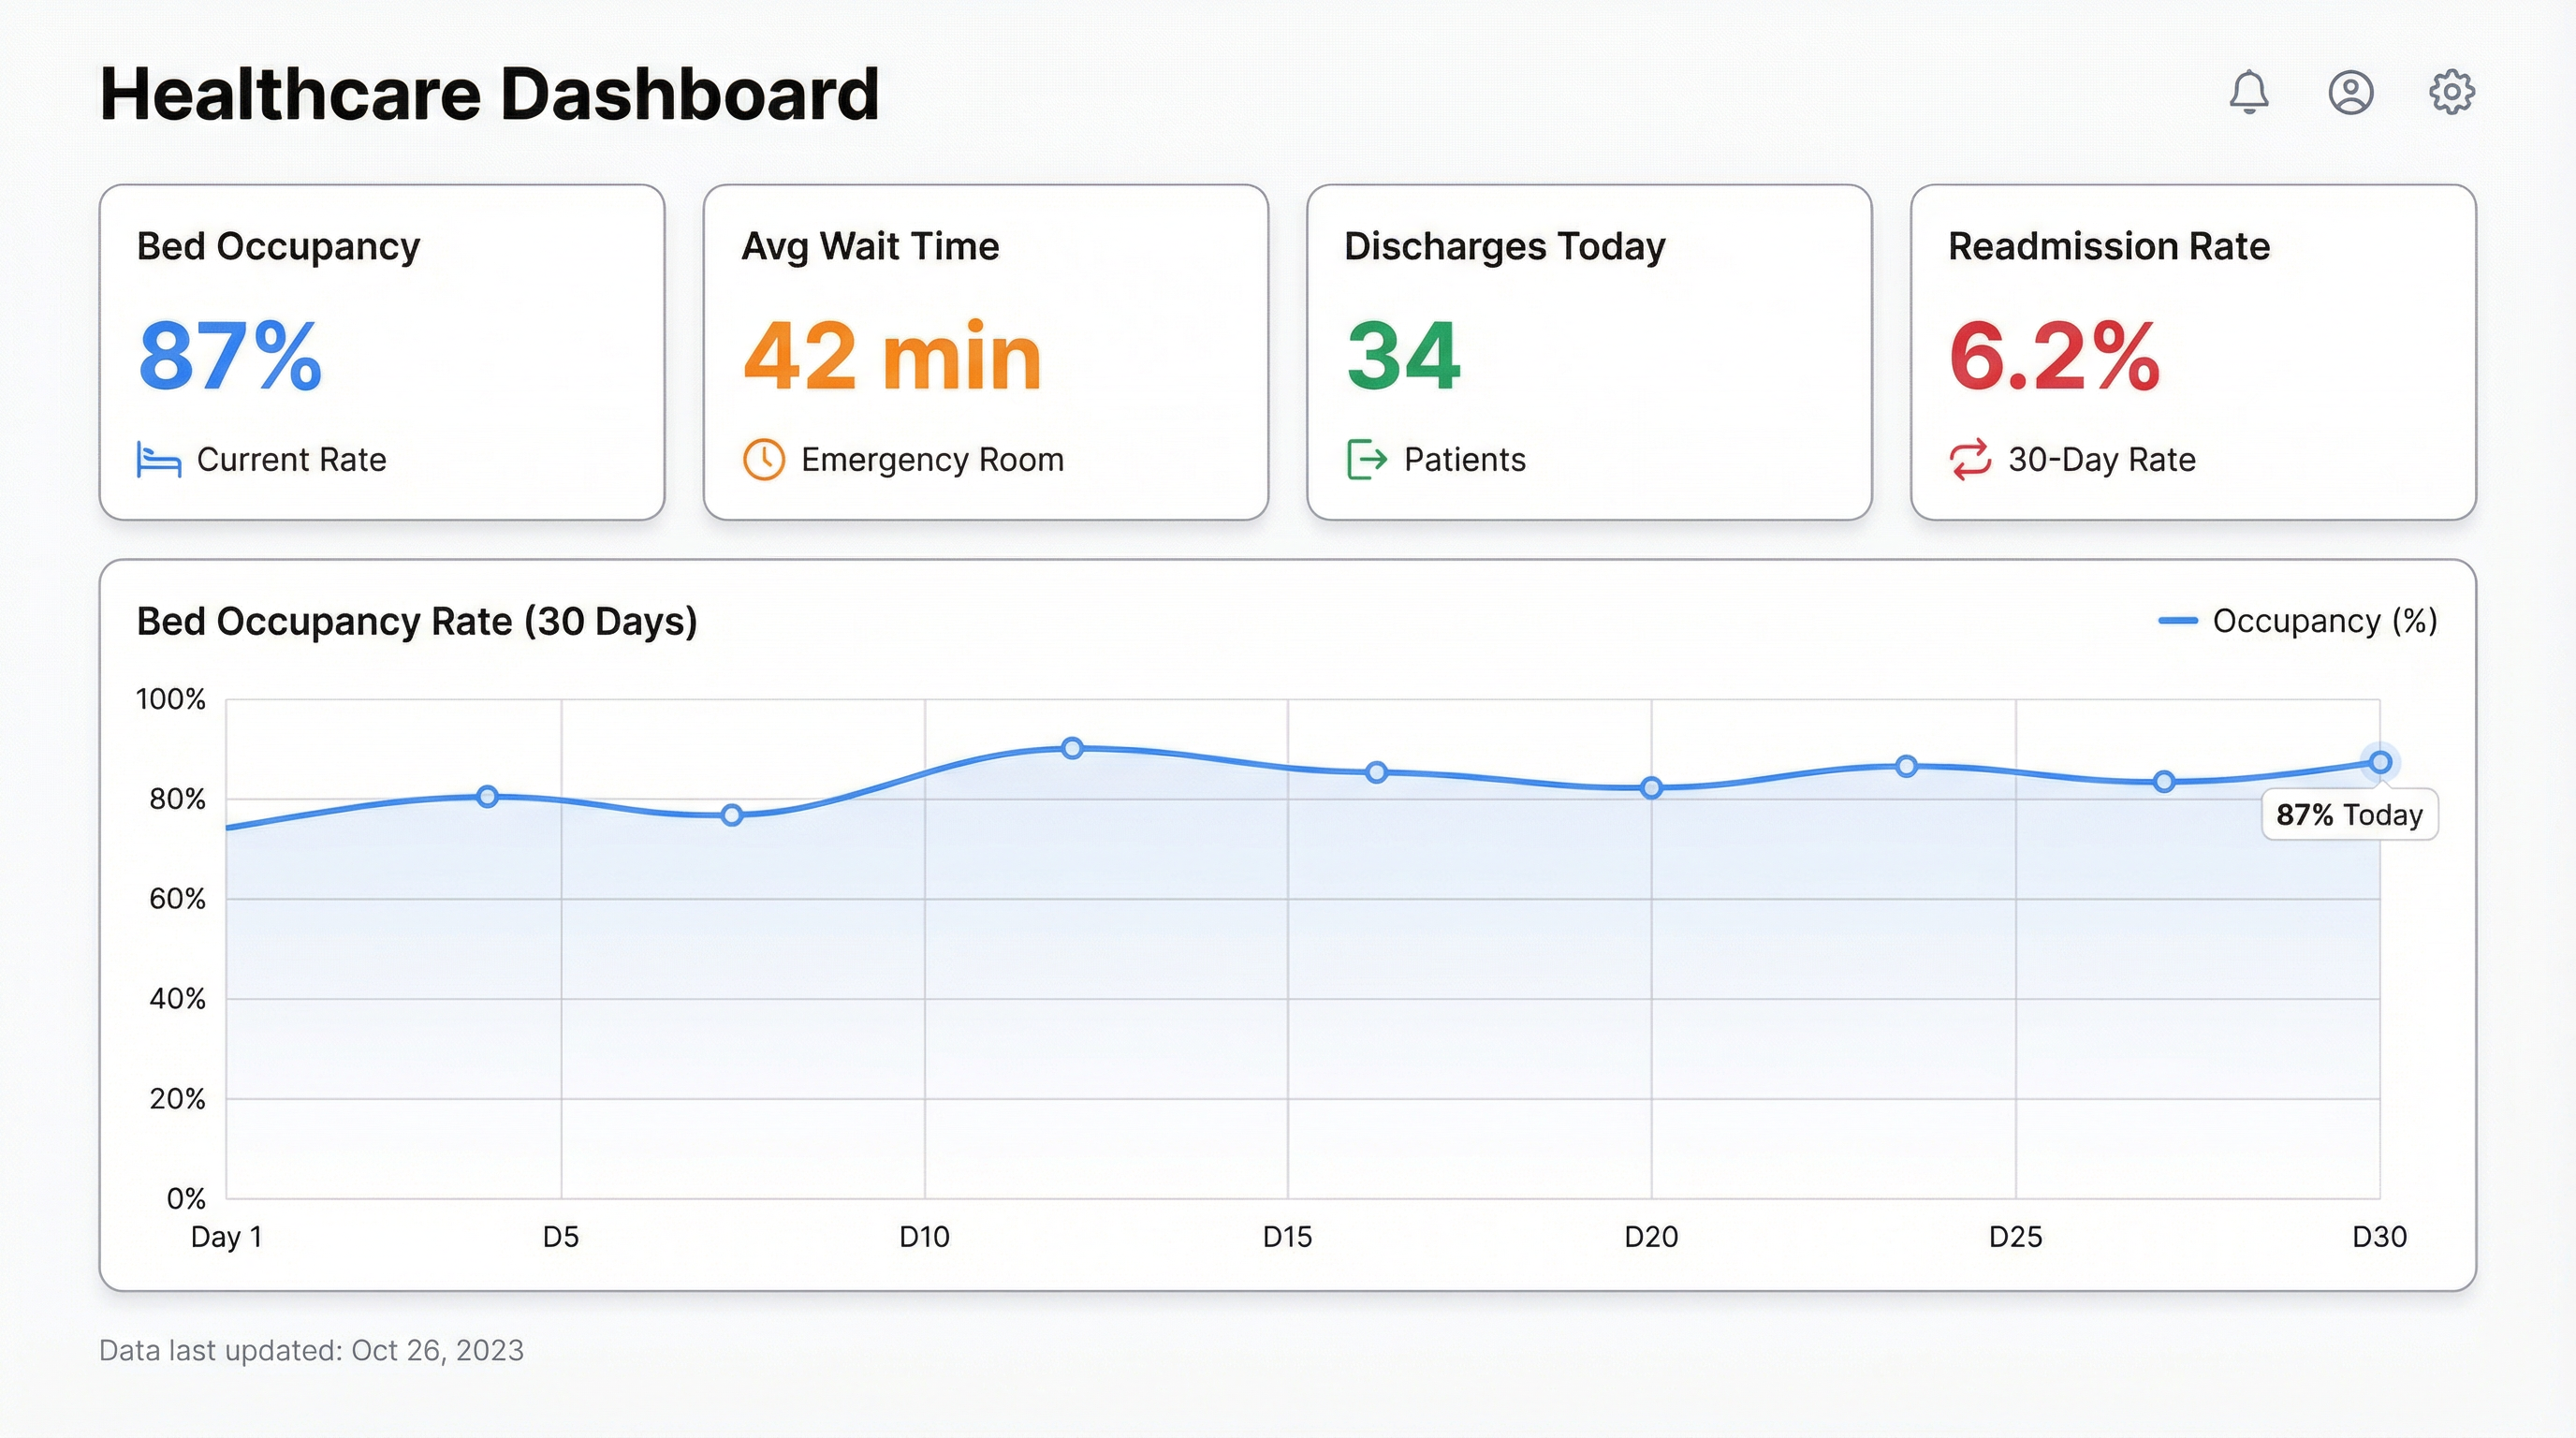
Healthcare Dashboard: Track Patient Flow, Bed Occupancy & Hospital Metrics with AI
Dashboard
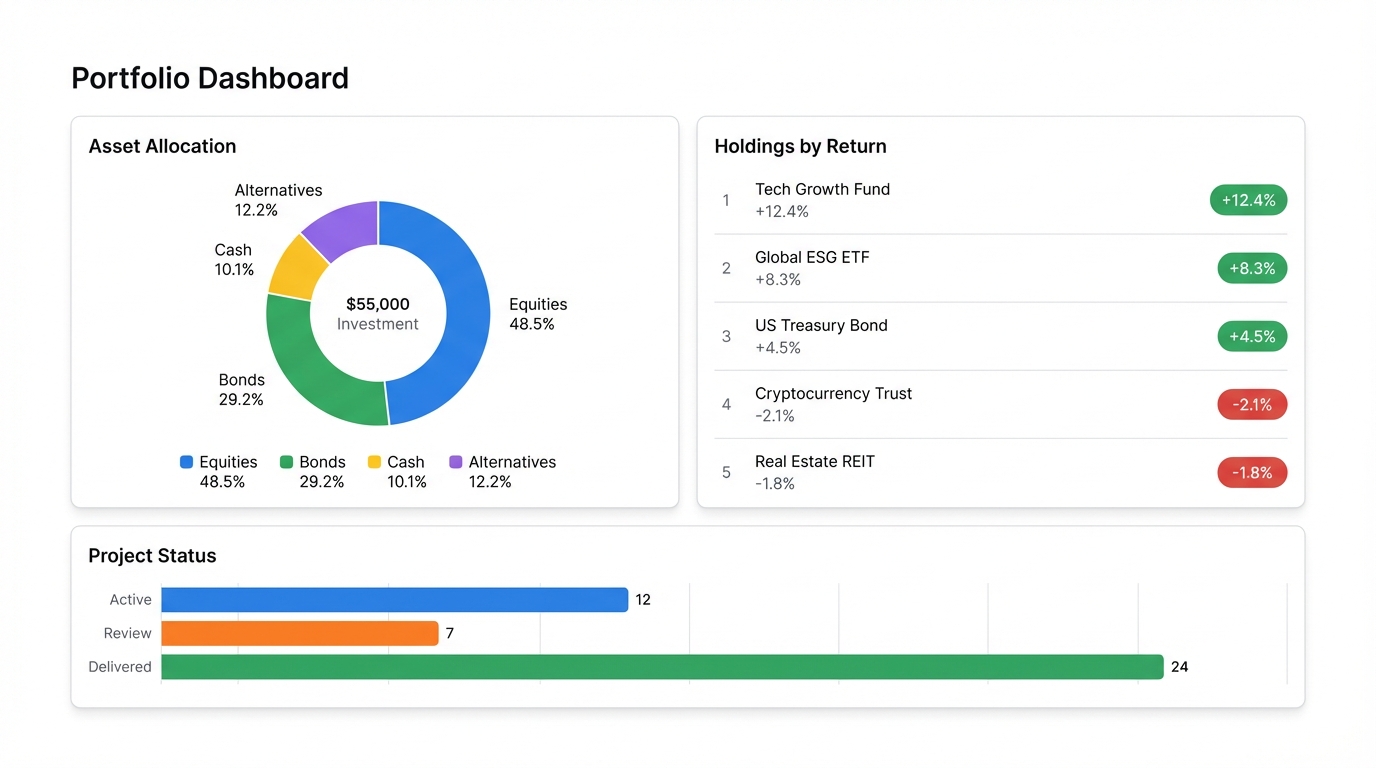
Portfolio Dashboard: Track Your Investments, Projects, or Work Samples in One Place
Feature
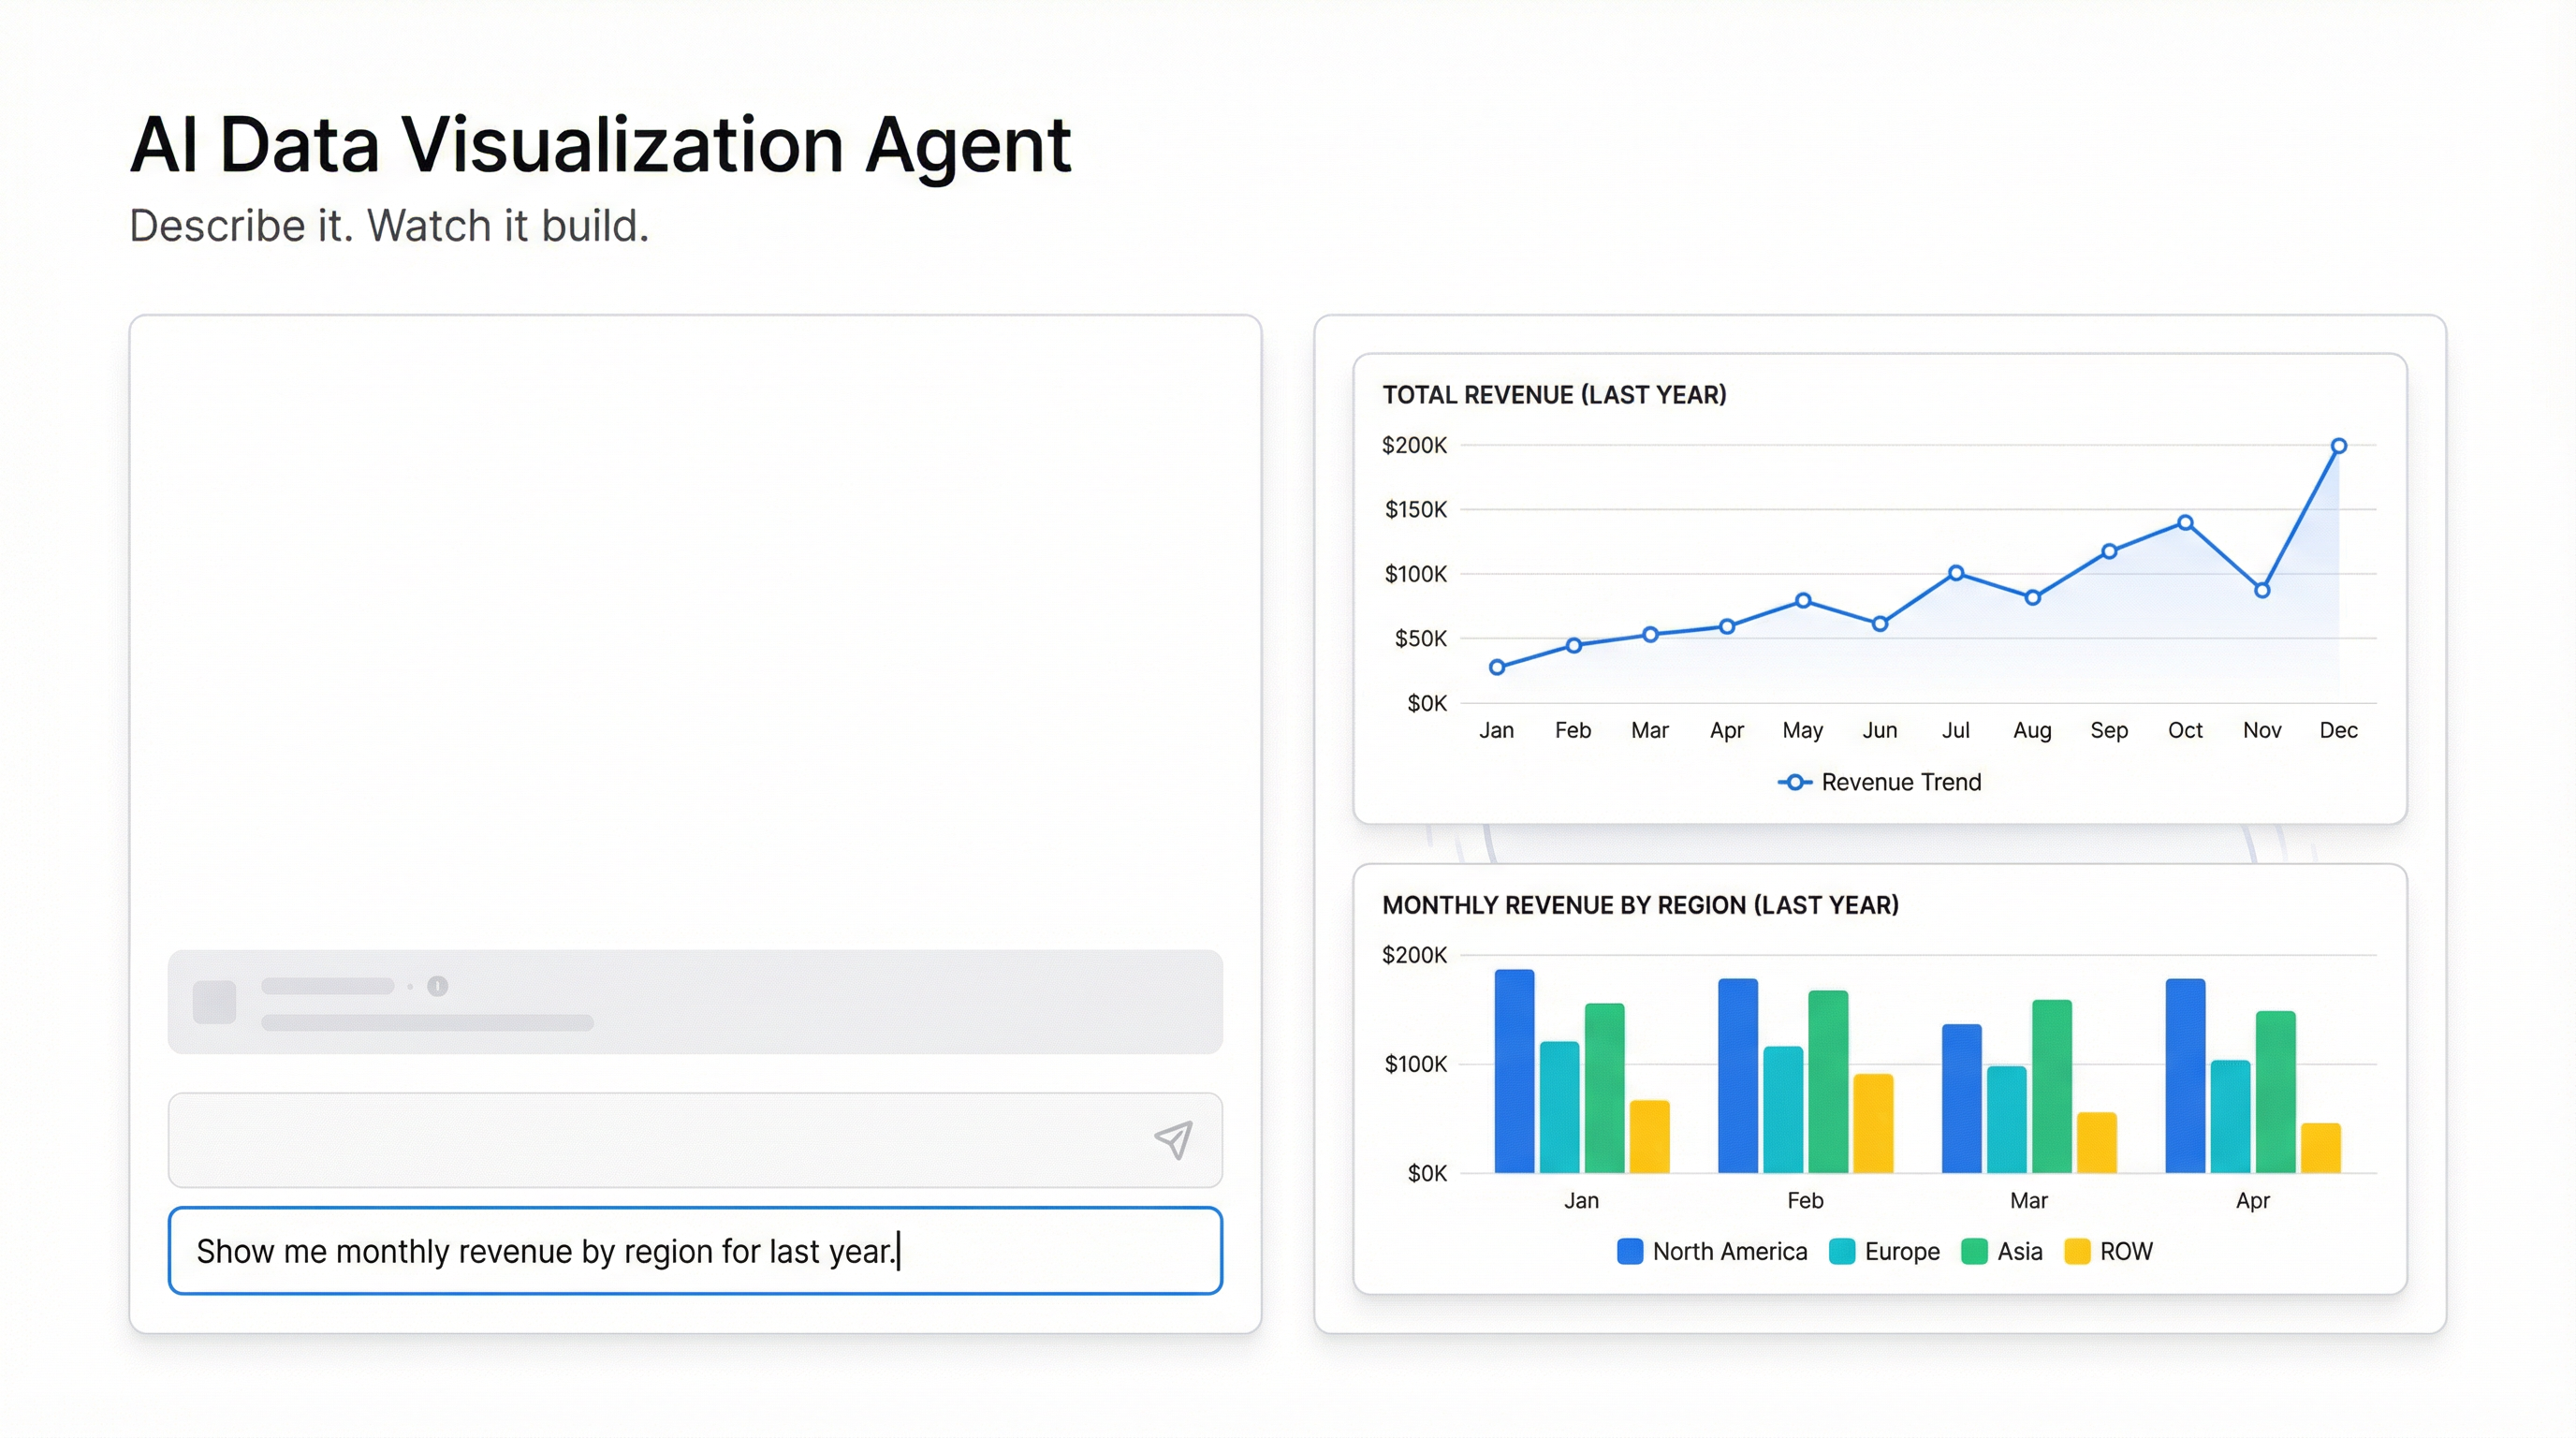
AI Data Visualization Agent: Stop Asking for Charts, Start Describing Them
Dashboard
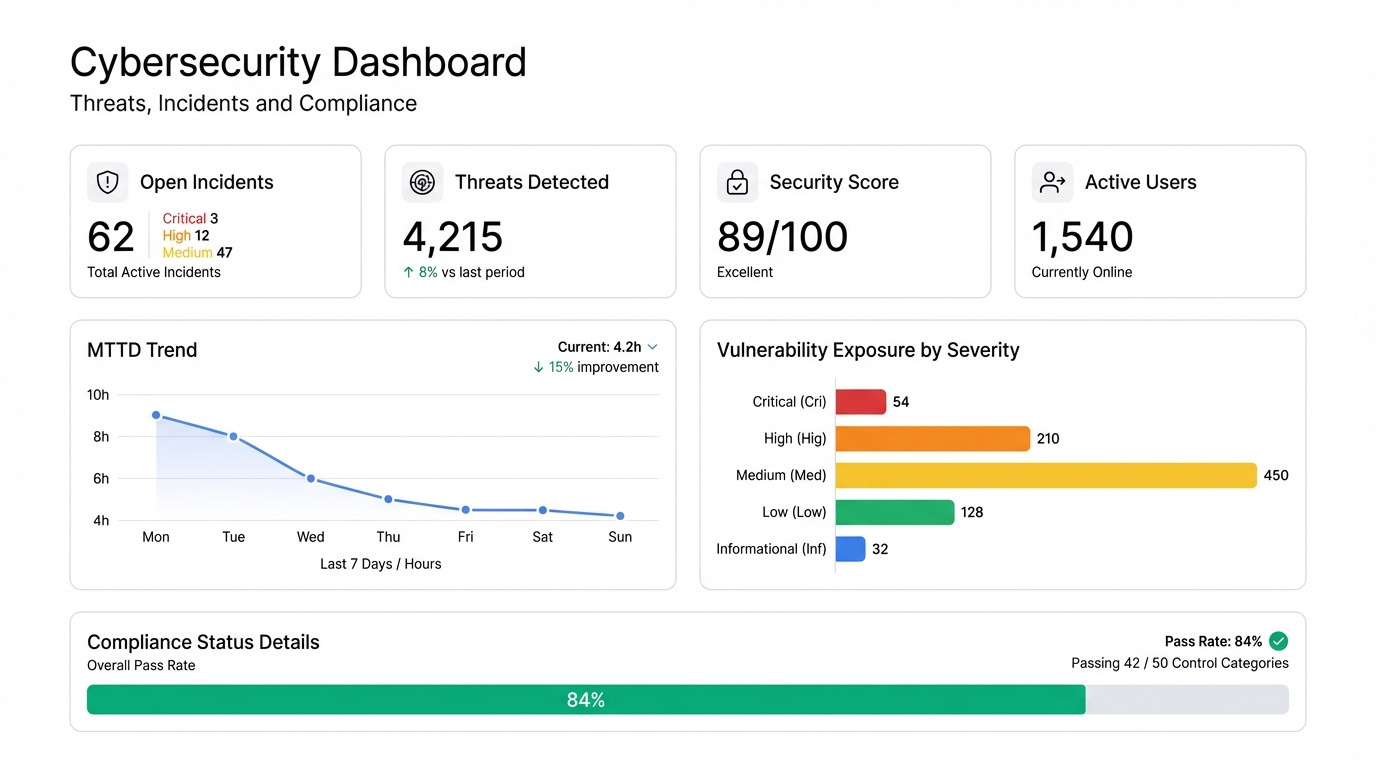
Cybersecurity Dashboard: Monitor Threats, Incidents, and Compliance in One View
Guide
Agency Client Dashboard: Give Every Client Their Own Live View of Their Data
Guide
The Best AI Dashboard Generators in 2026 (Free & Paid)
Guide
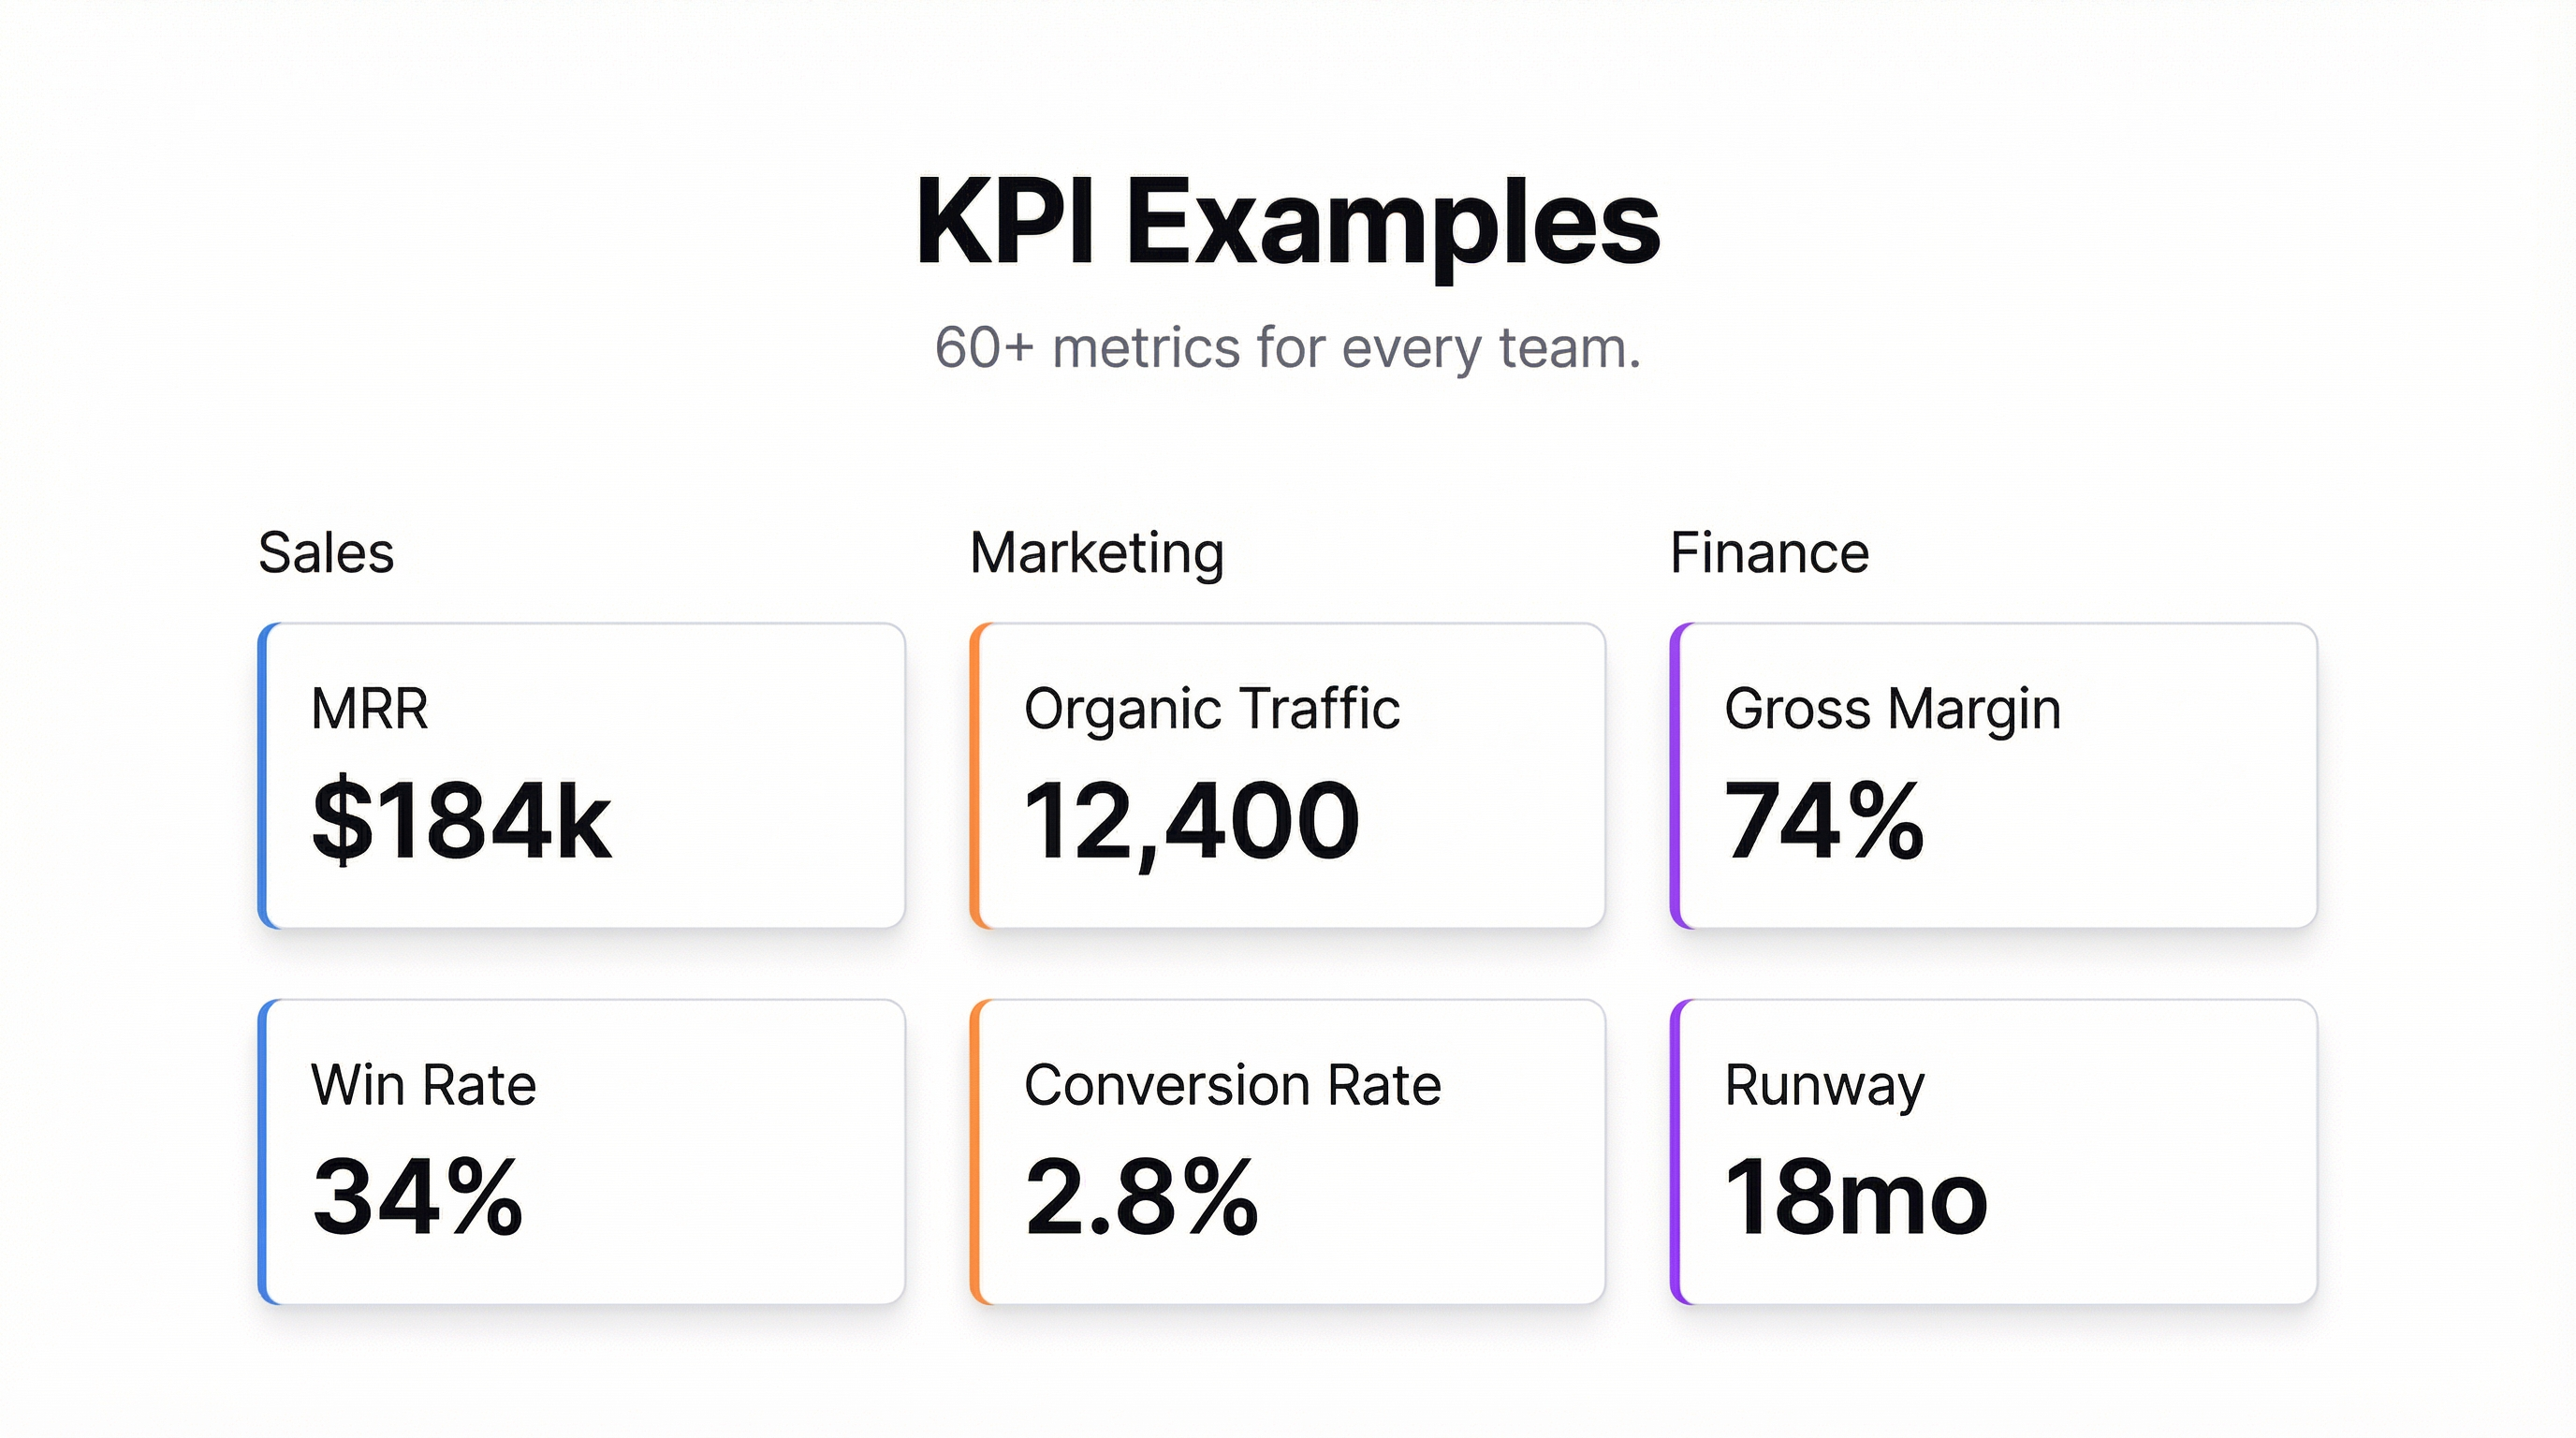
KPI Examples: 60+ Metrics for Every Team
Guide
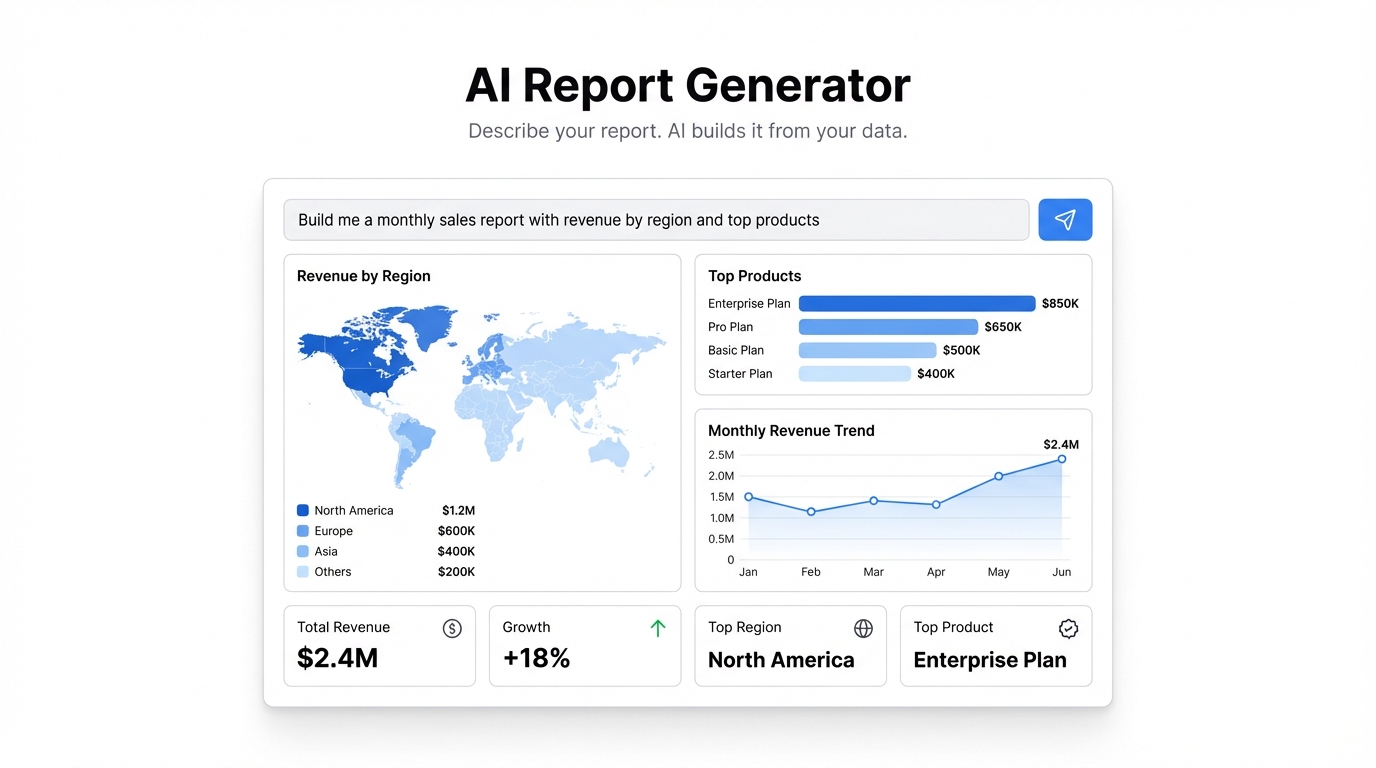
AI Report Generator: Build Interactive Reports From Your Data in Seconds
Guide
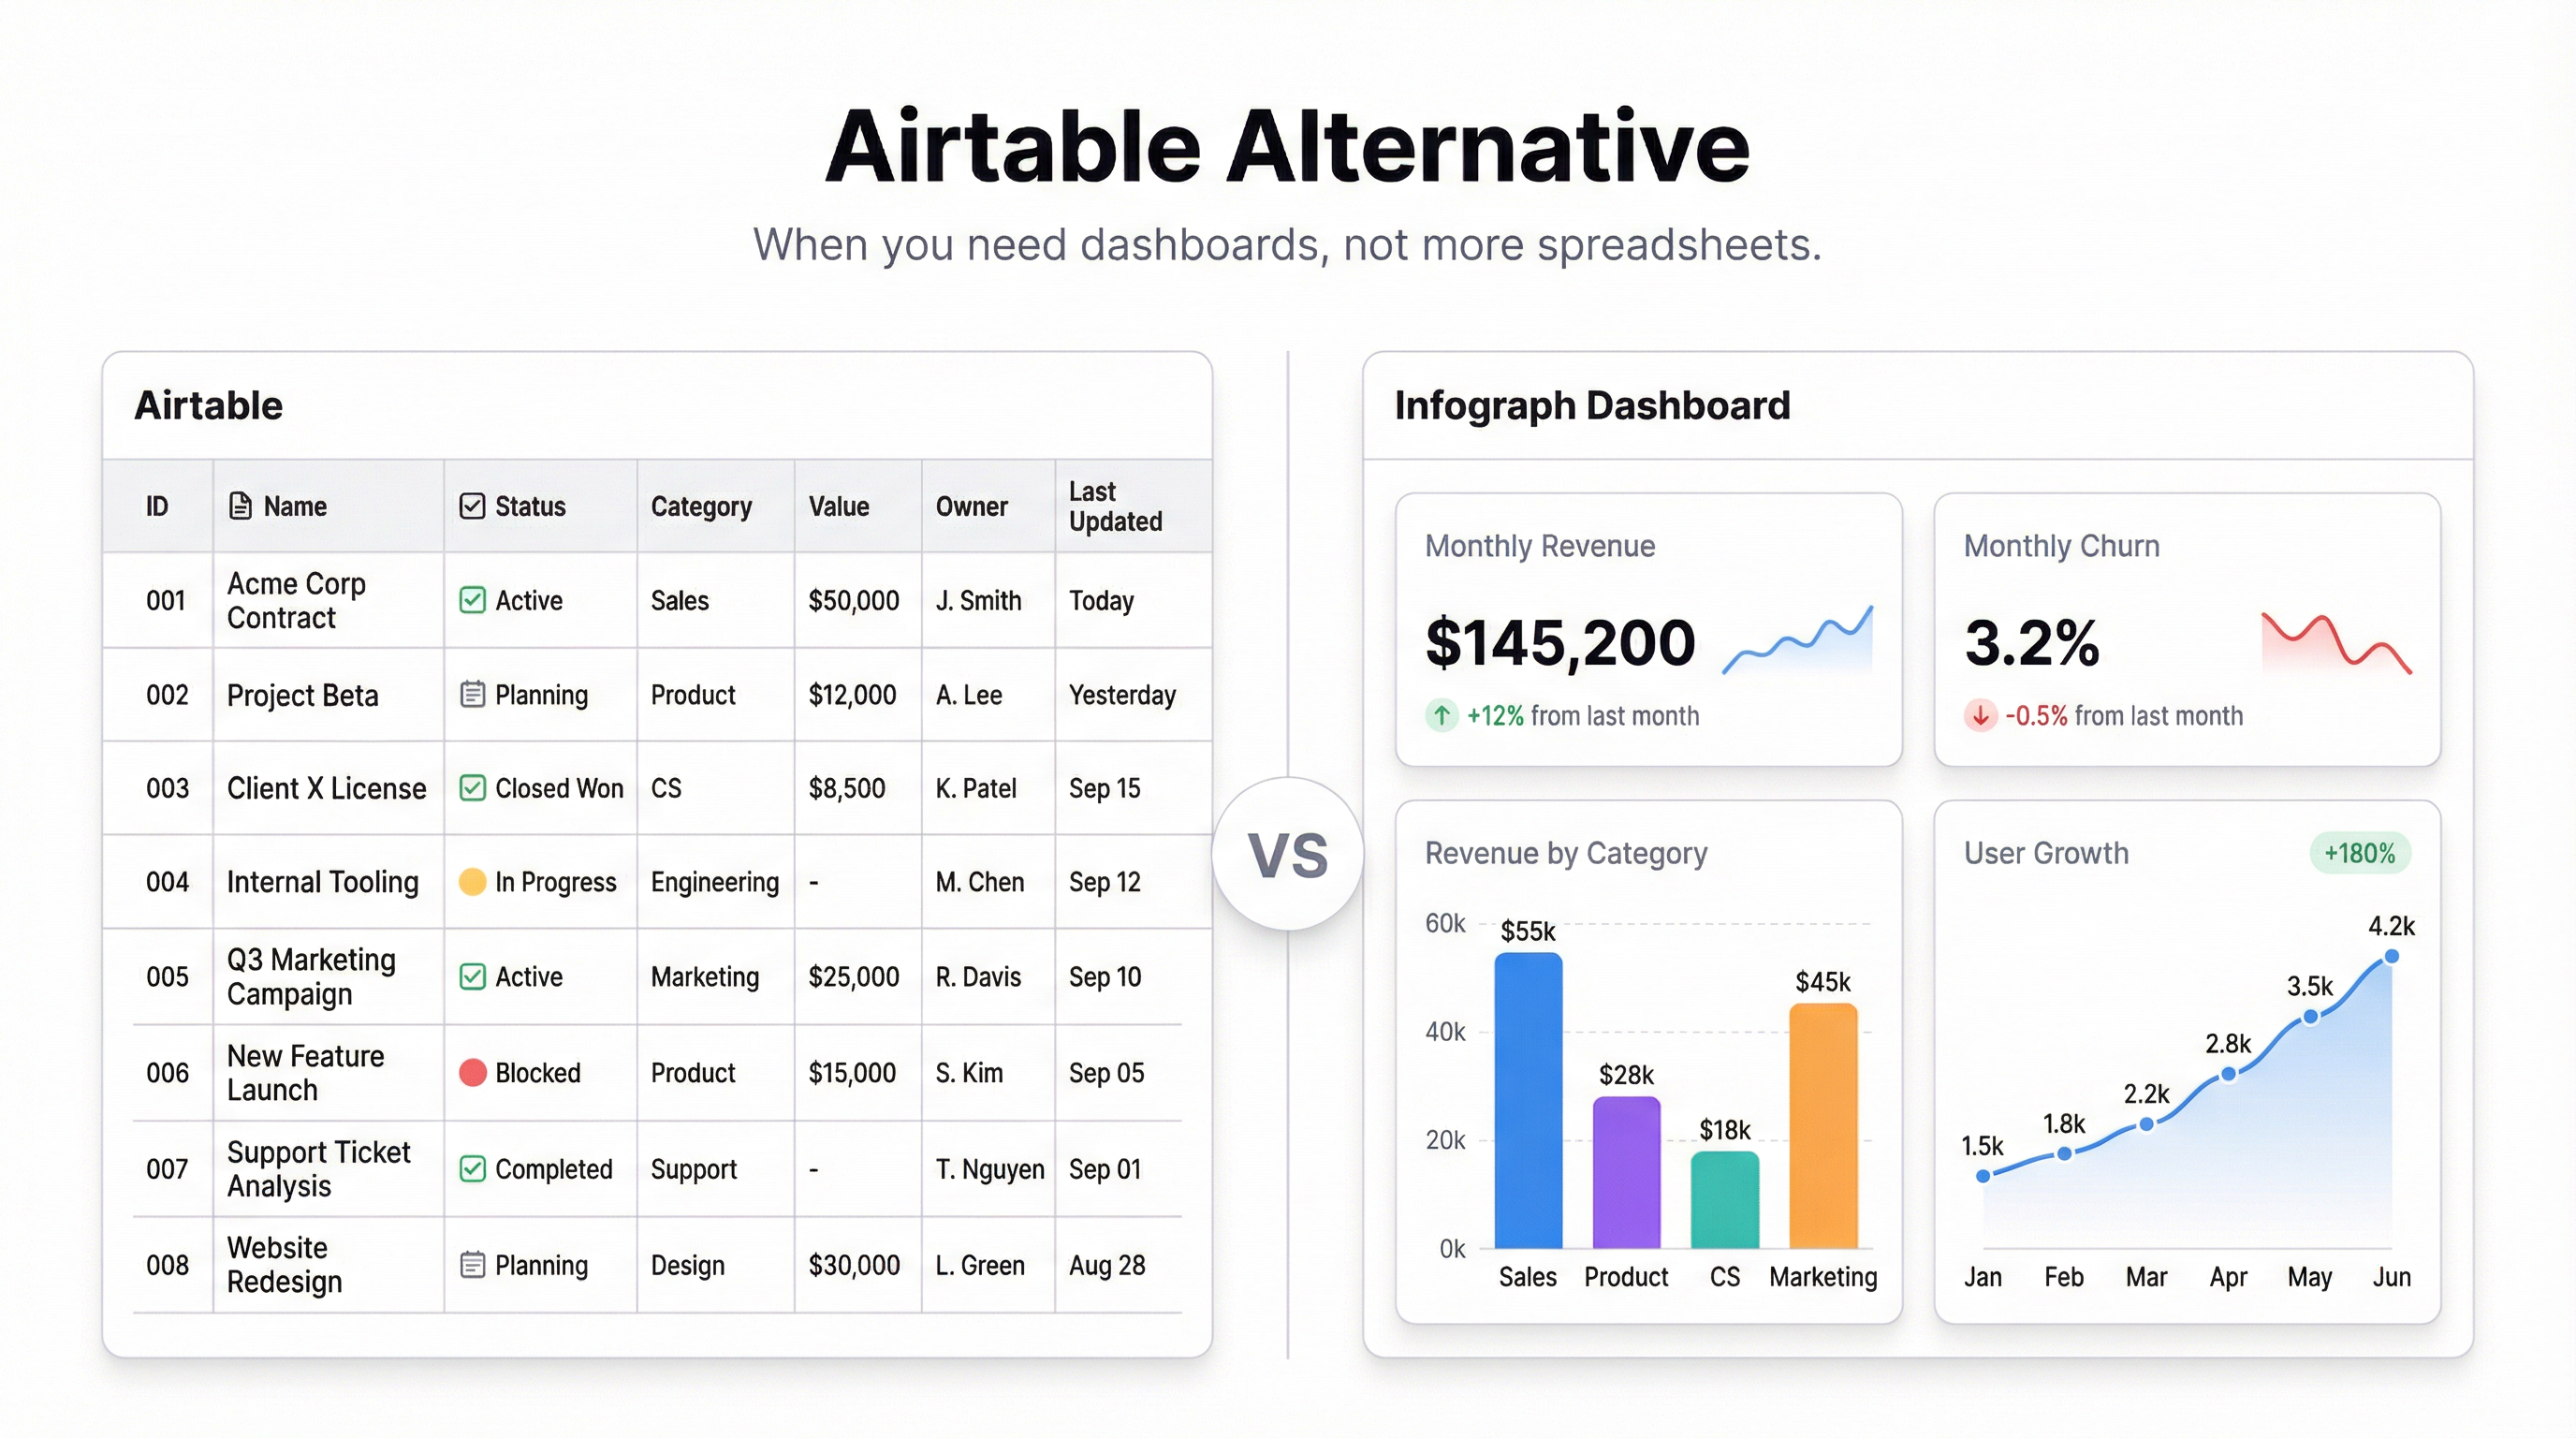
Airtable Alternative: When You Need Dashboards, Not More Spreadsheets
Guide
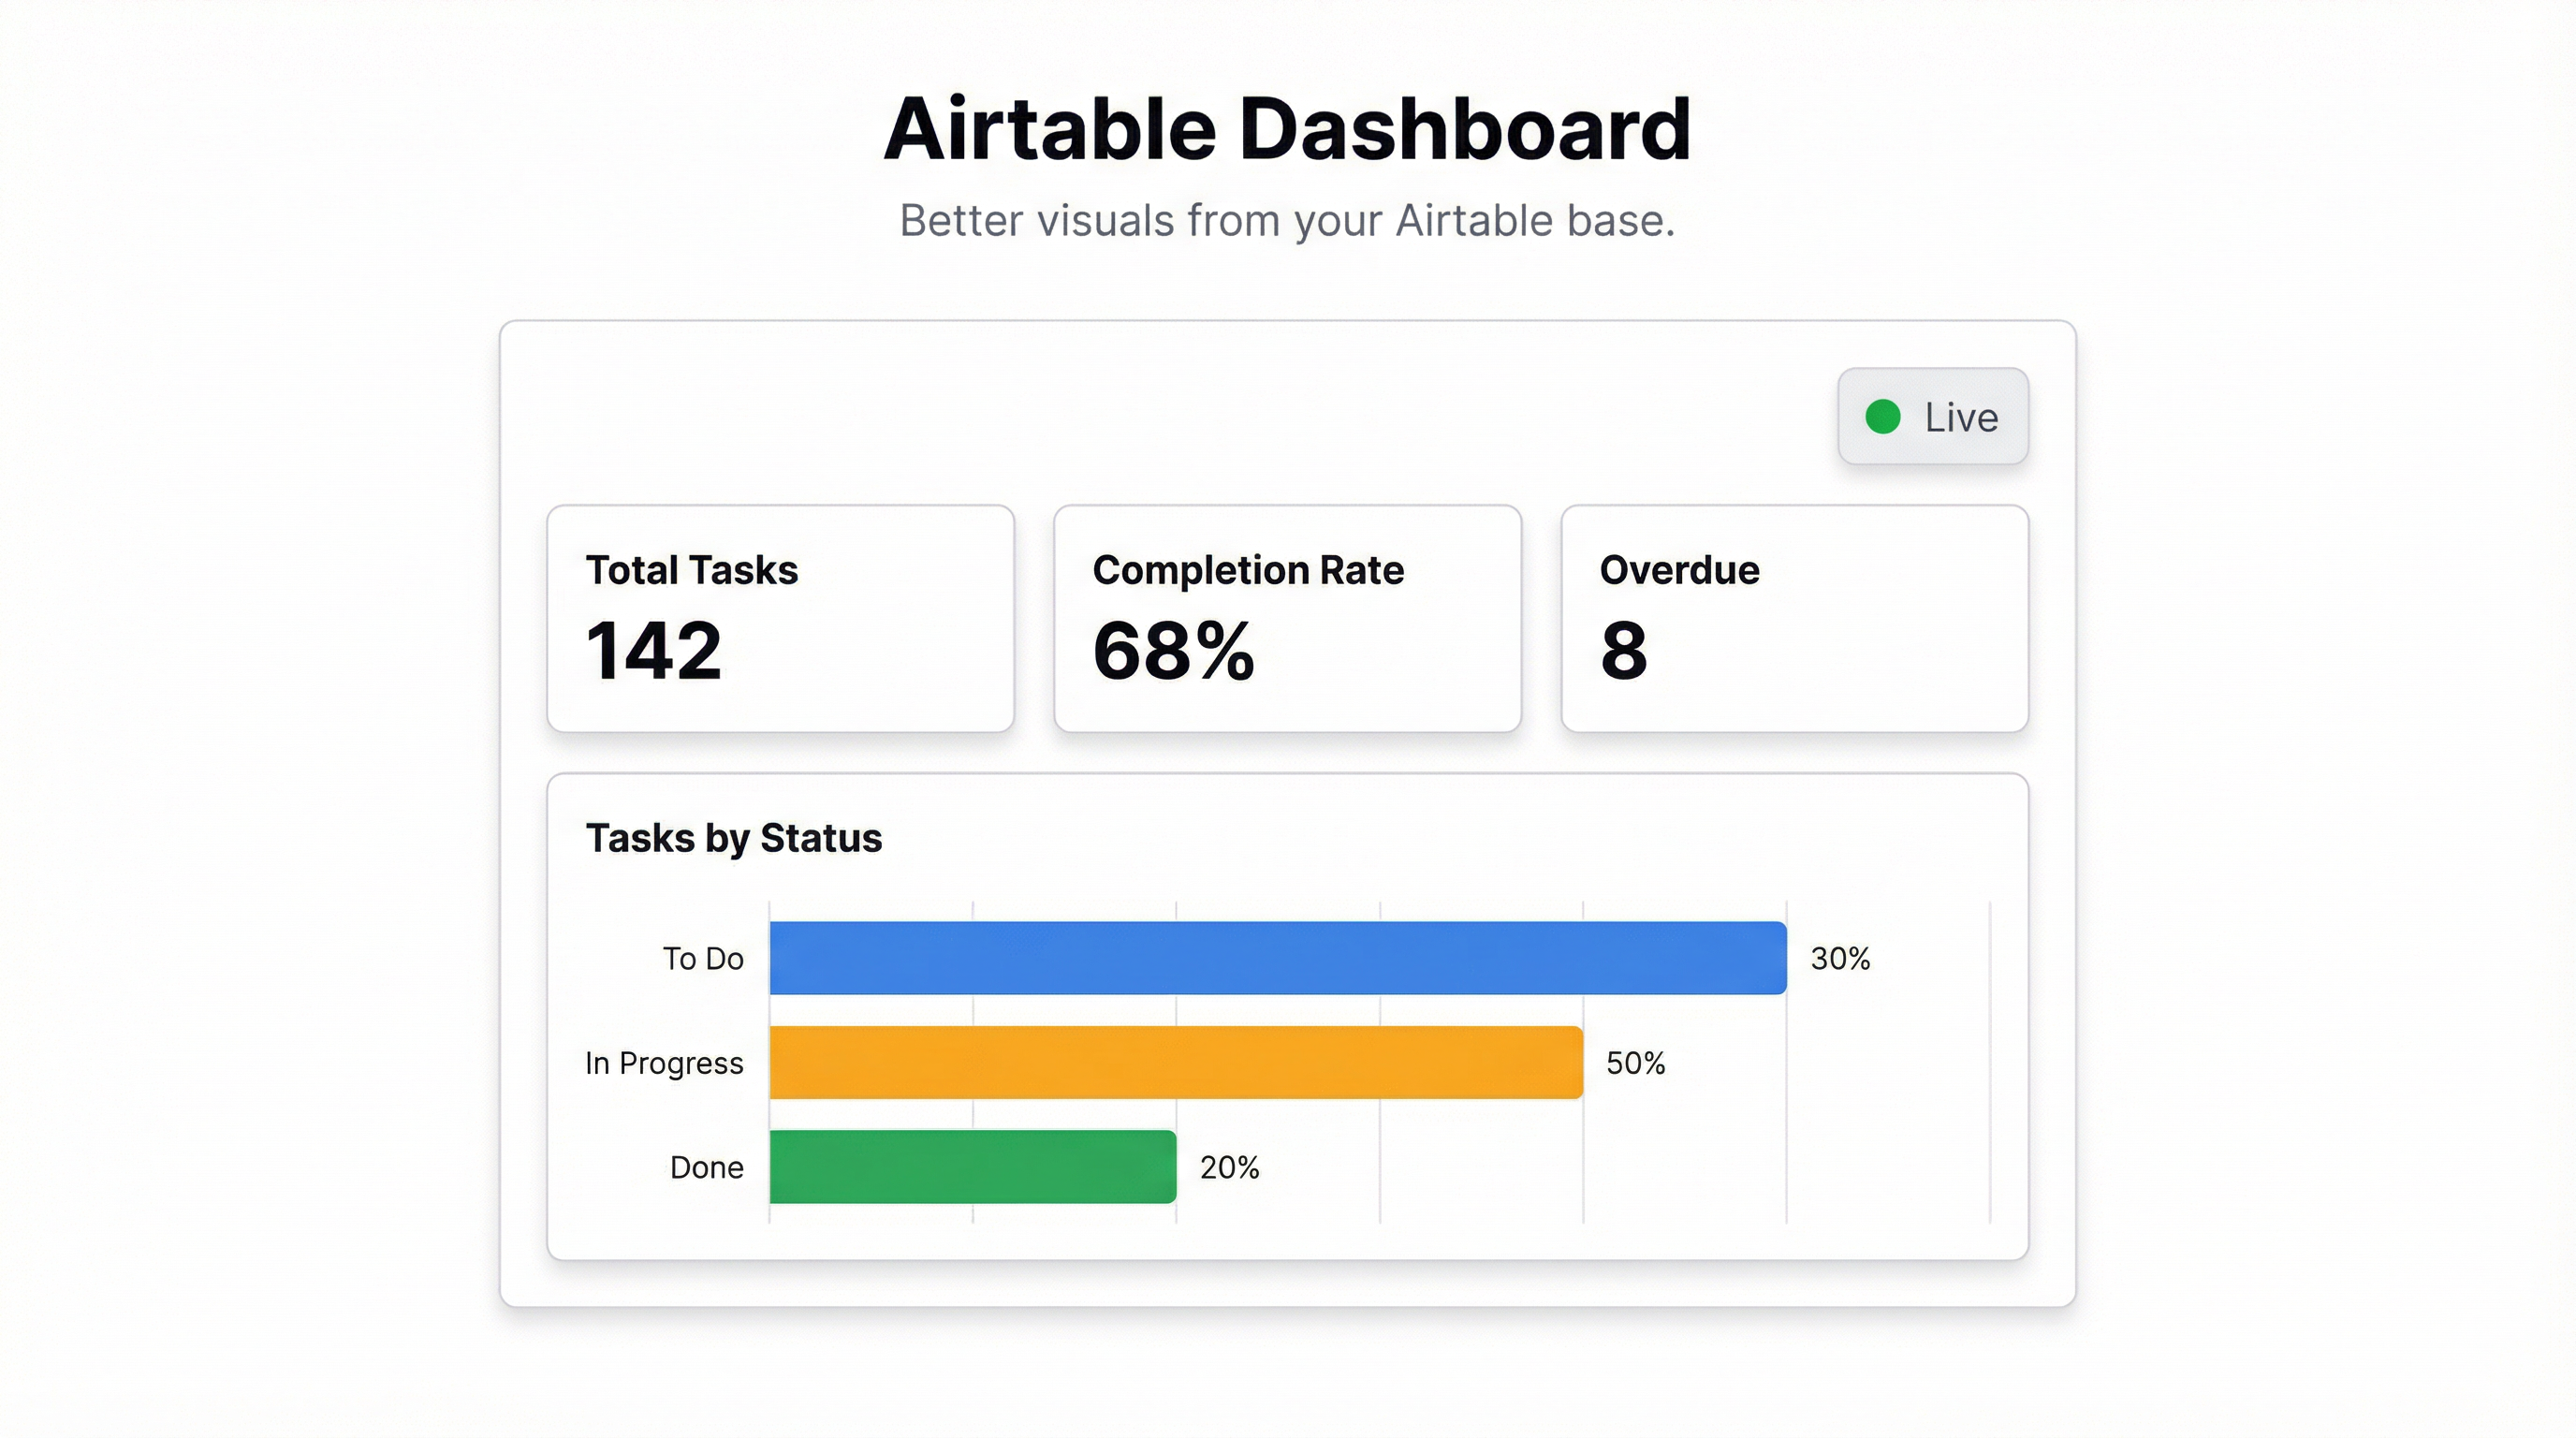
Airtable Dashboard: Build Better Visuals from Your Base
Guide
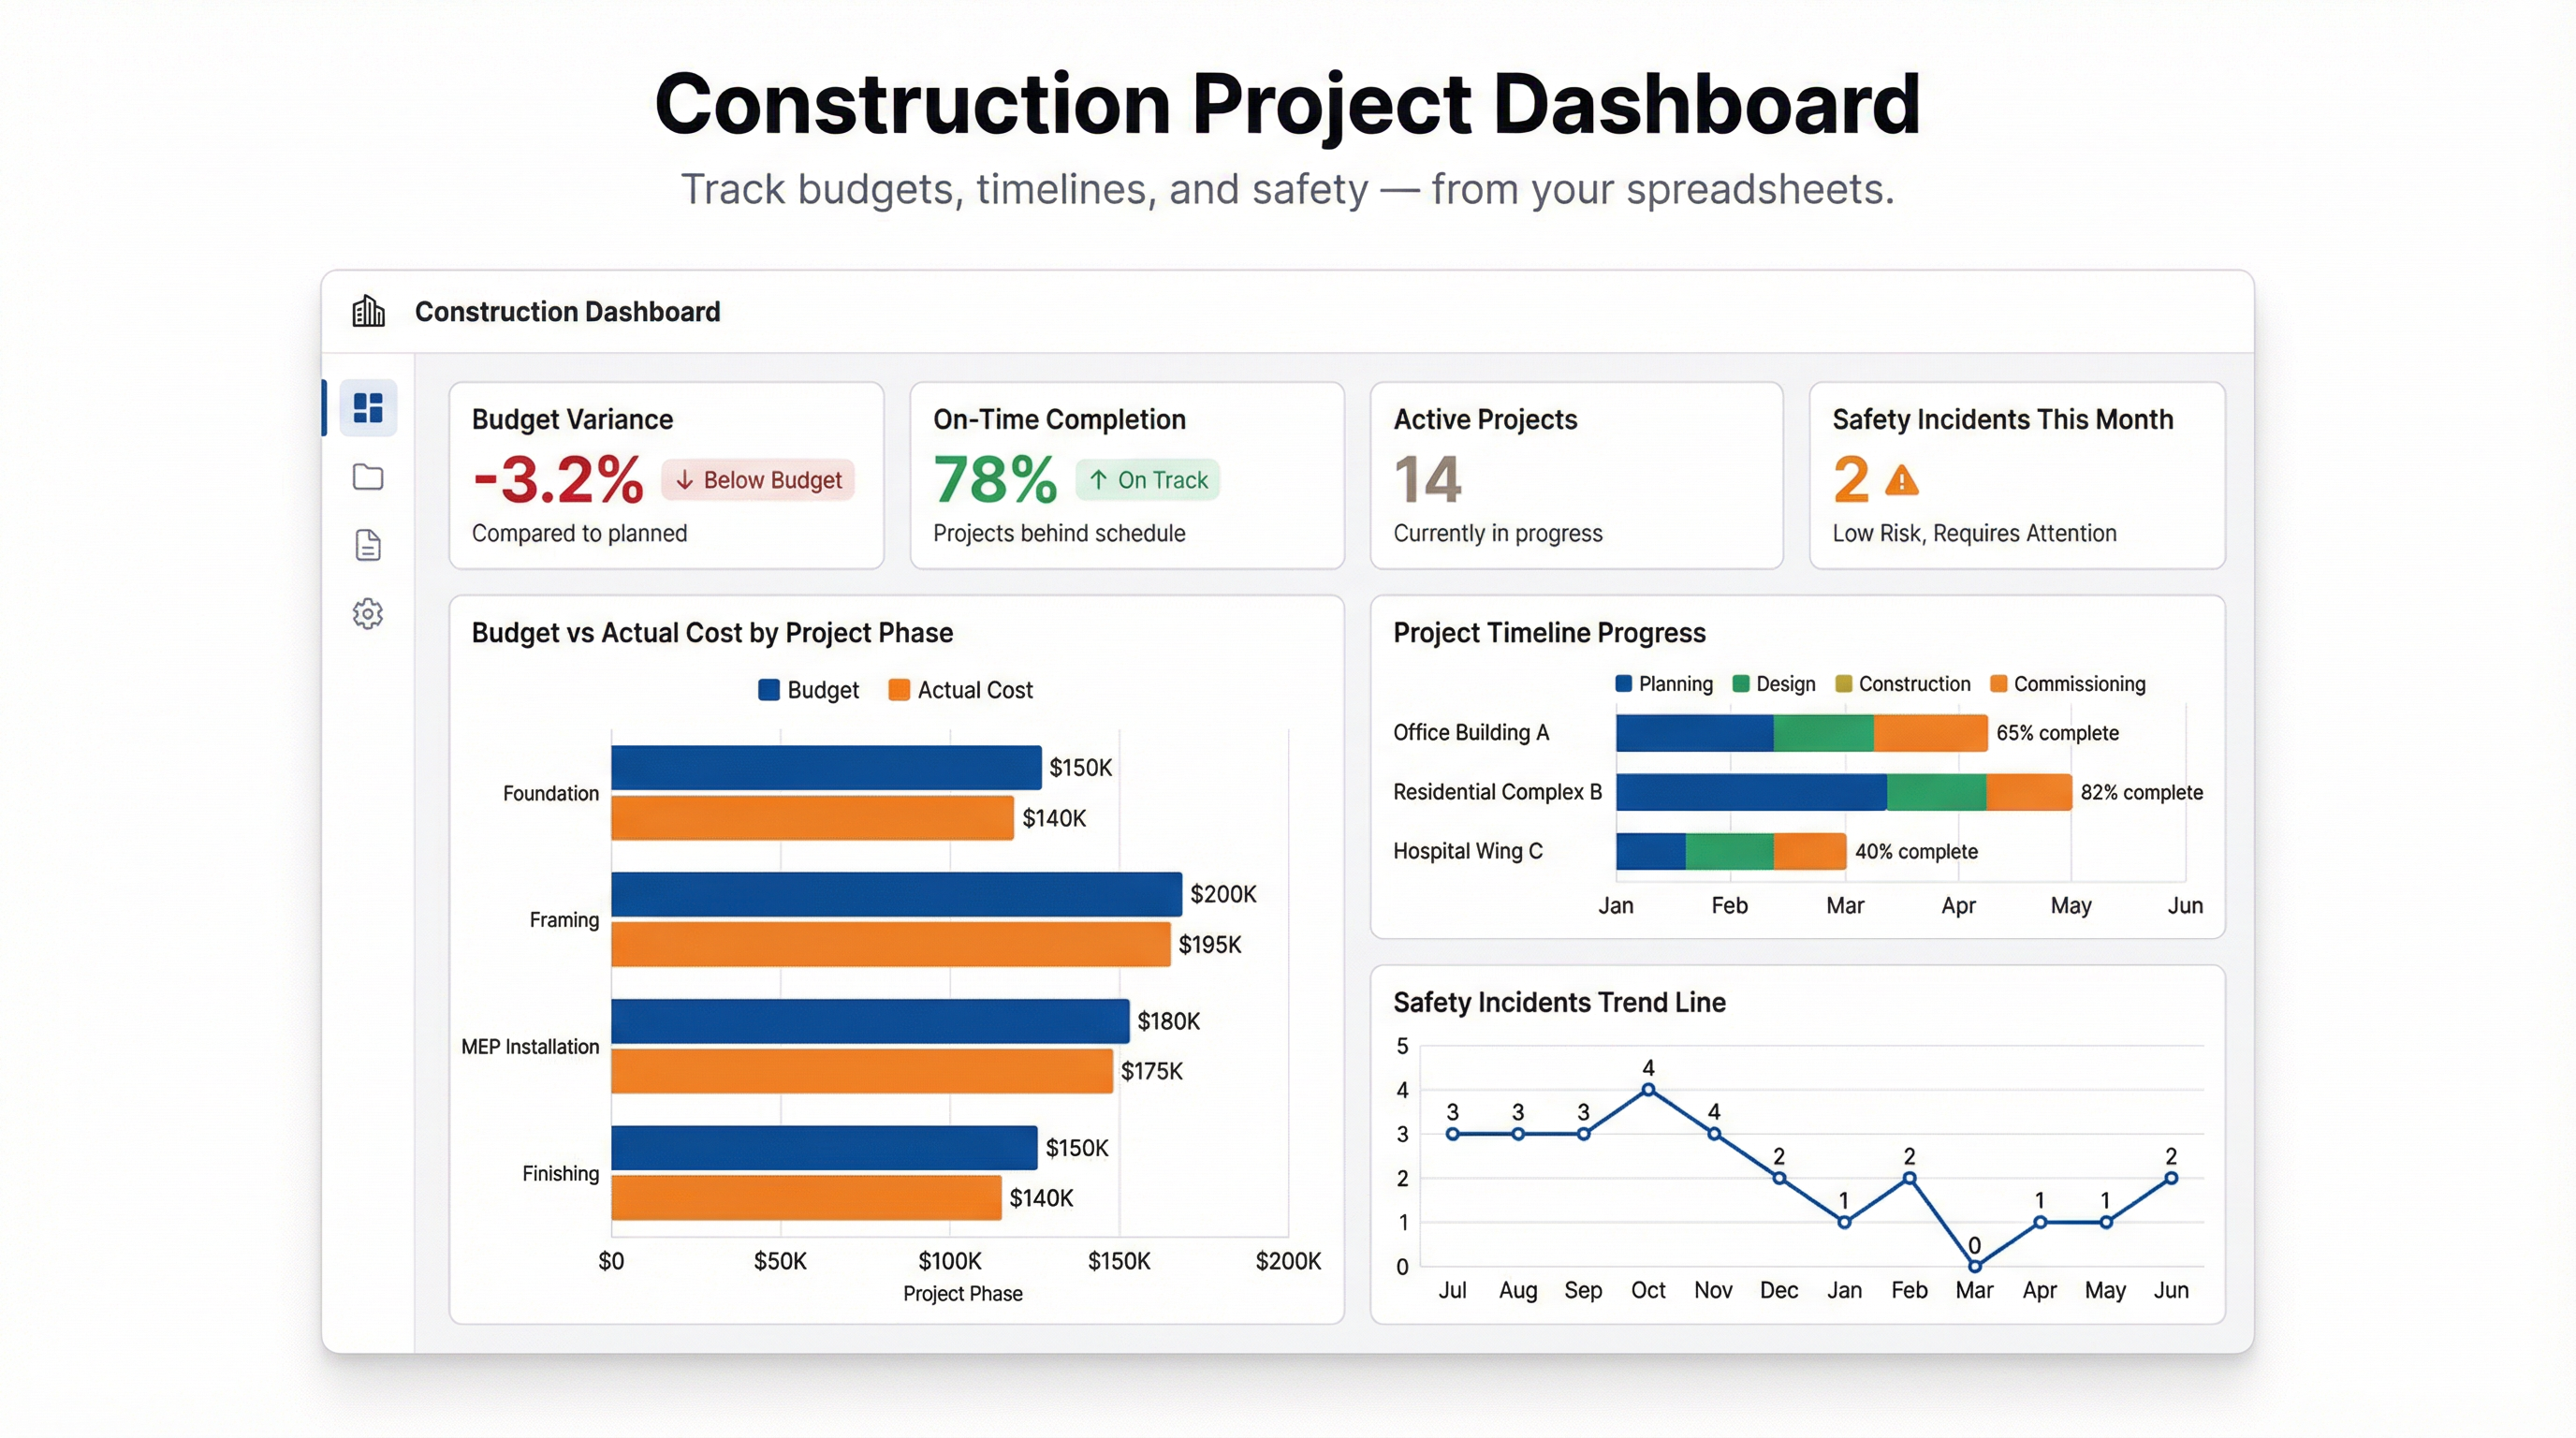
Construction Dashboard: Track Project Costs, Timelines, and Safety KPIs in One Place
Guide
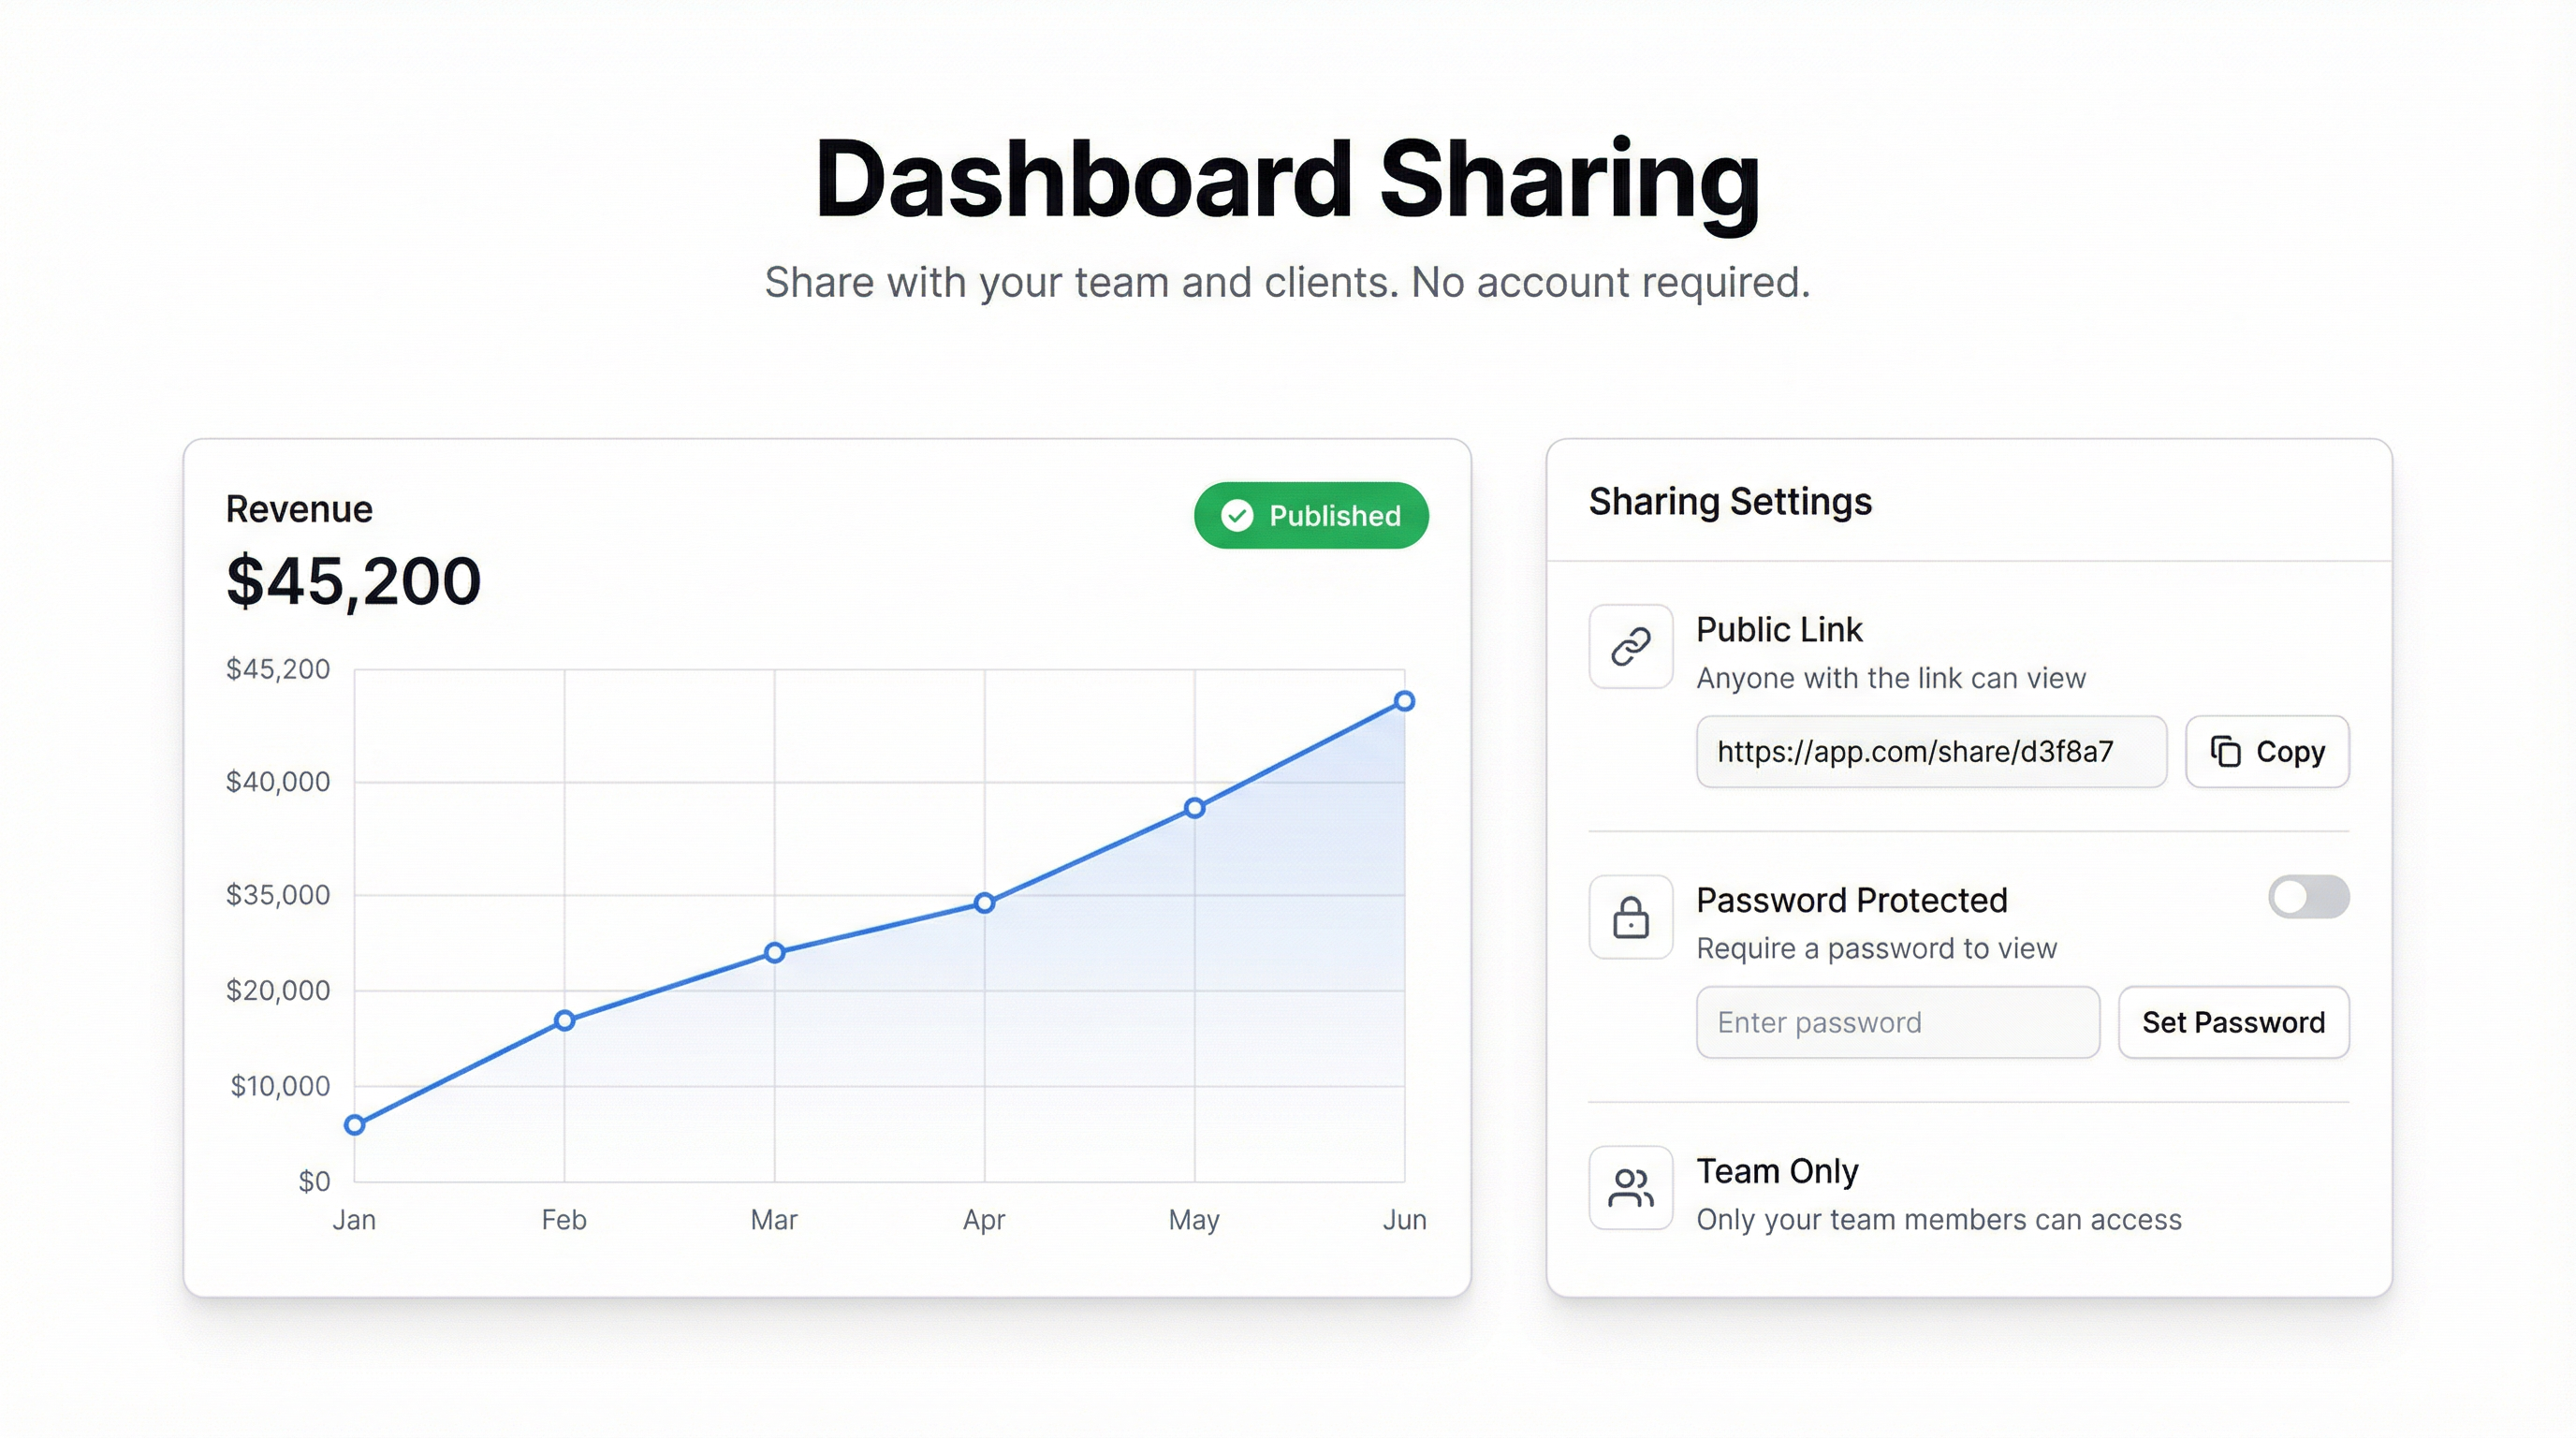
Dashboard Sharing: How to Share Dashboards with Your Team and Clients
Feature
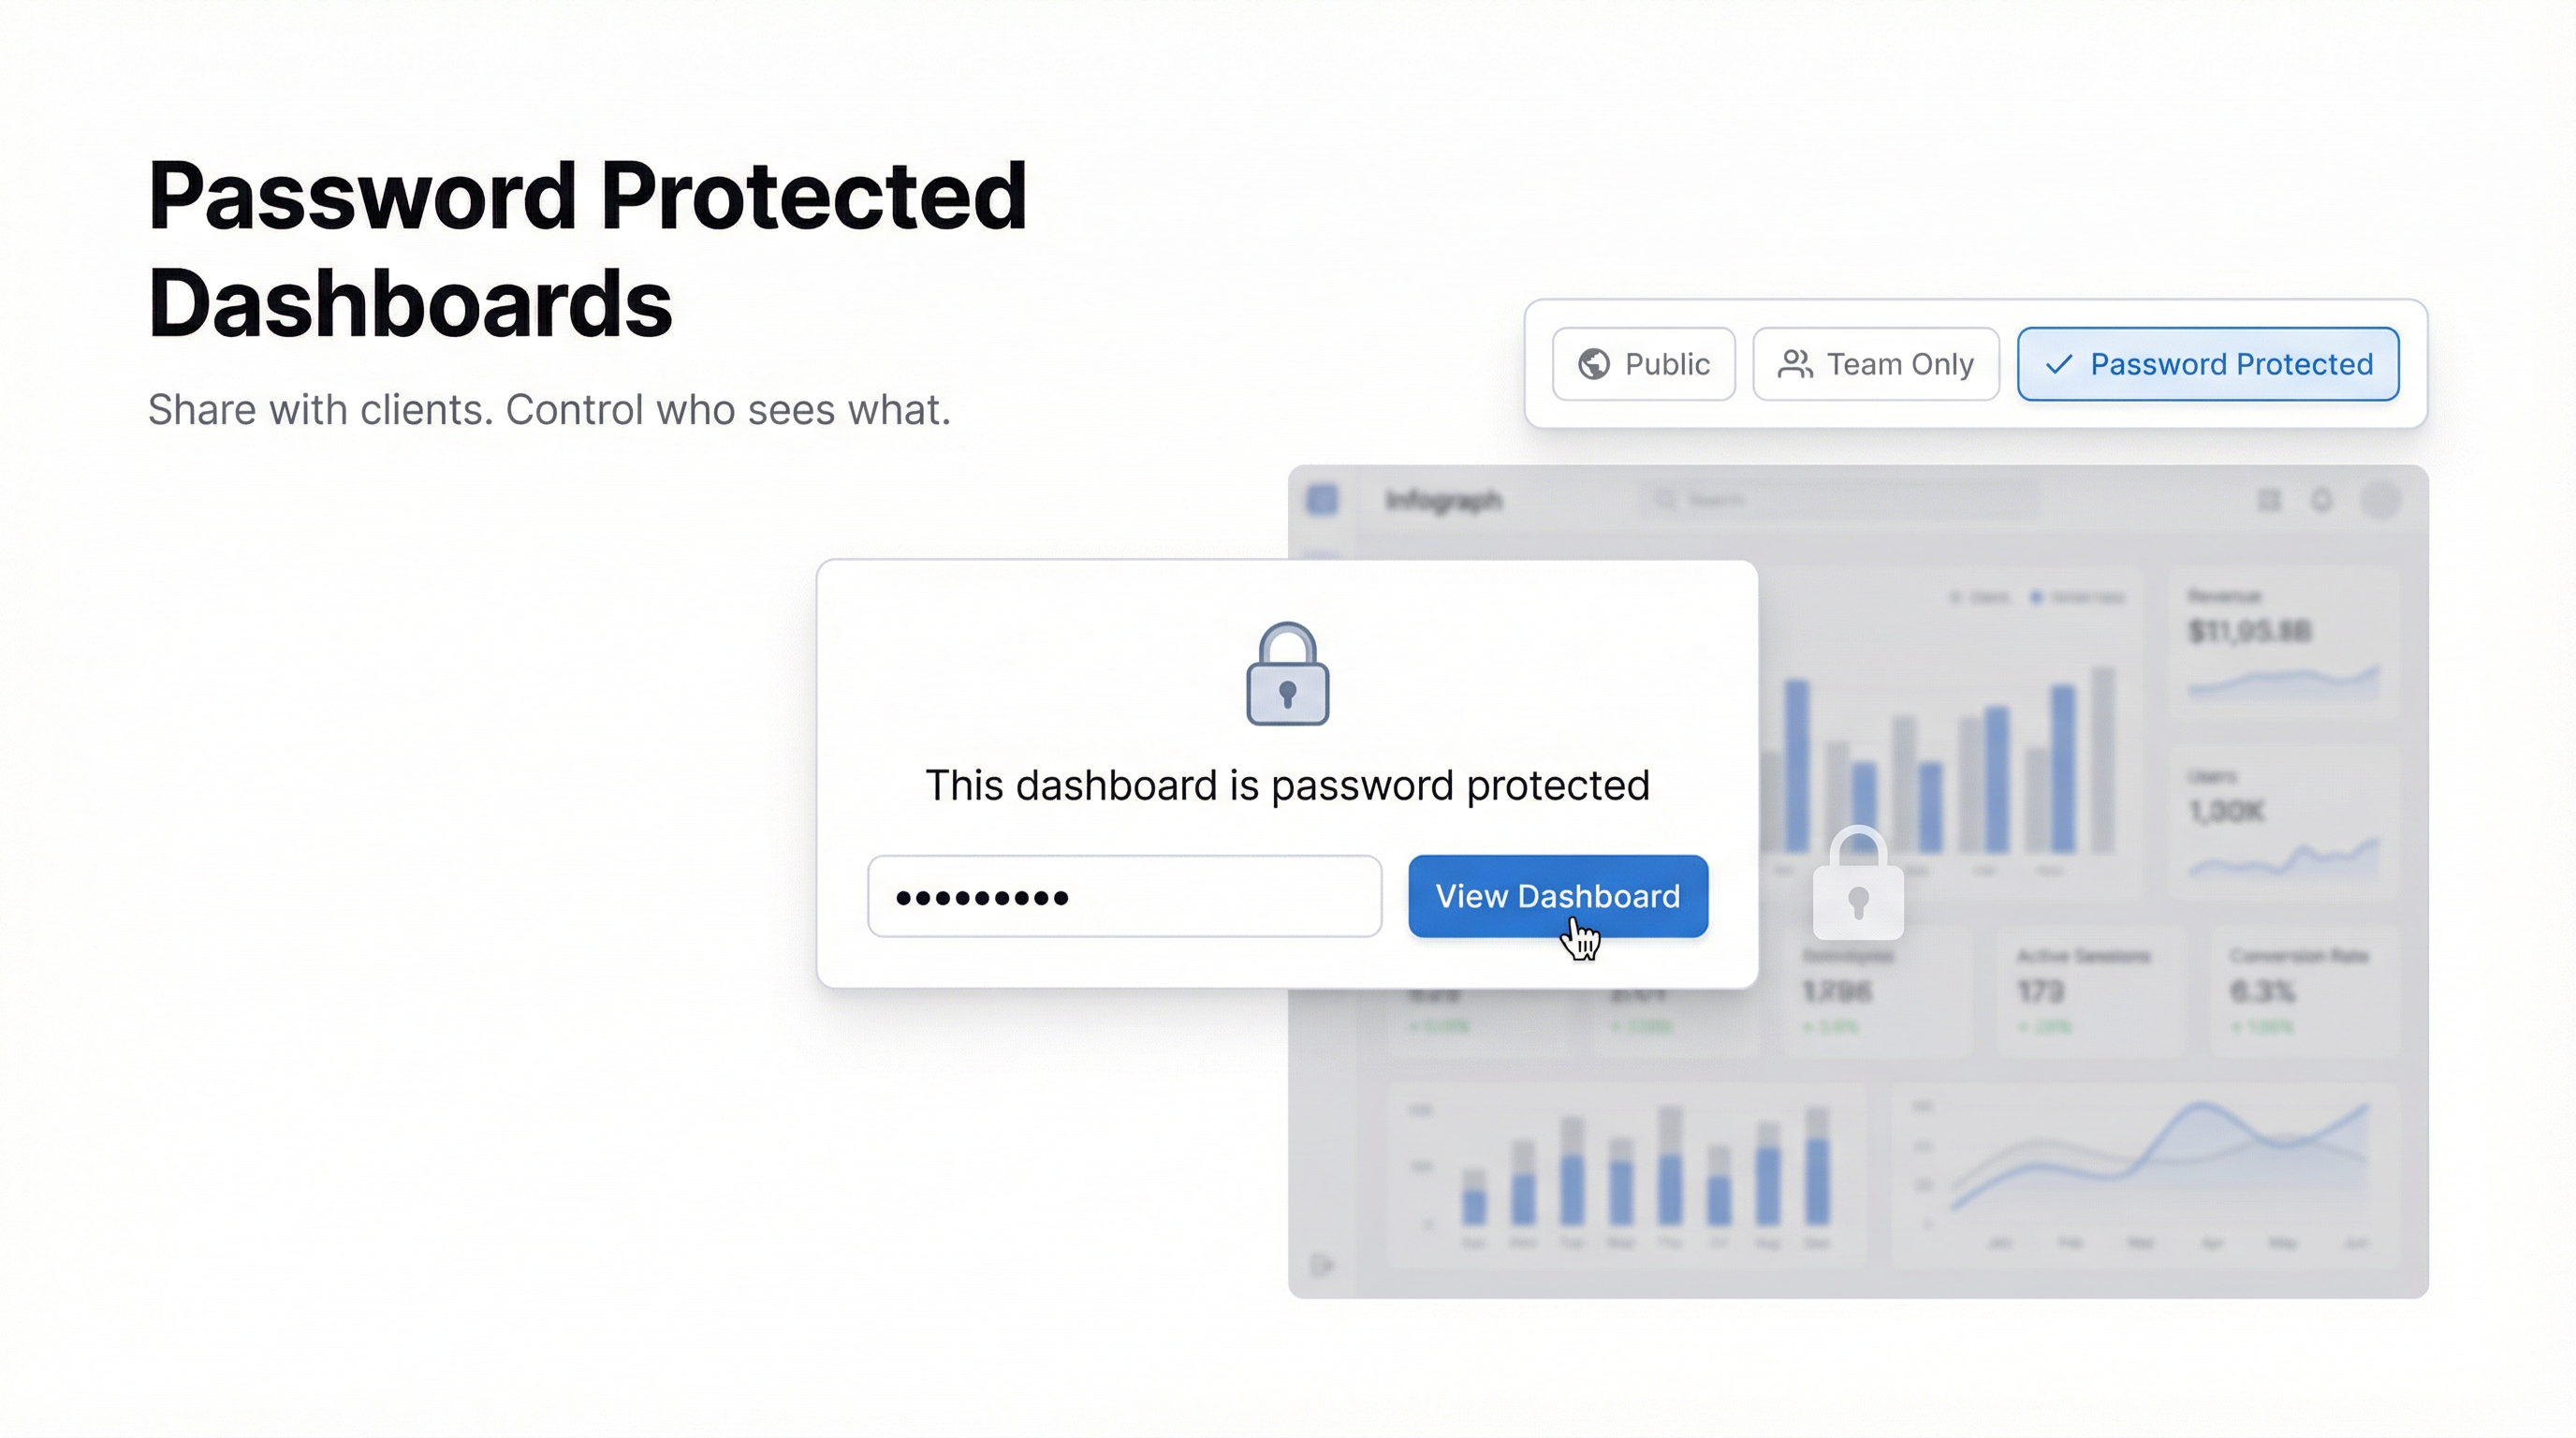
Password Protected Dashboard: Secure Sharing with Infograph
Guide
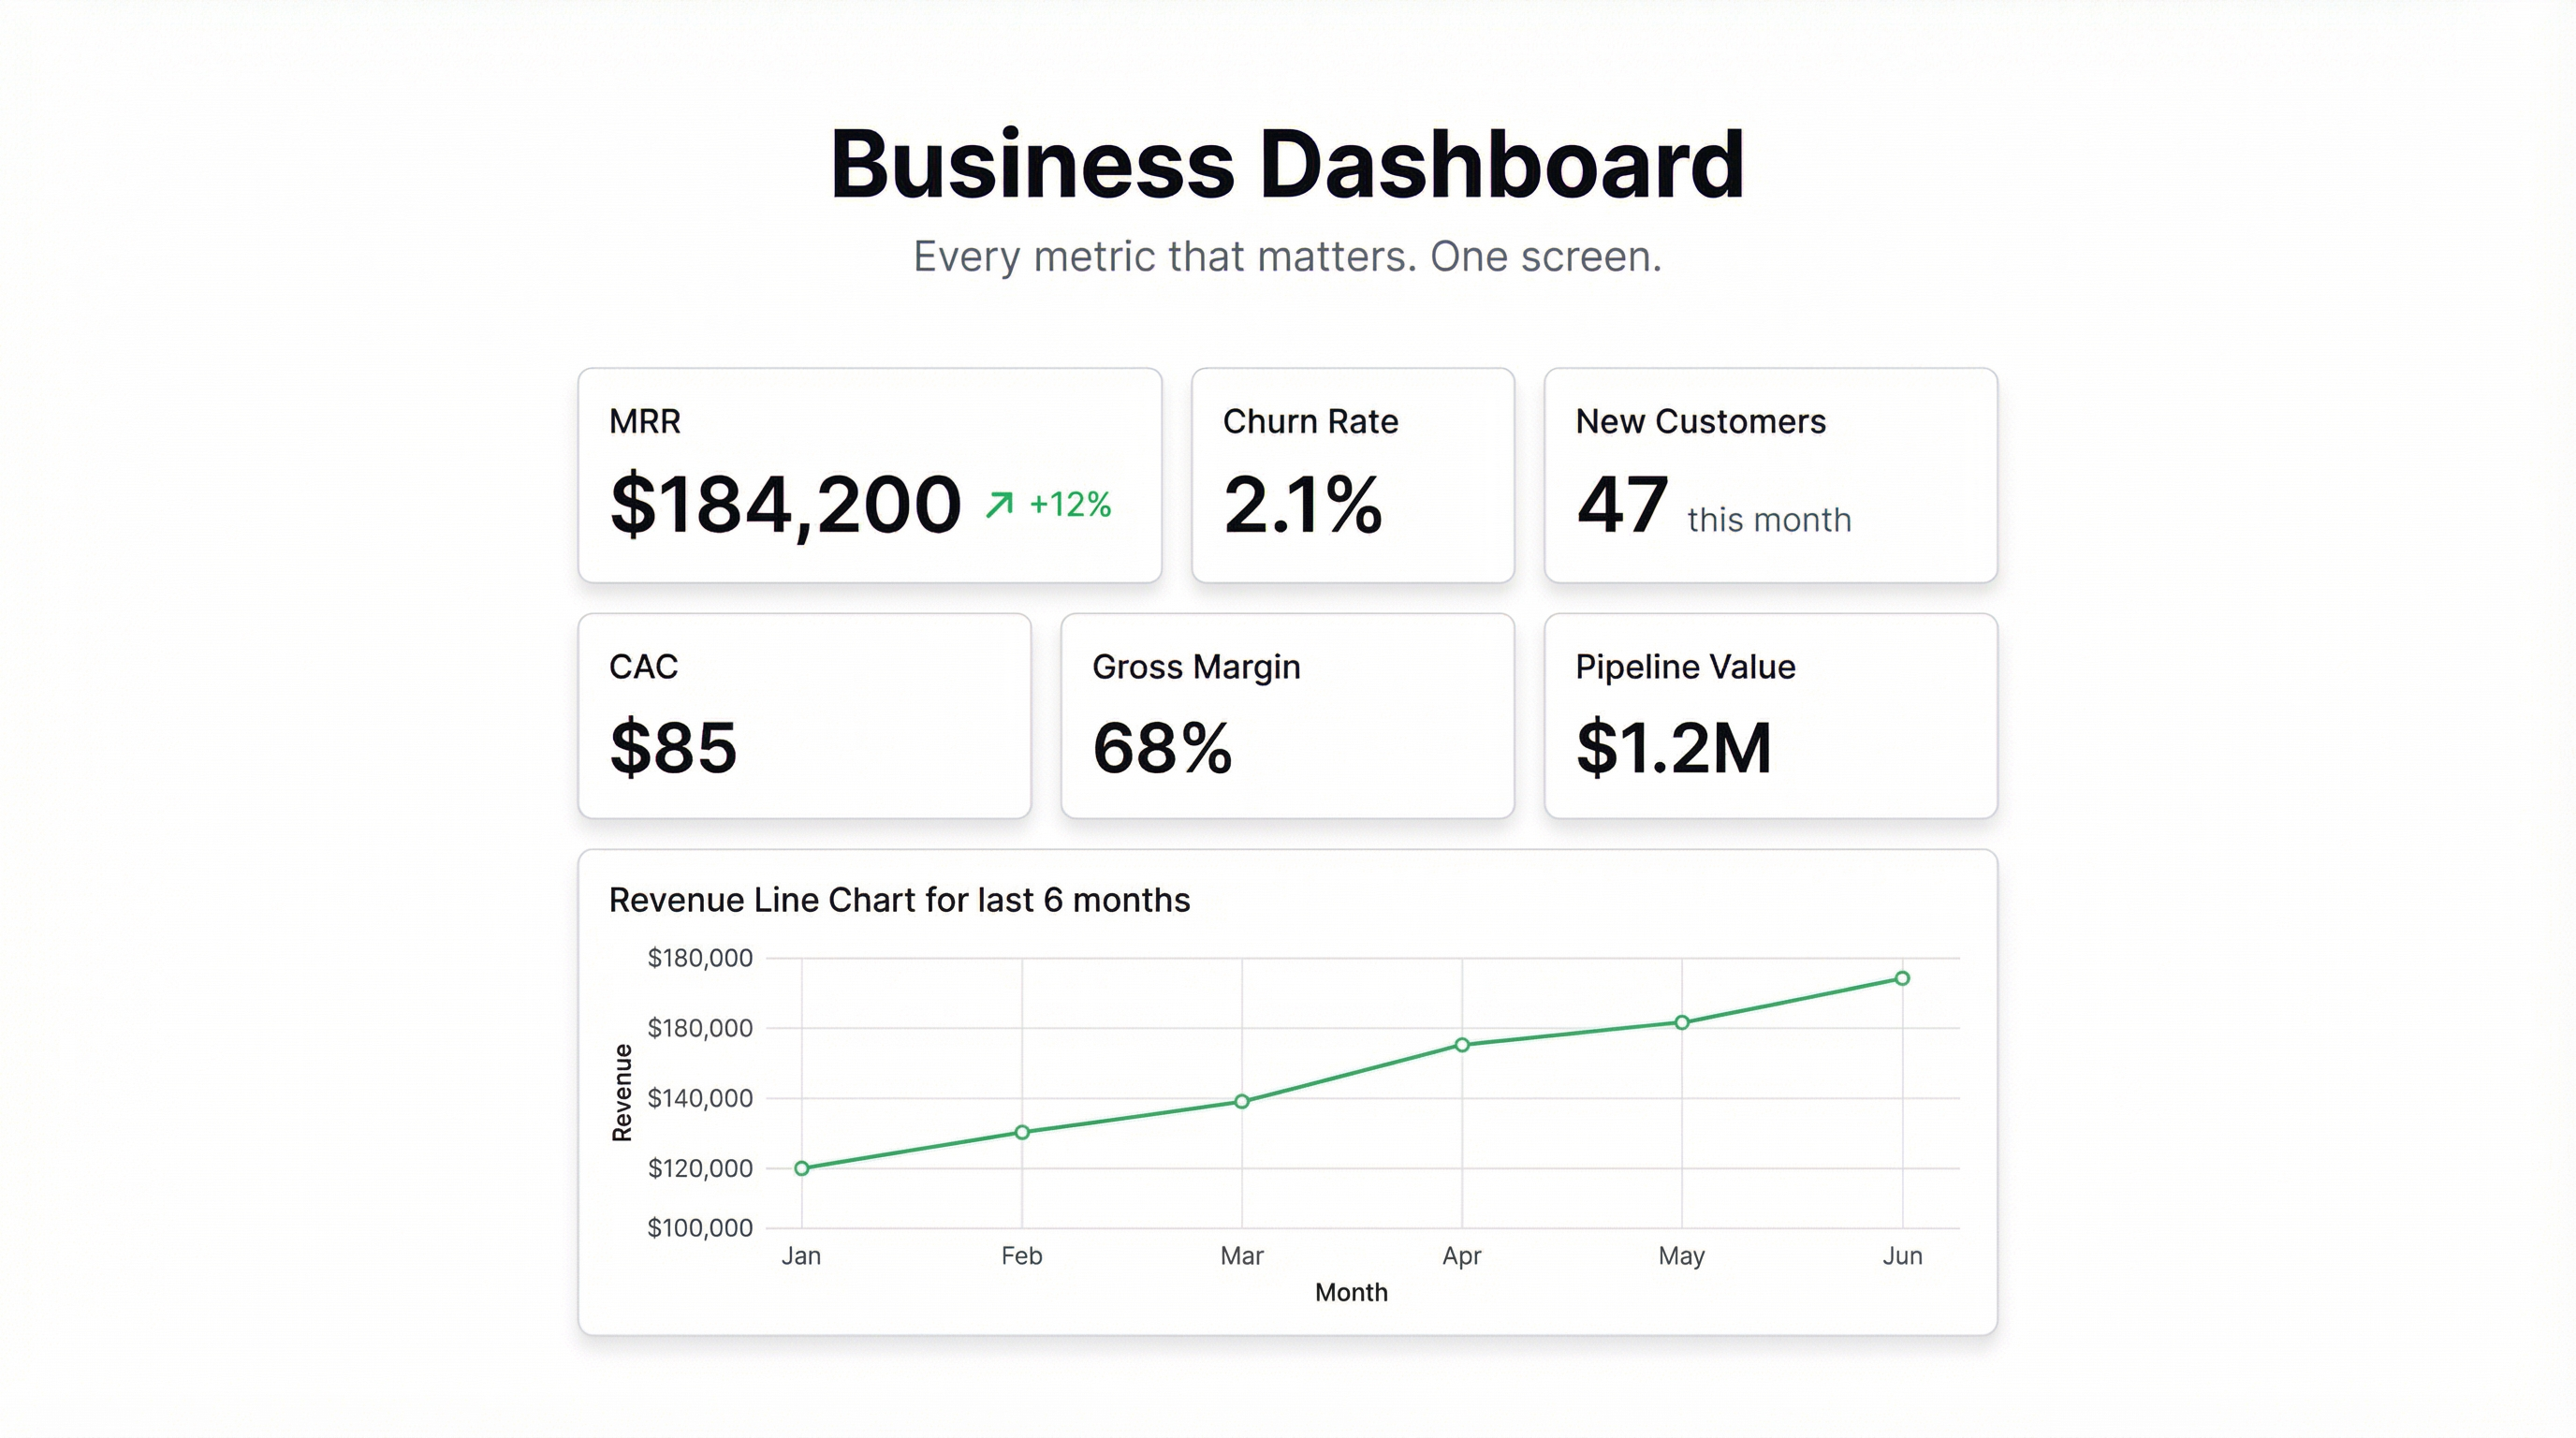
Business Dashboard: One Screen That Runs Your Entire Business
Guide
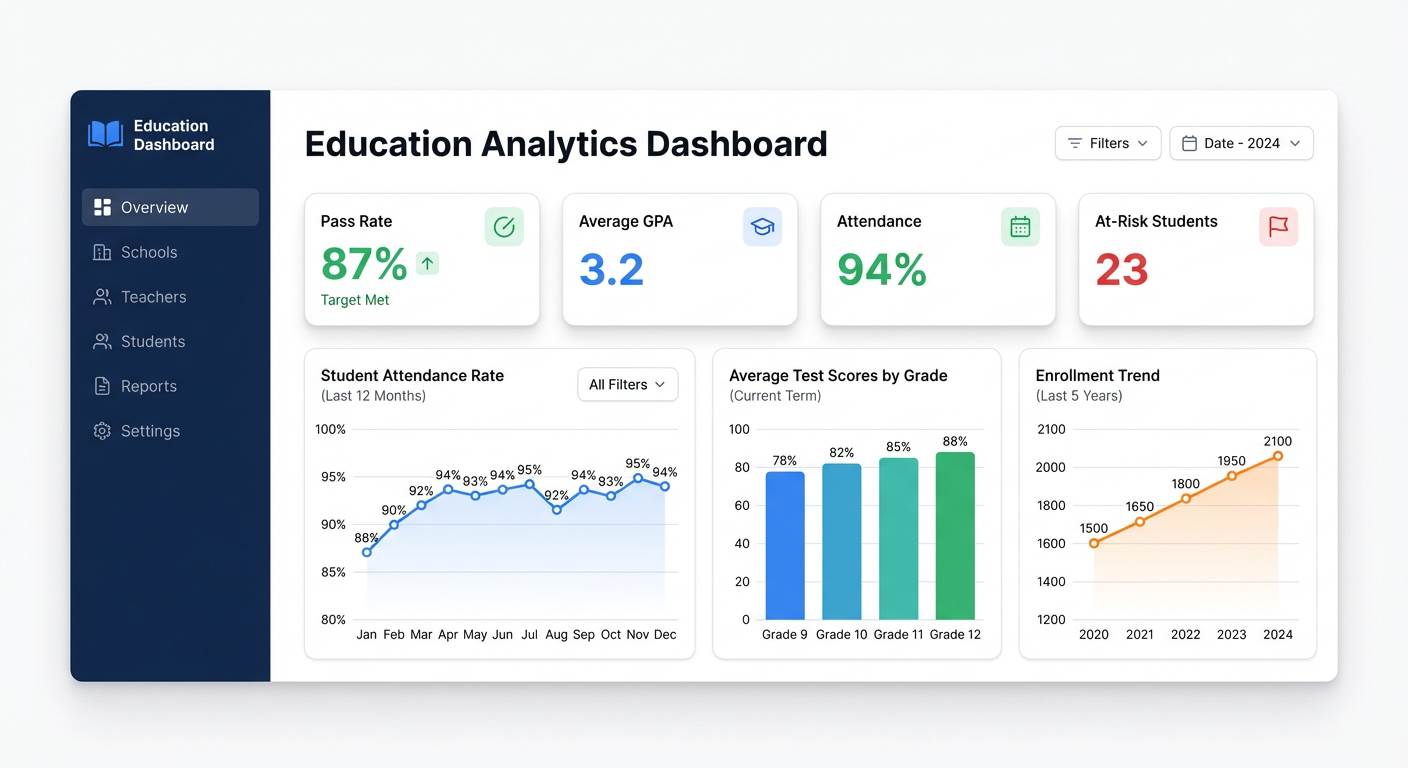
Education Dashboard: Track Student Performance and School KPIs Without a Data Team
Feature
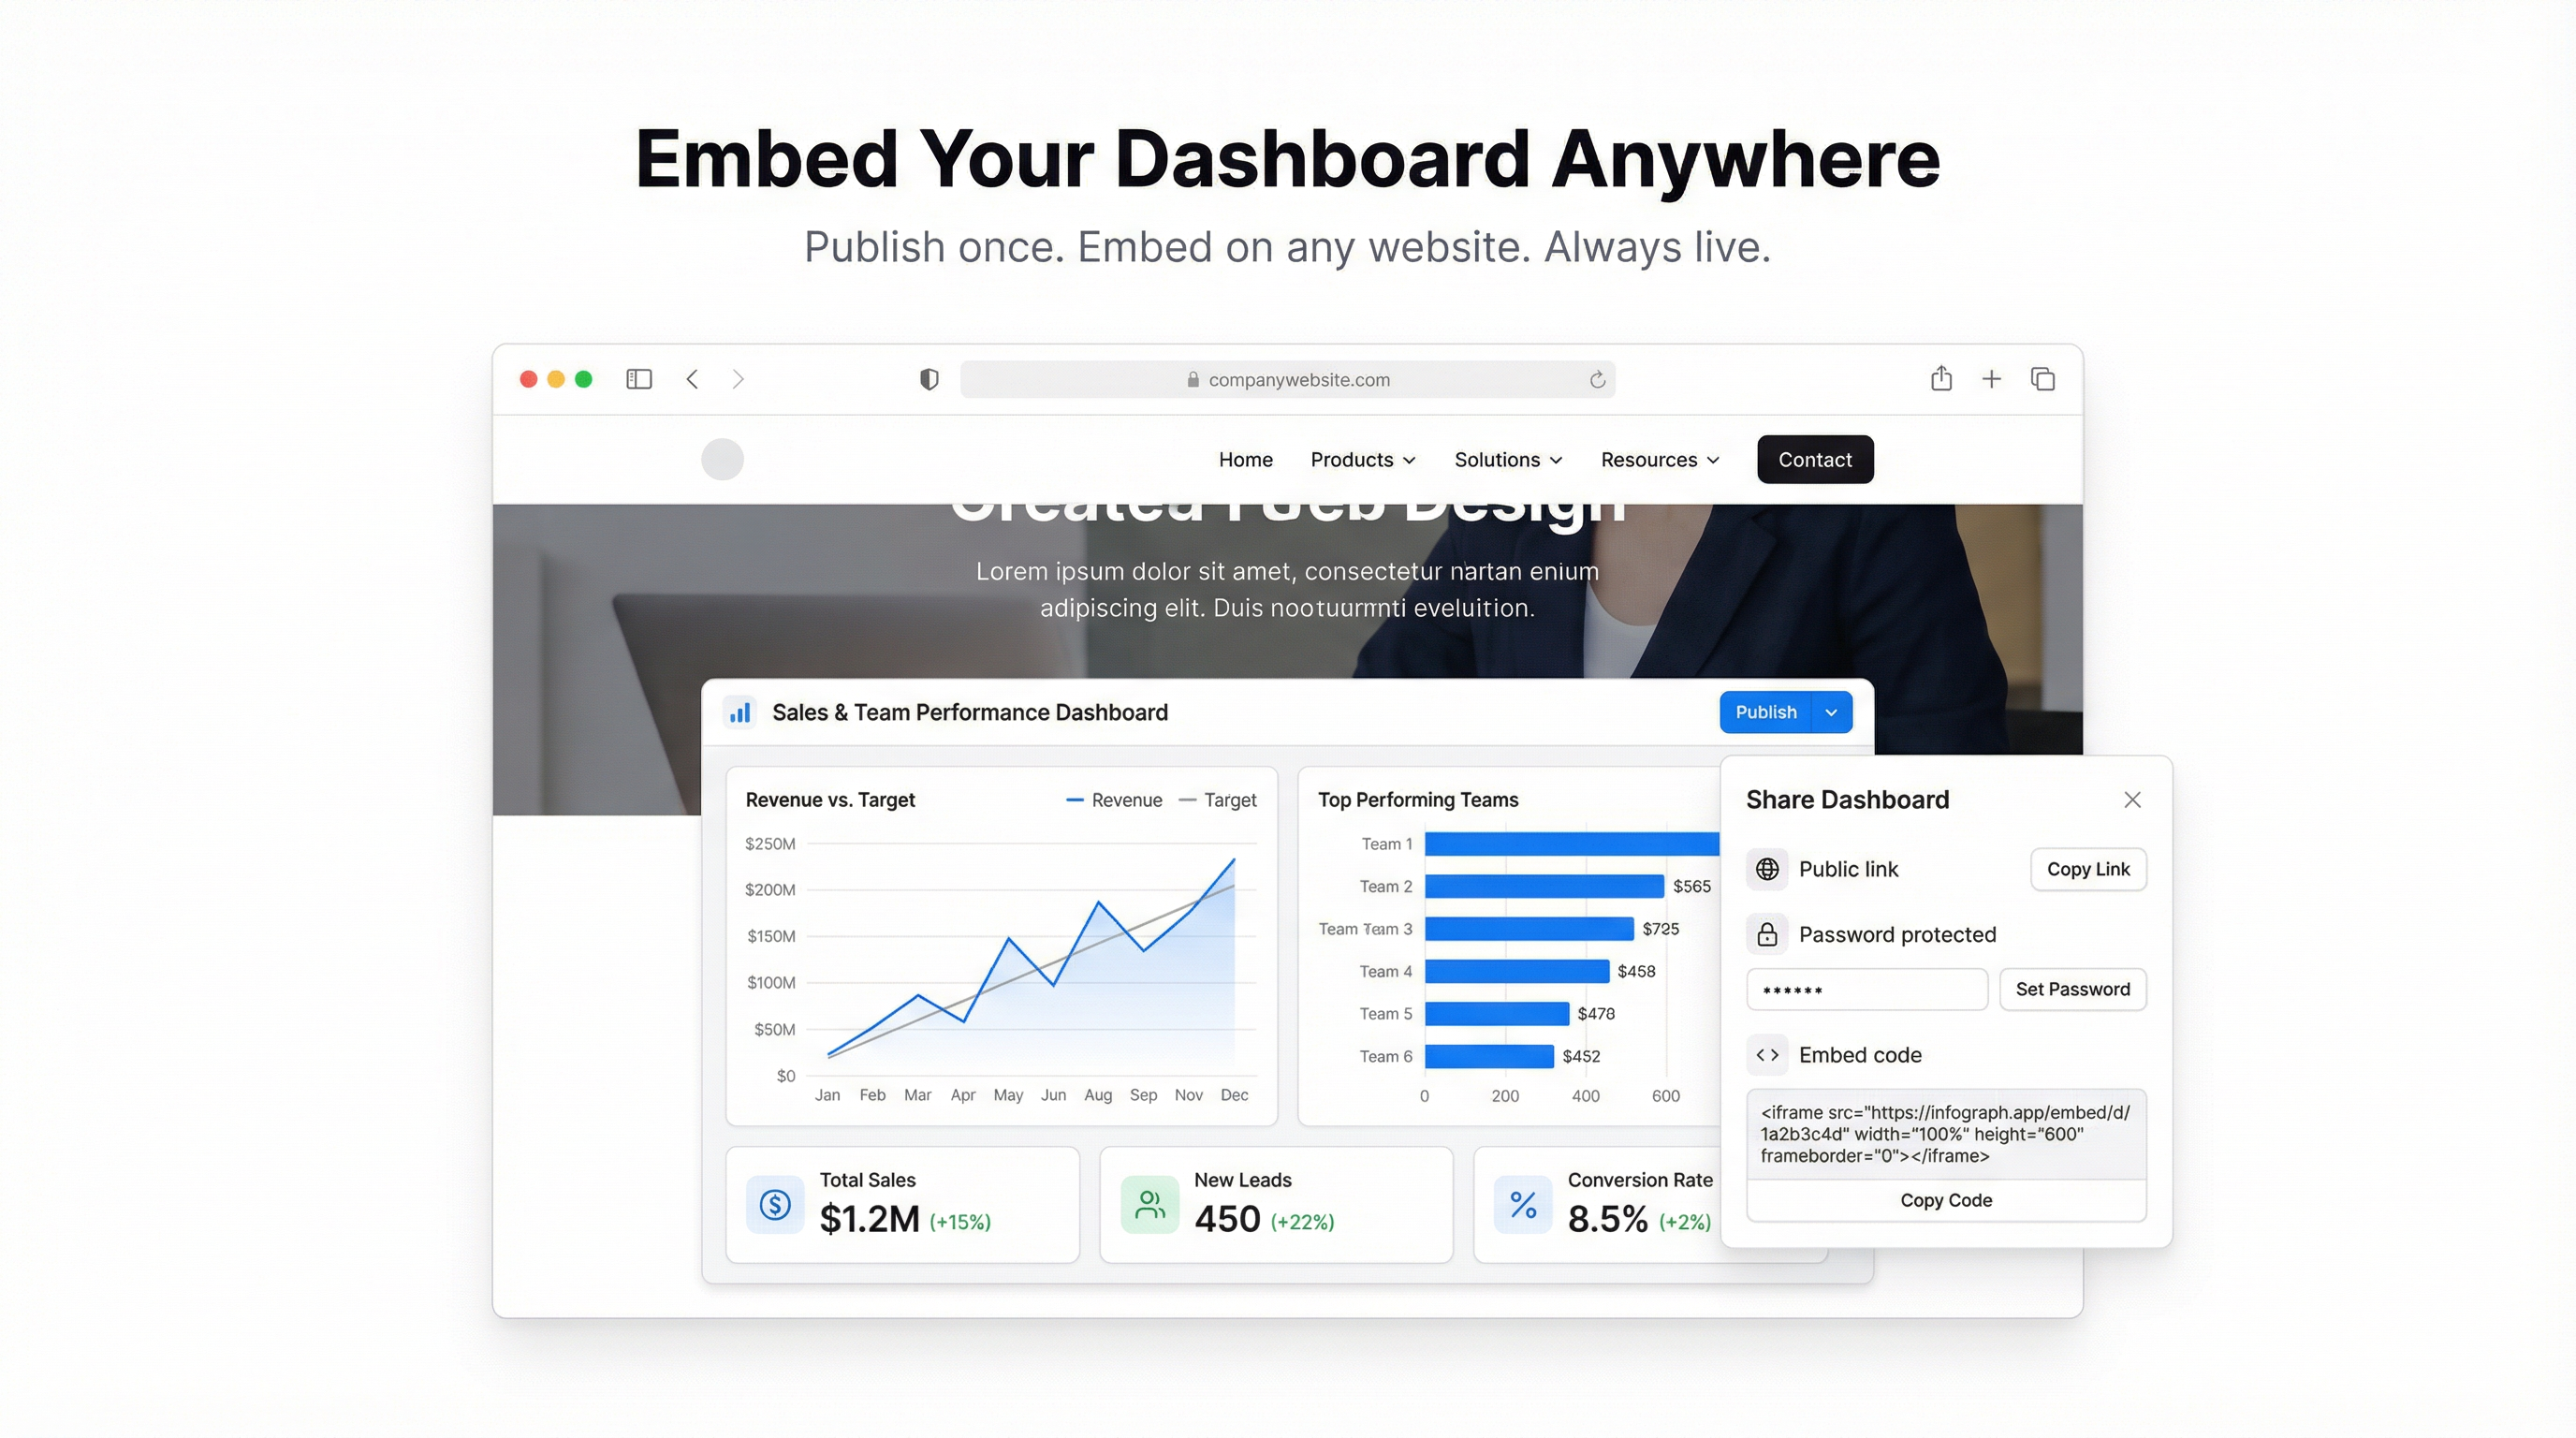
How to Embed a Dashboard on Your Website (Live, Interactive, No Code)
Guide
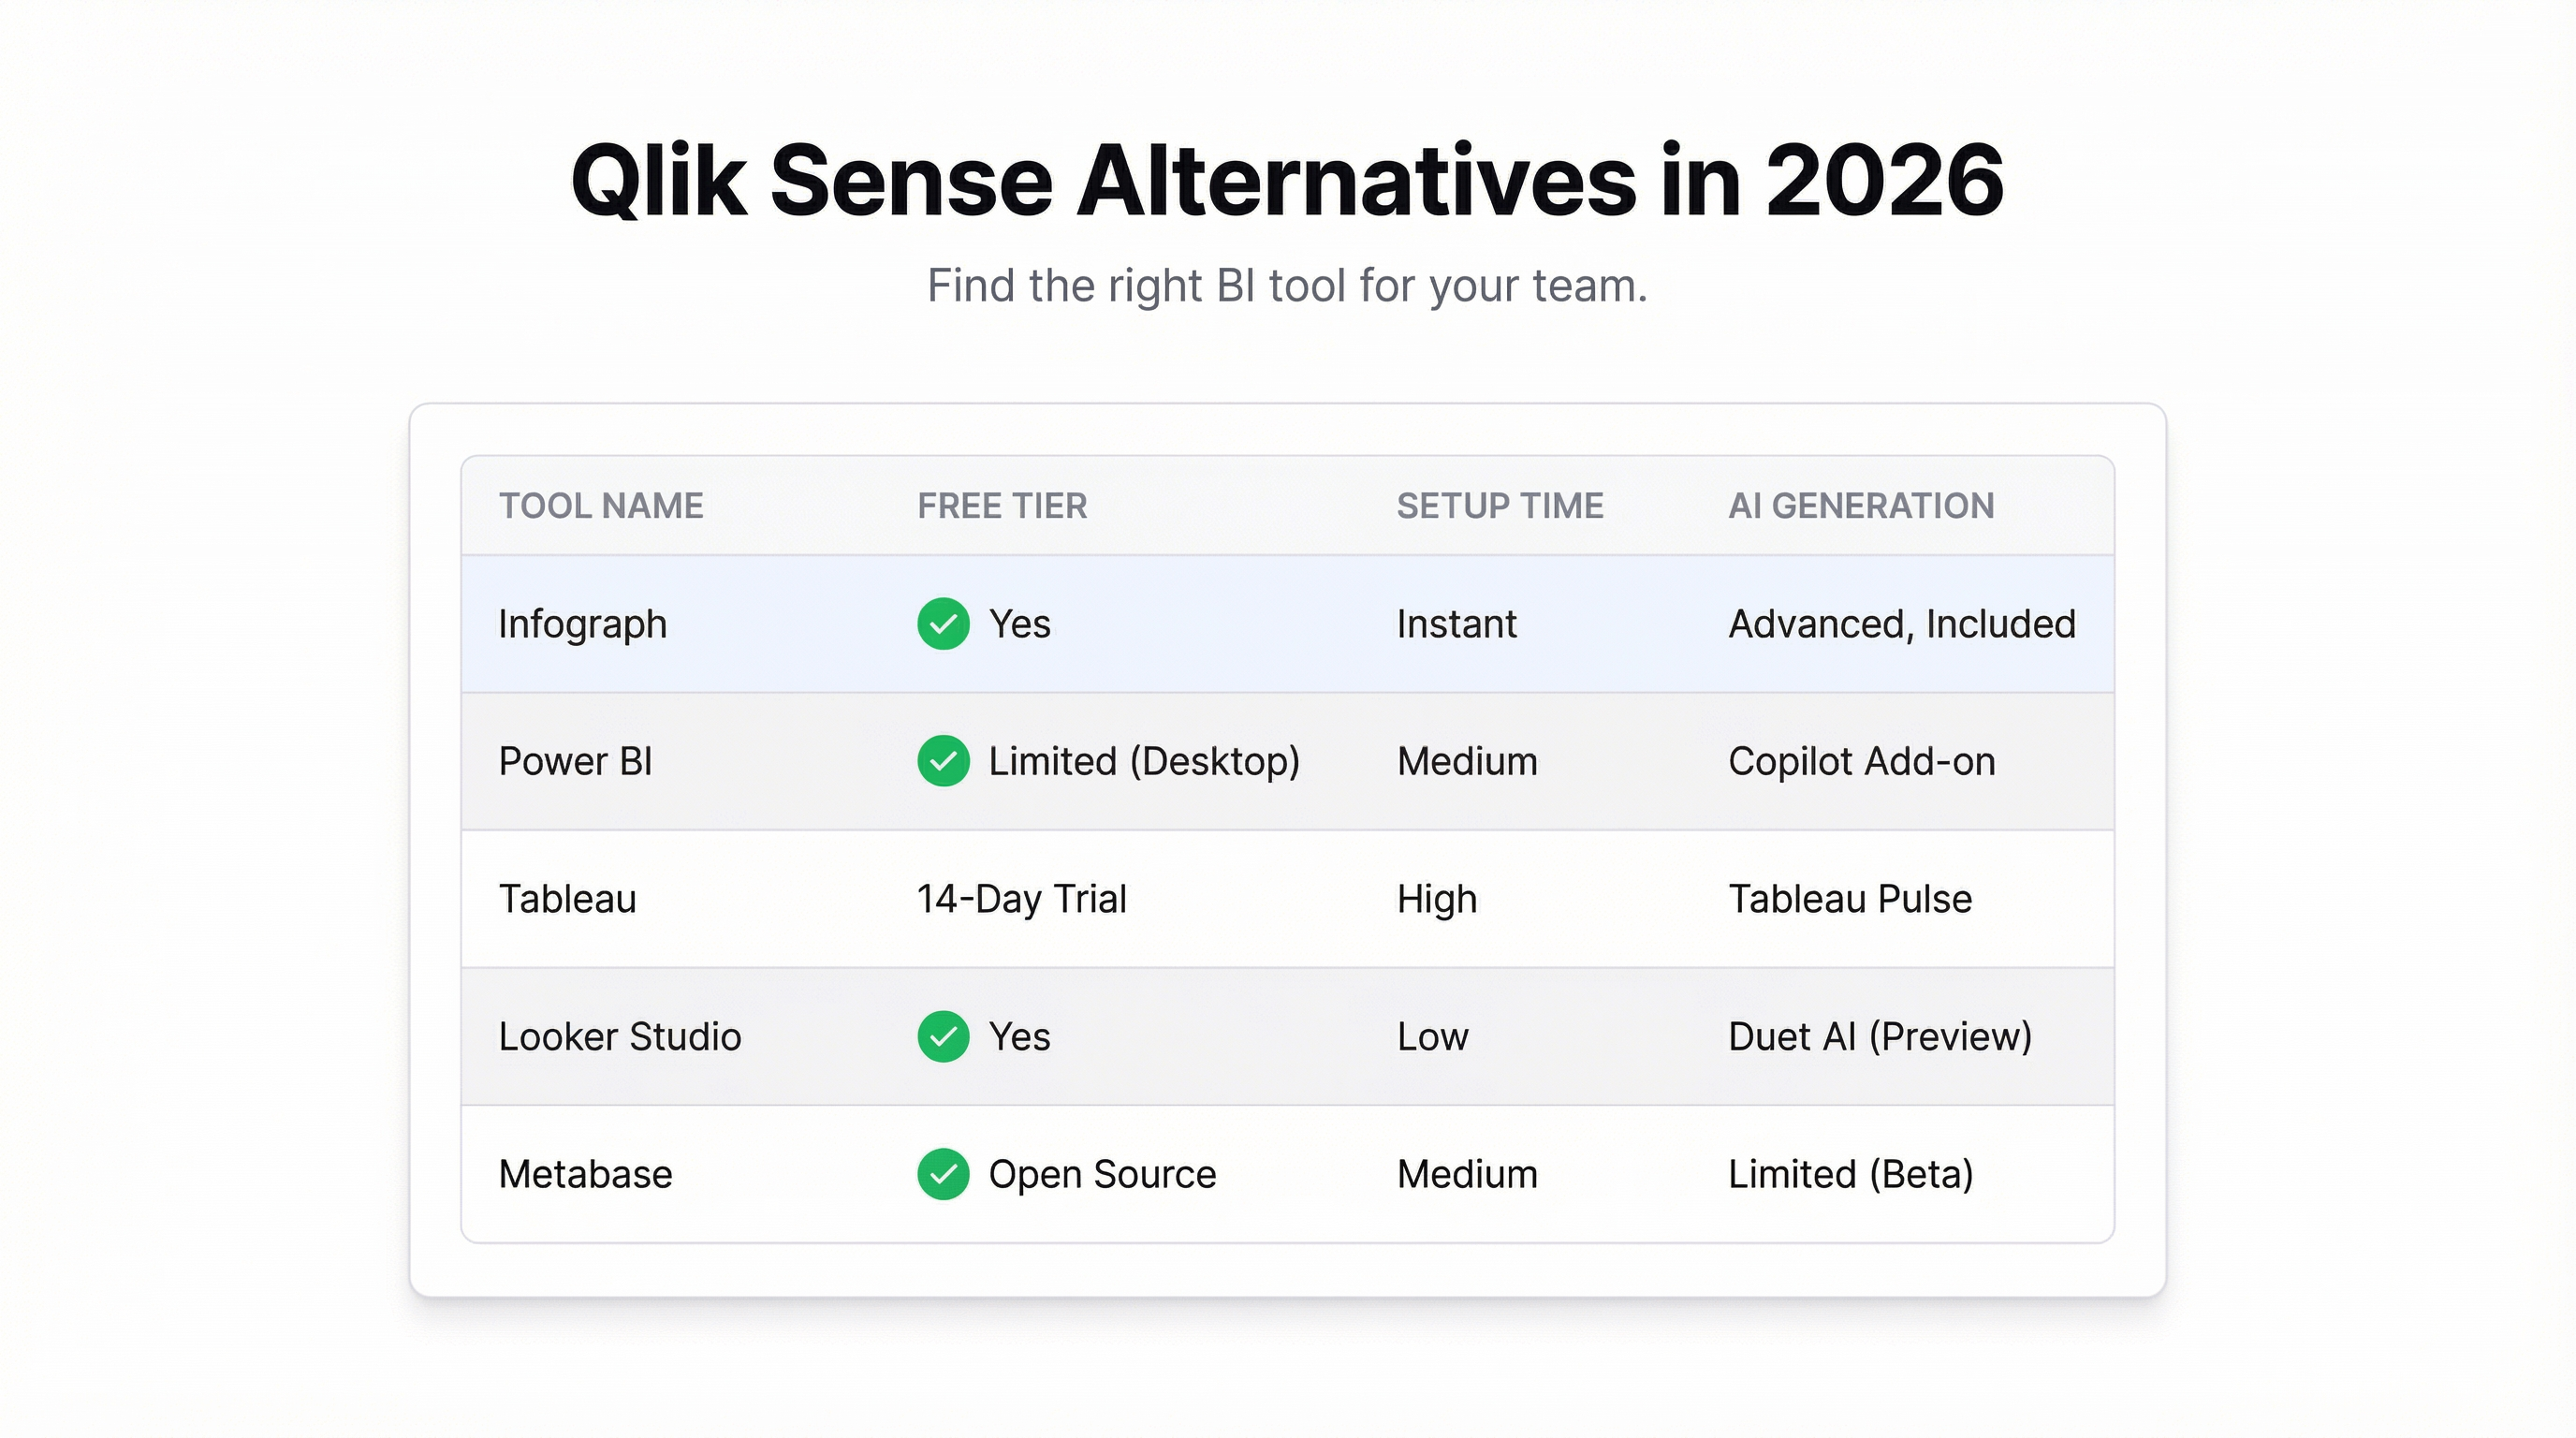
The Best Qlik Sense Alternative in 2026
Guide
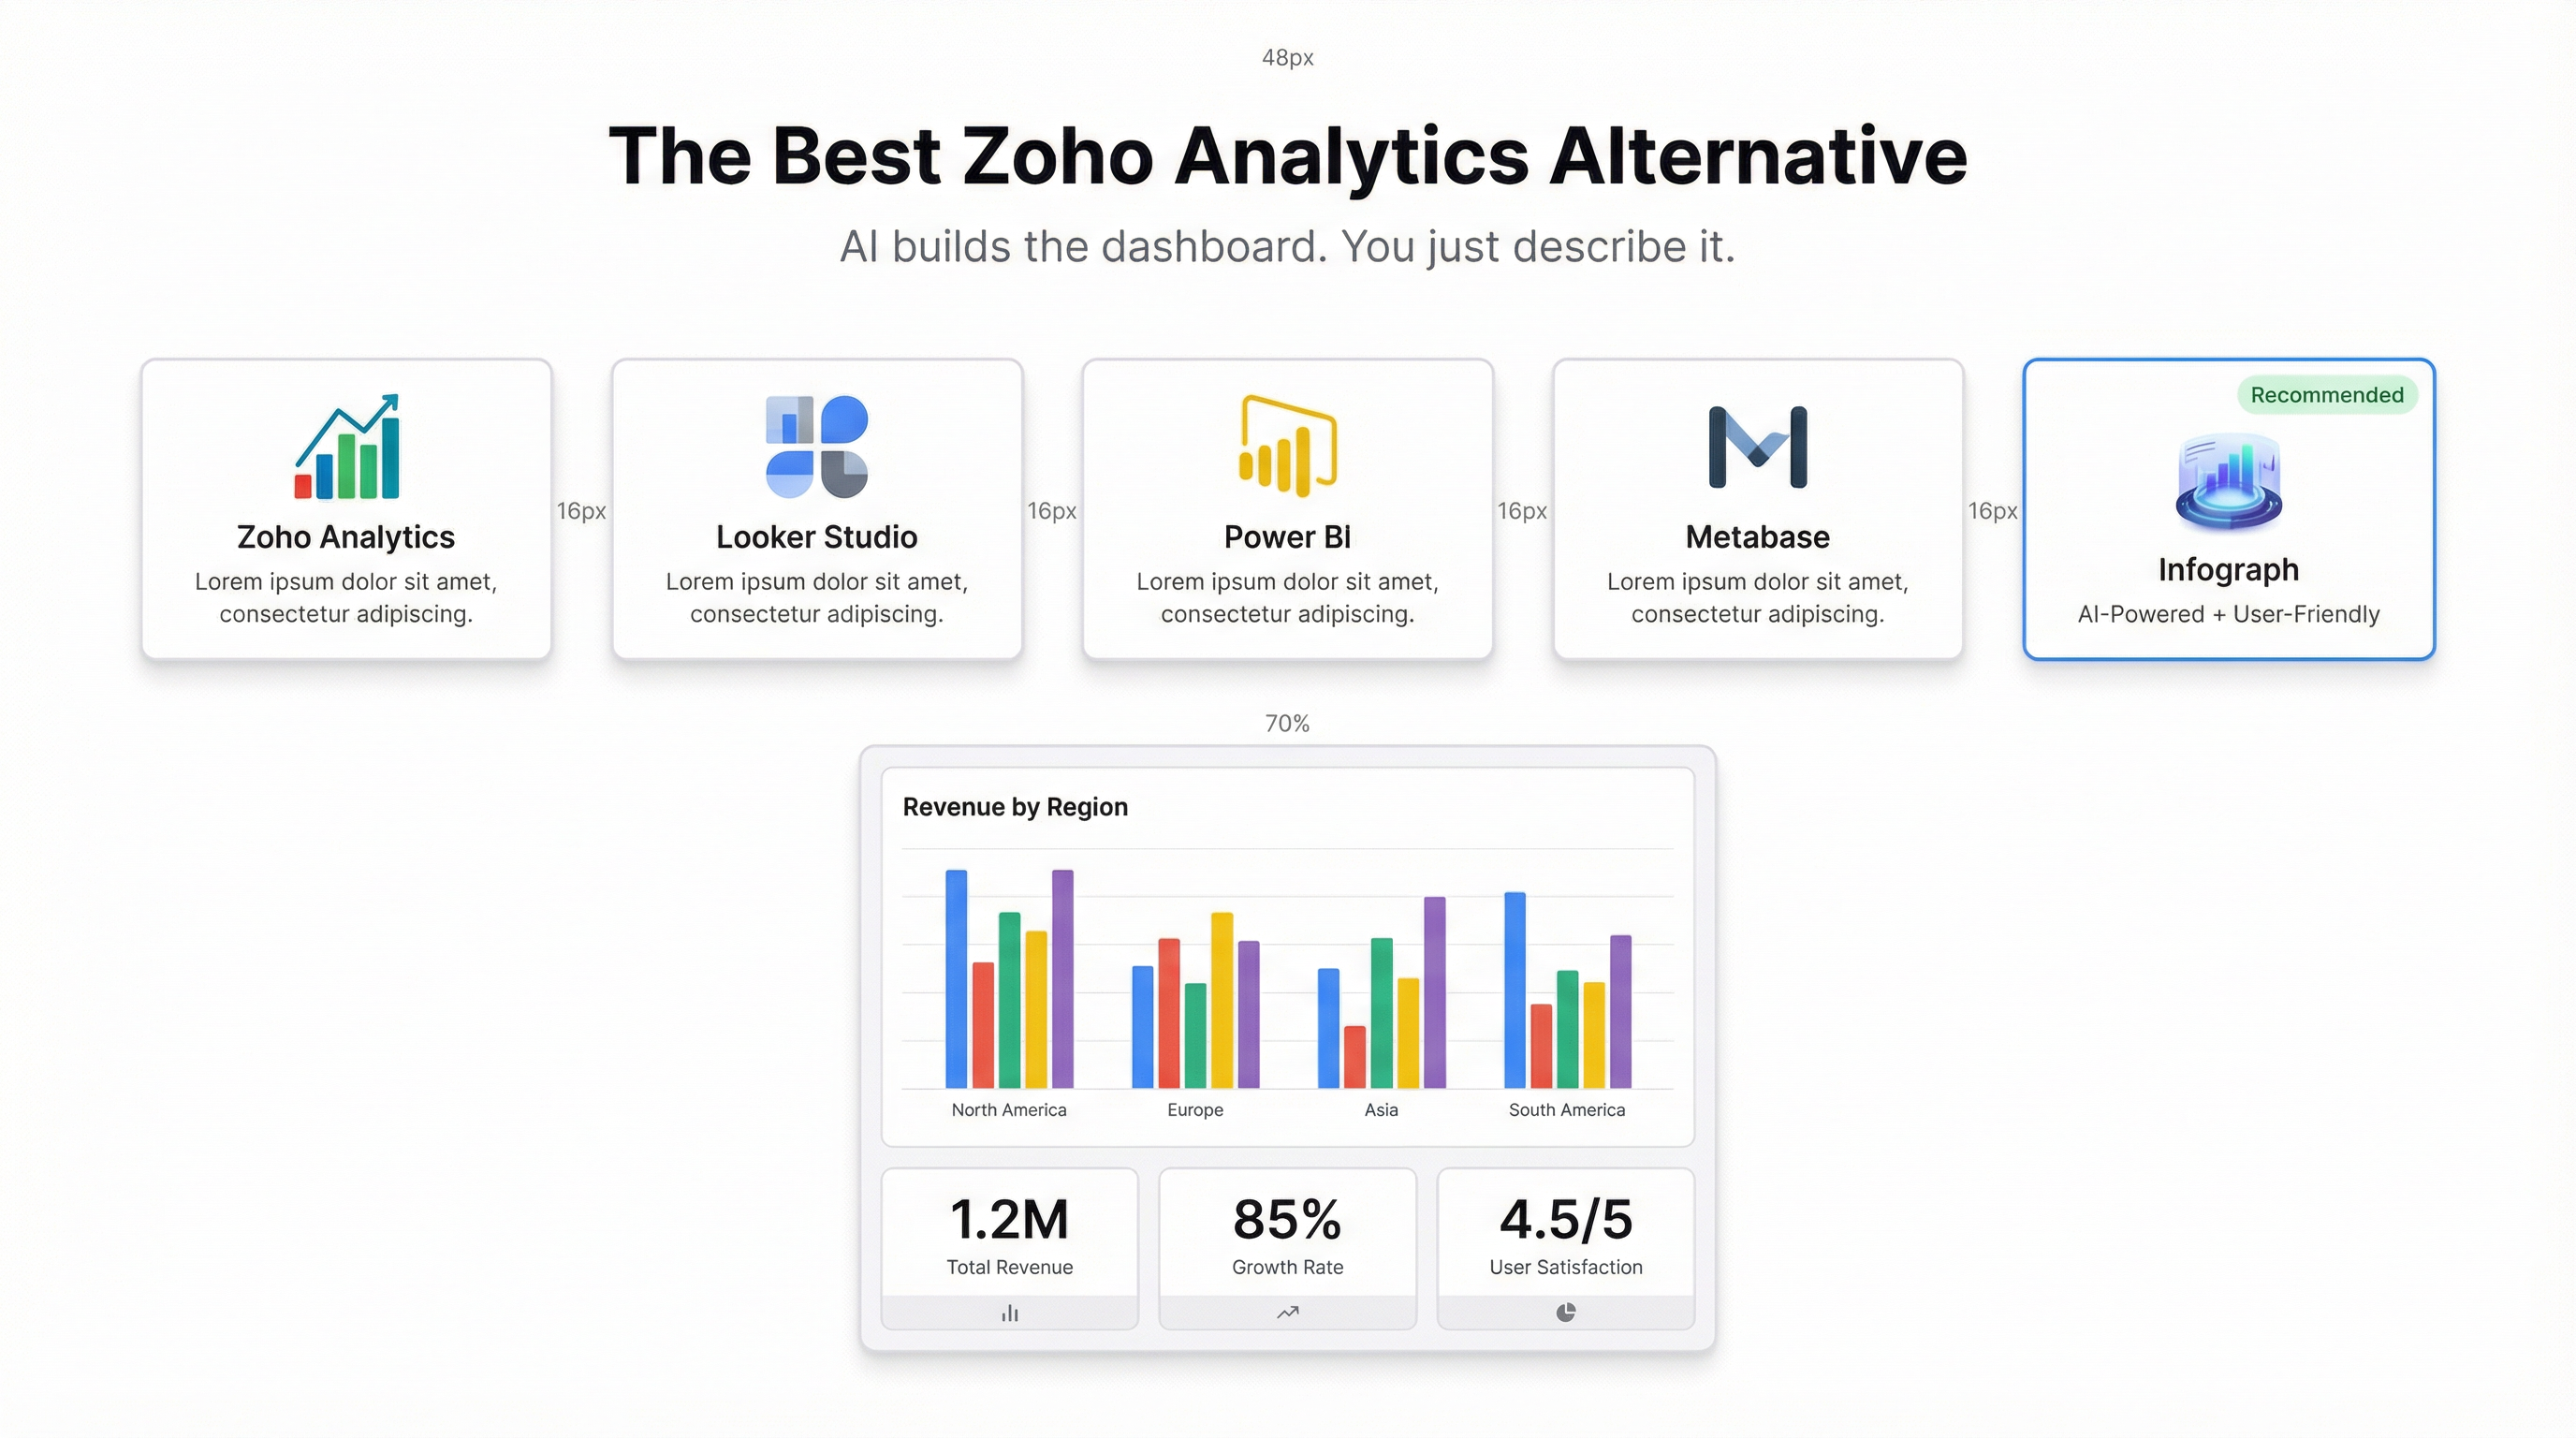
The Best Zoho Analytics Alternative in 2026
Guide
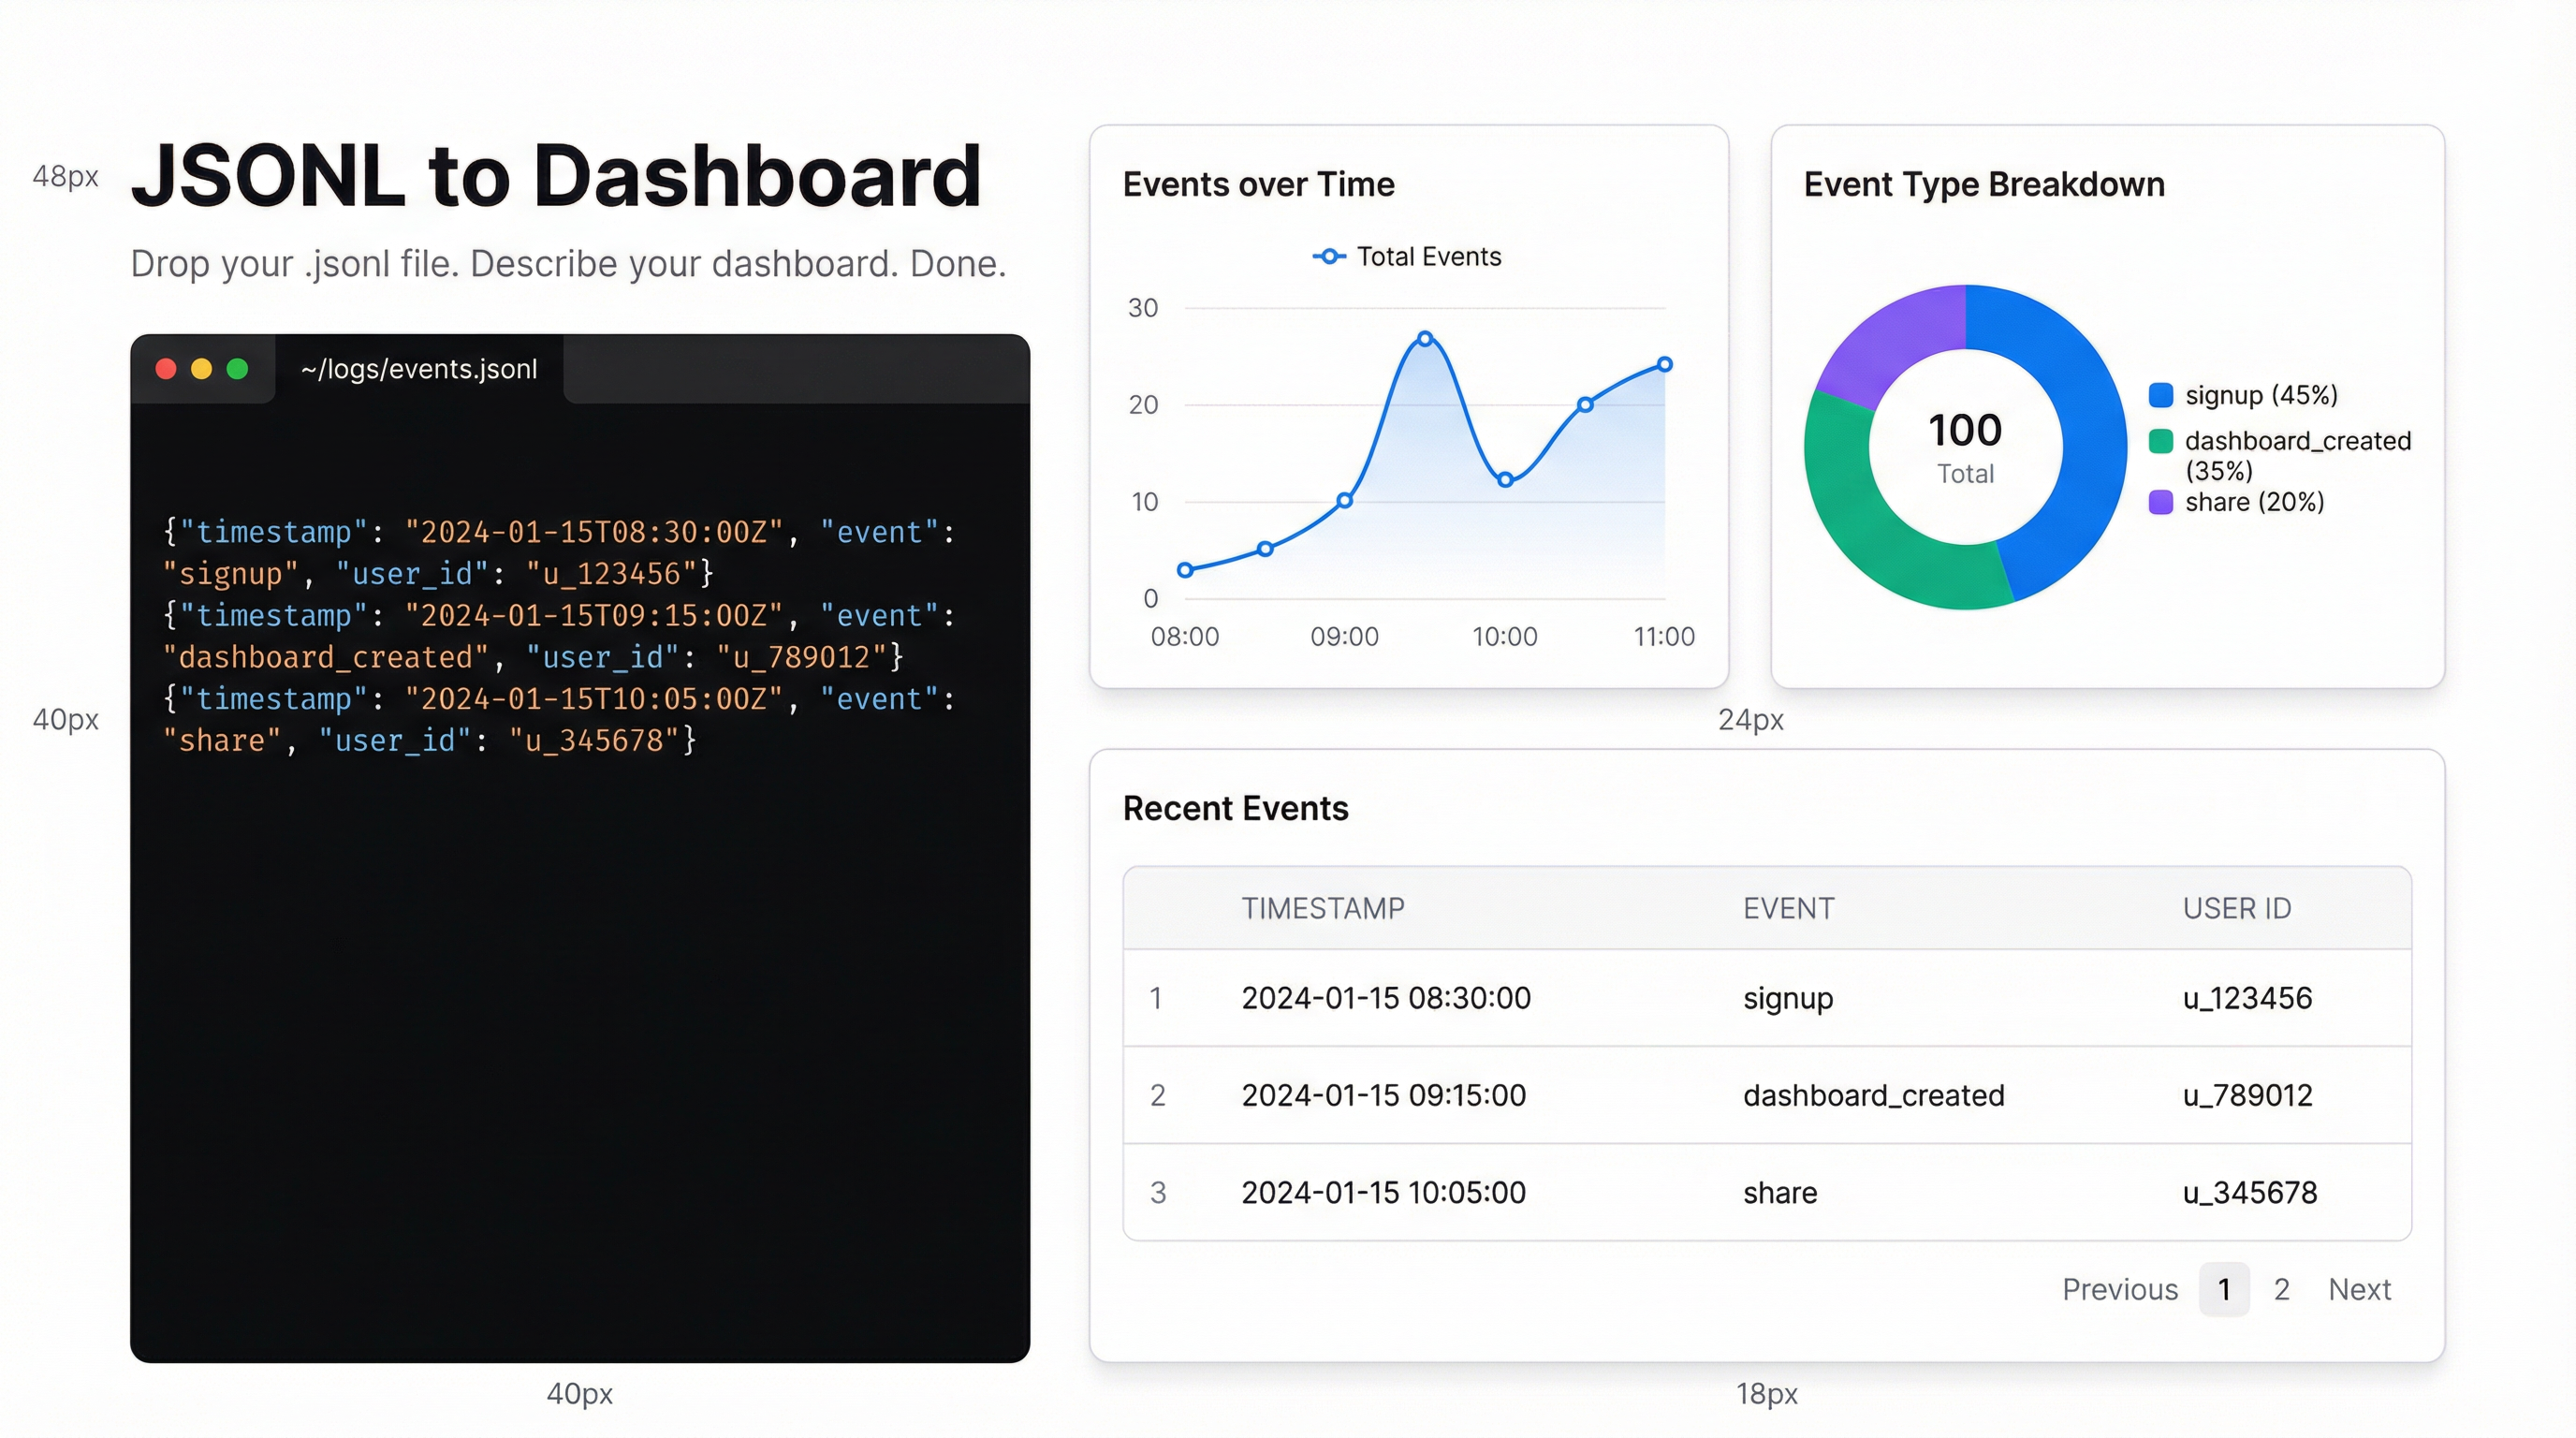
JSONL to Dashboard: Visualise Newline-Delimited JSON Instantly
Feature
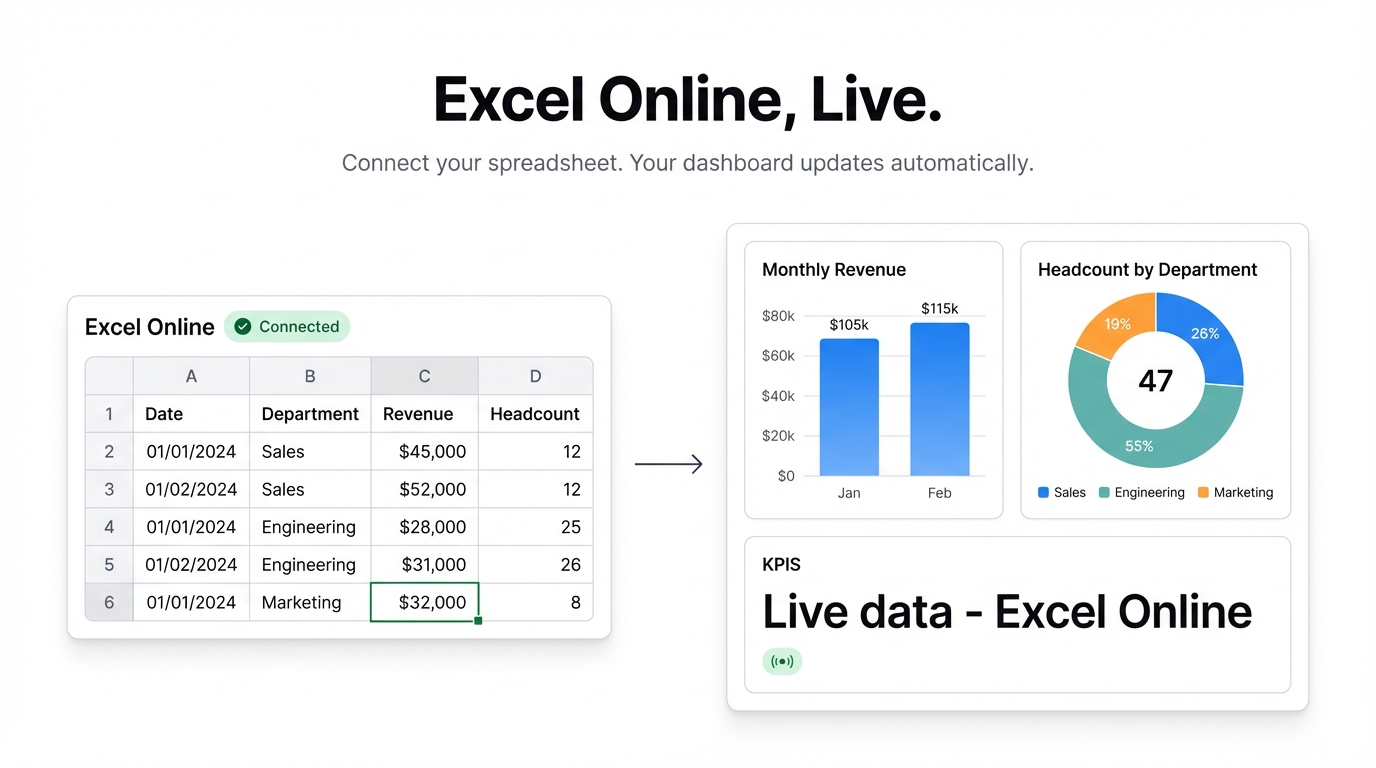
Microsoft Excel Online Dashboard: Live Data with Infograph
Comparison
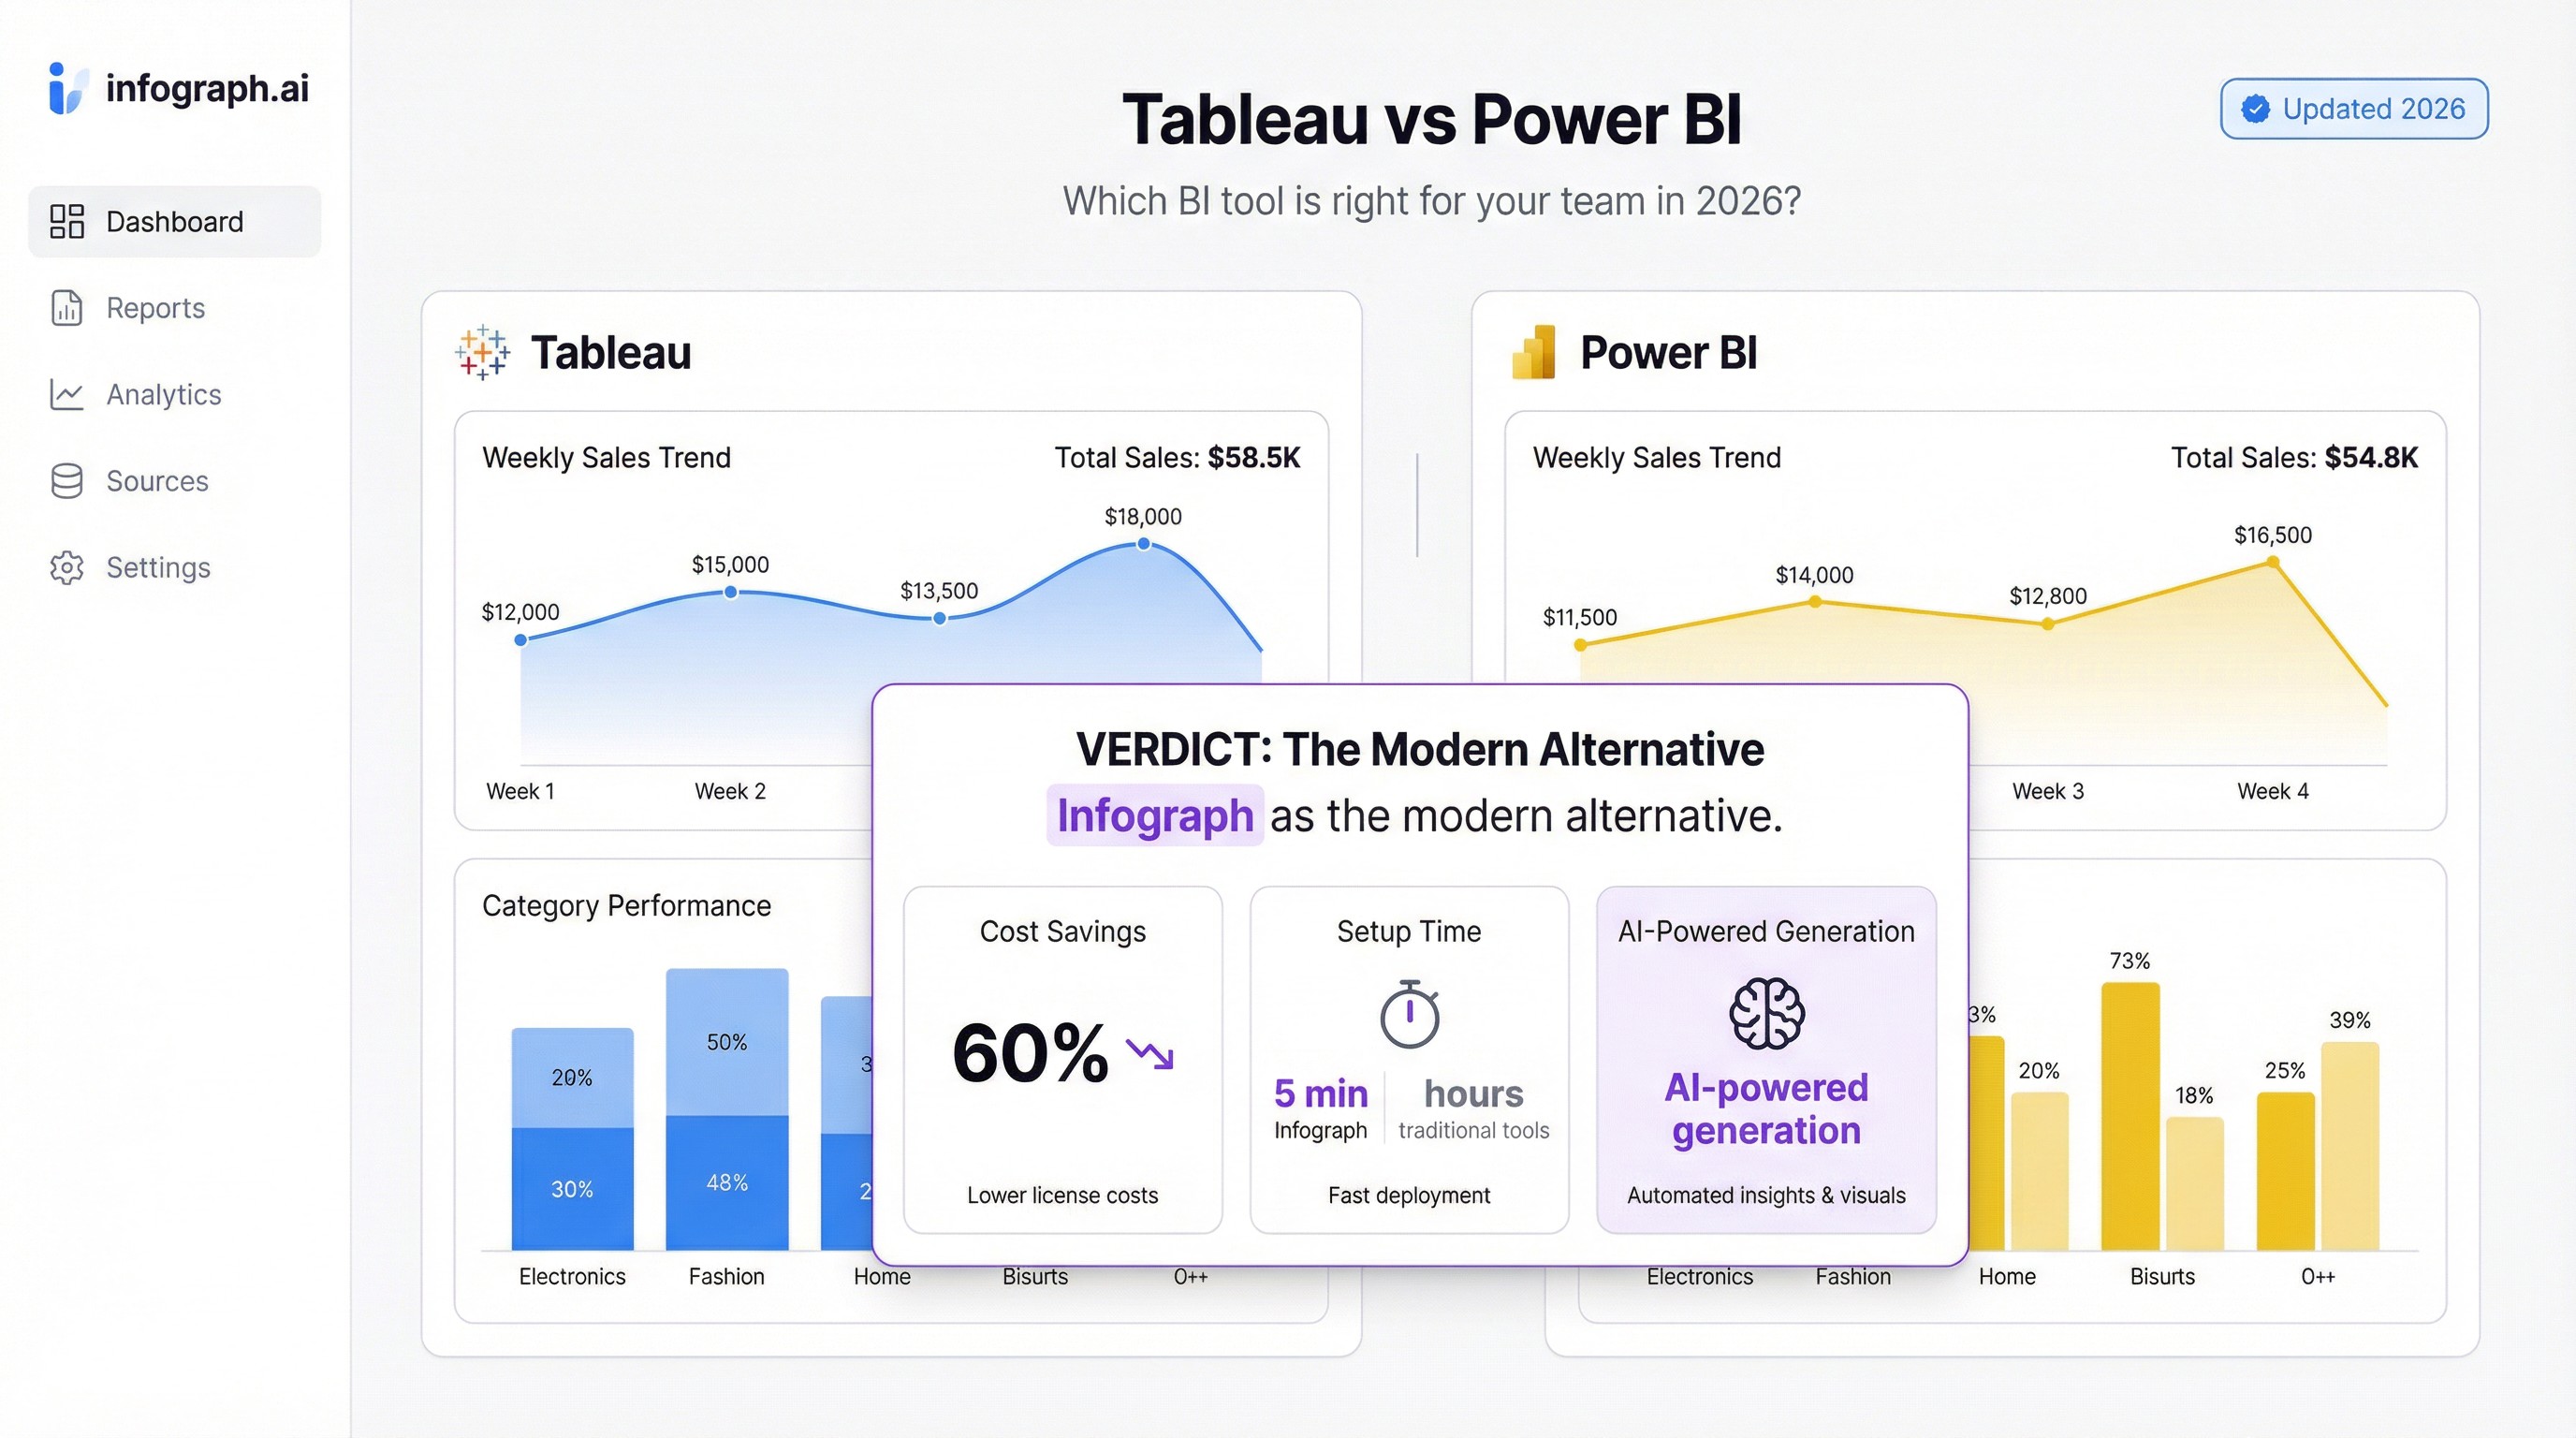
Tableau vs Power BI: Which Is Right for Your Team in 2026?
Guide
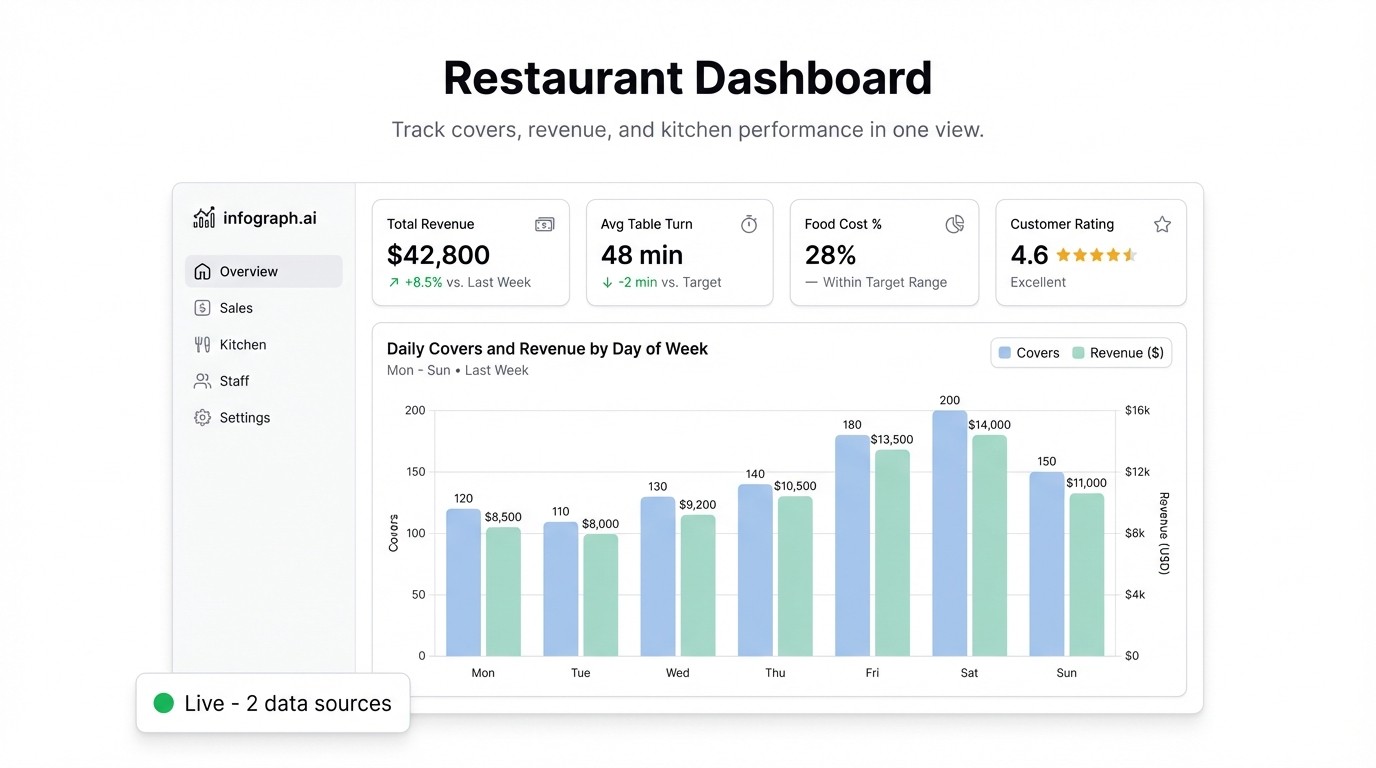
Restaurant Dashboard: Track Sales, Food Cost and Table Turns in Real Time
Guide
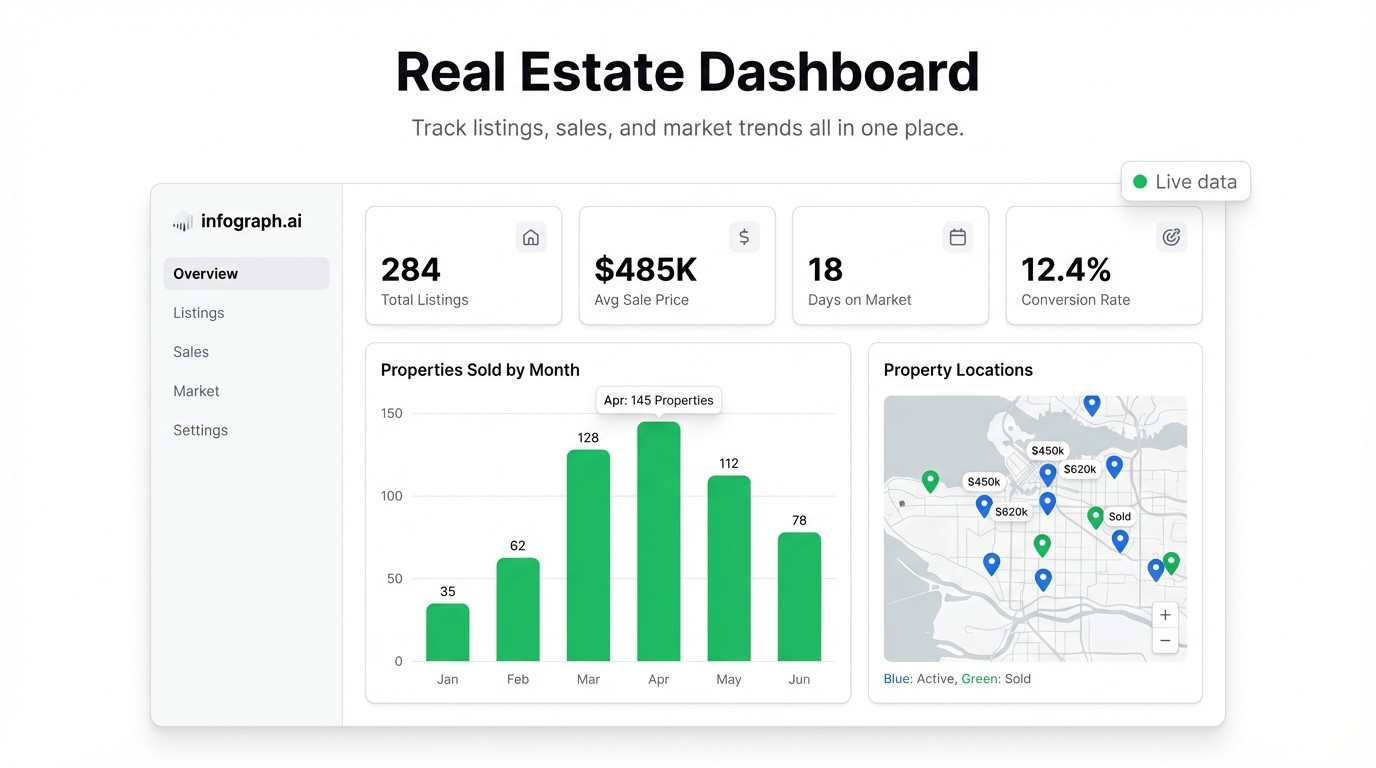
Real Estate Dashboard: Track Listings, Pipeline and Revenue in One View
Guide
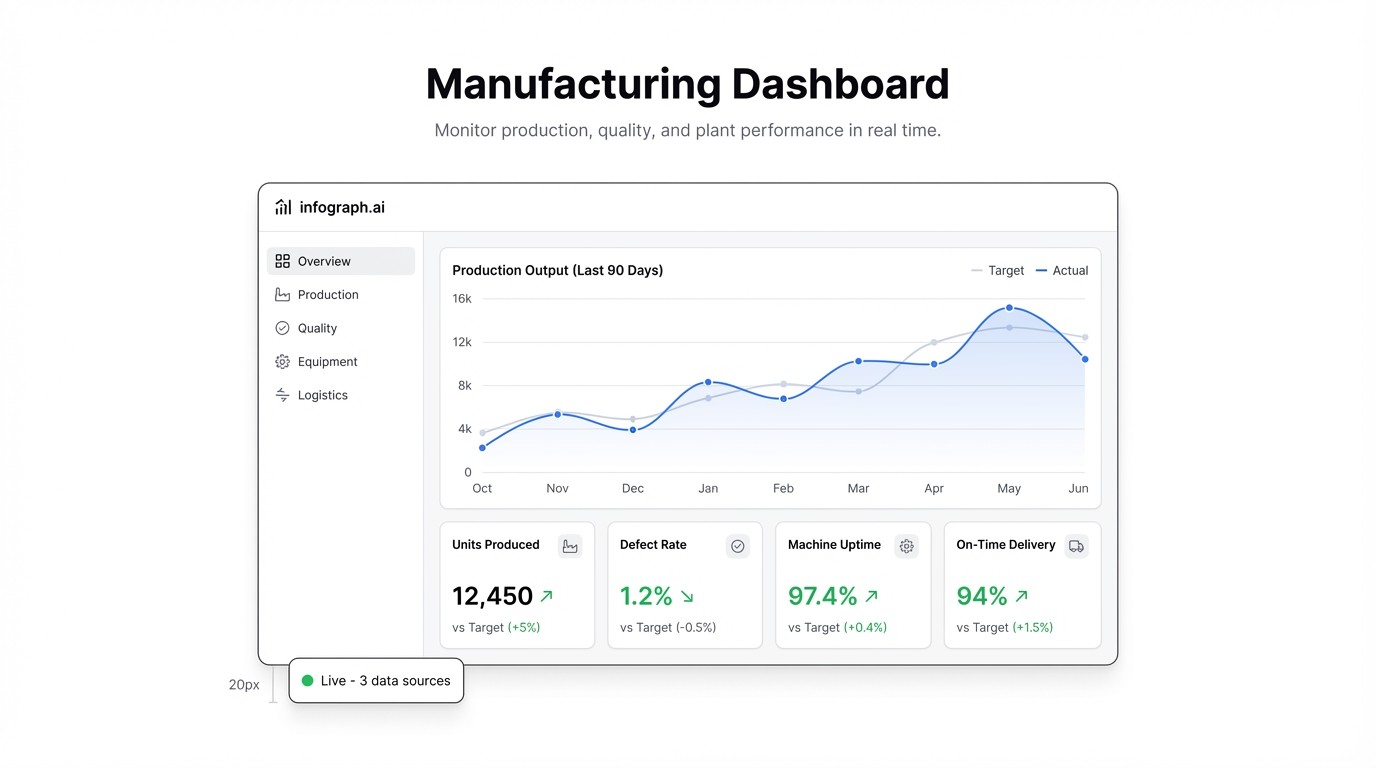
Manufacturing Dashboard: Track Production, Quality and Downtime in One View
Dashboard
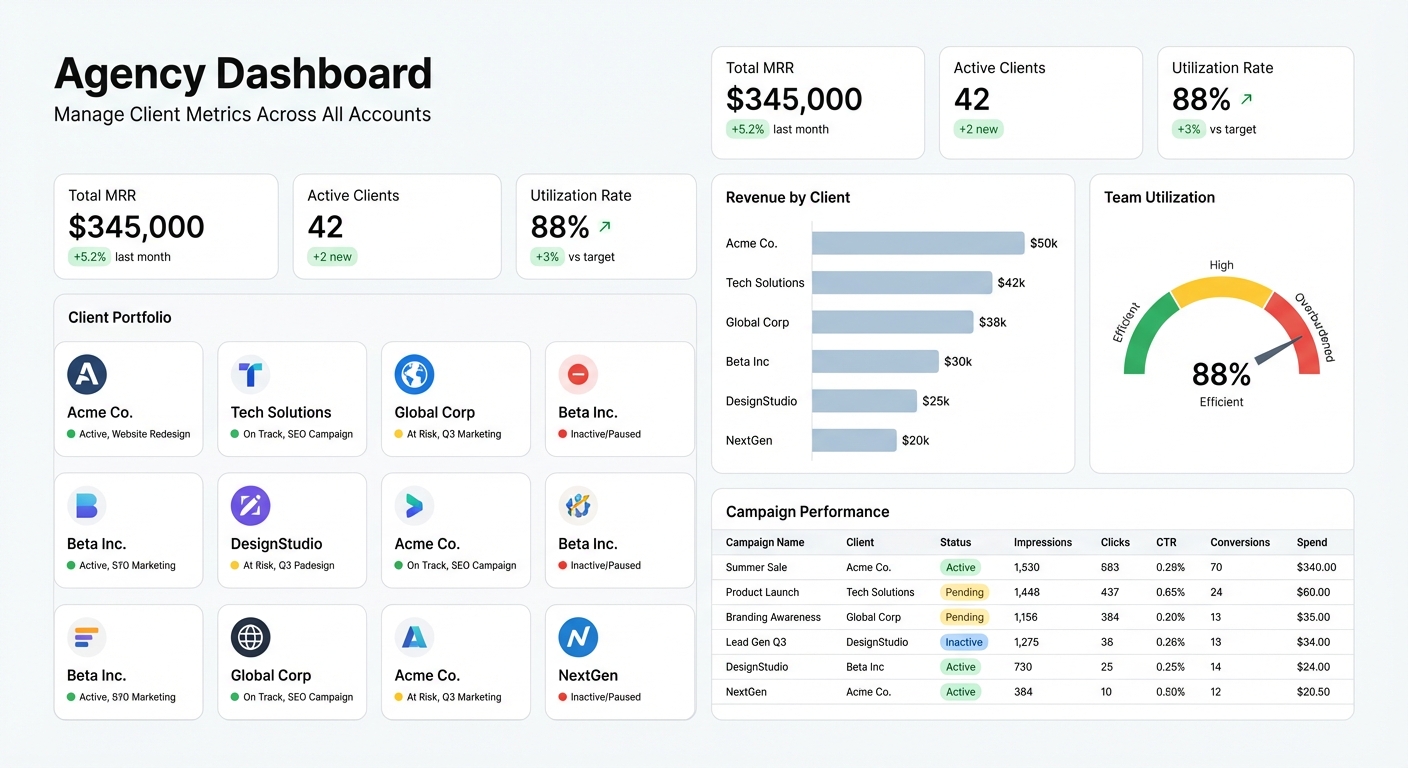
Agency Dashboard: Manage Client Metrics Across All Accounts
Guide
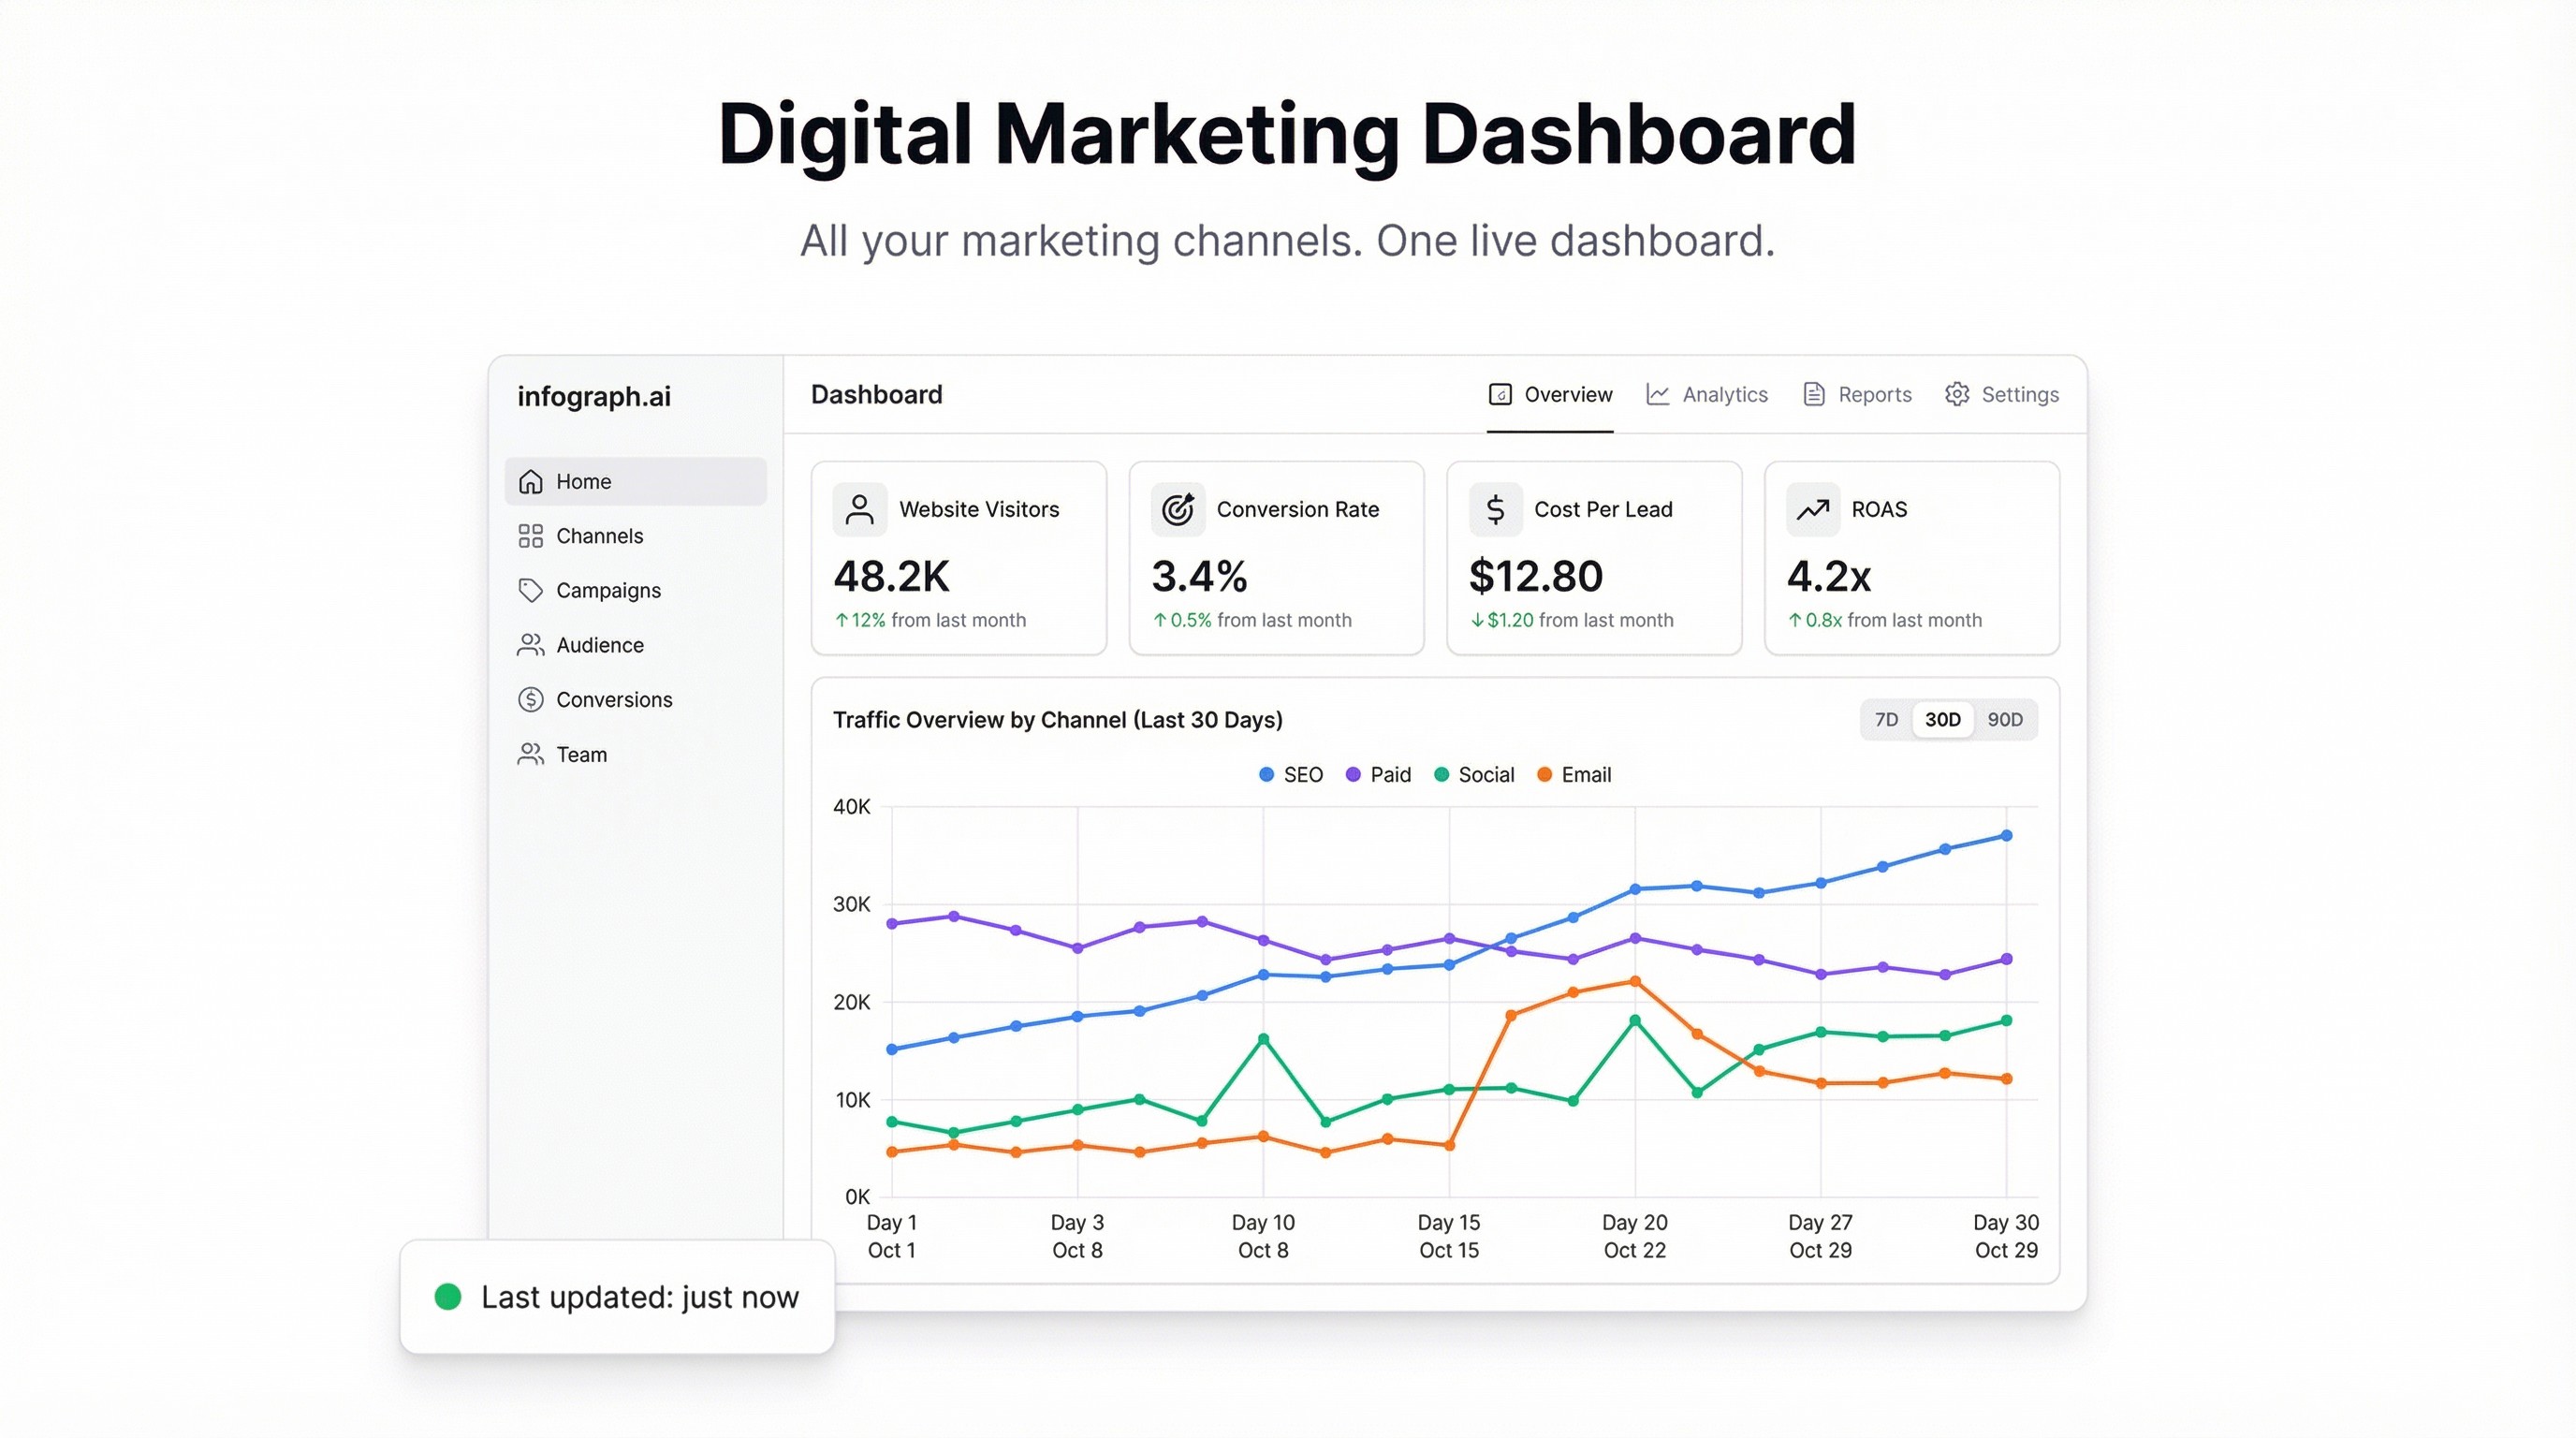
Digital Marketing Dashboard: Unify Google Ads, Meta Ads, and Organic in One View
Feature
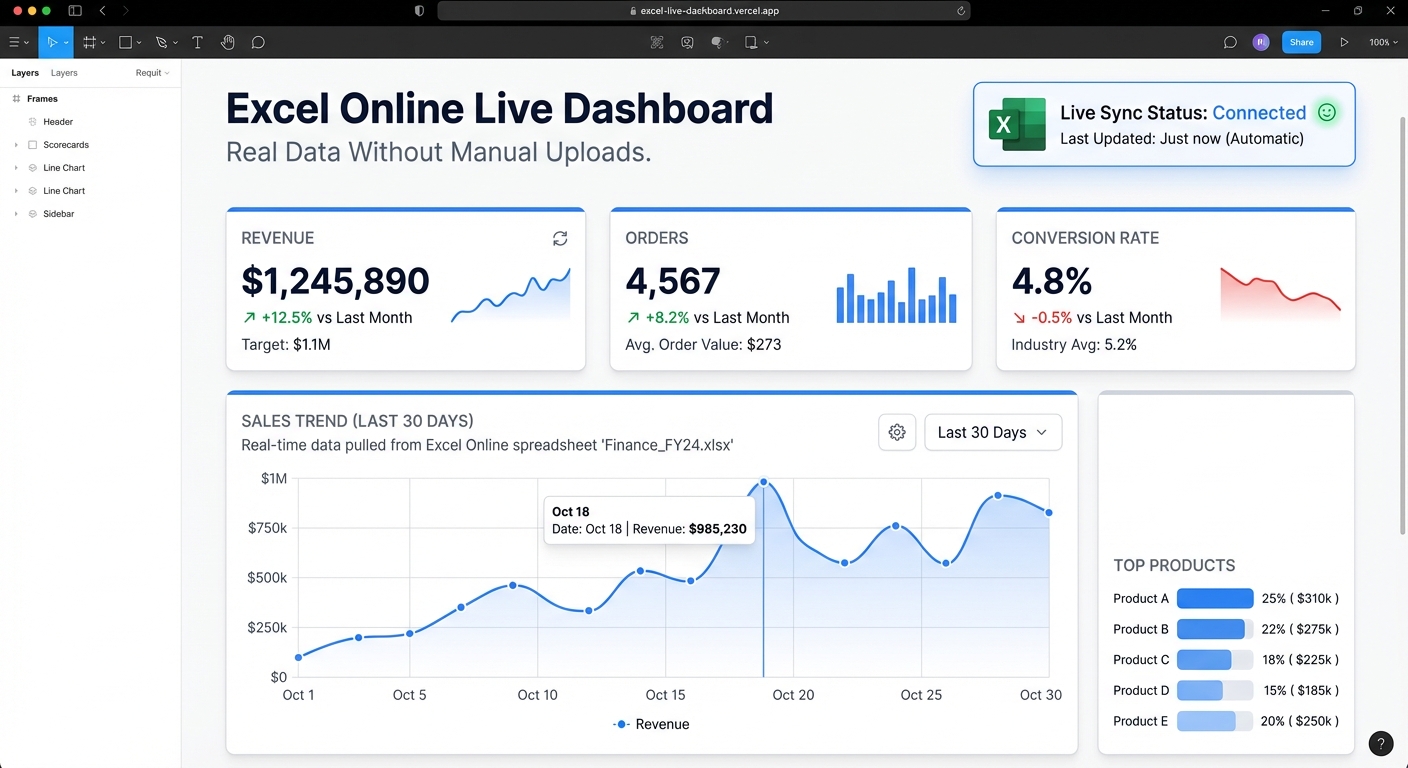
Excel Online Live Dashboard: Real Data Without Manual Uploads
Guide
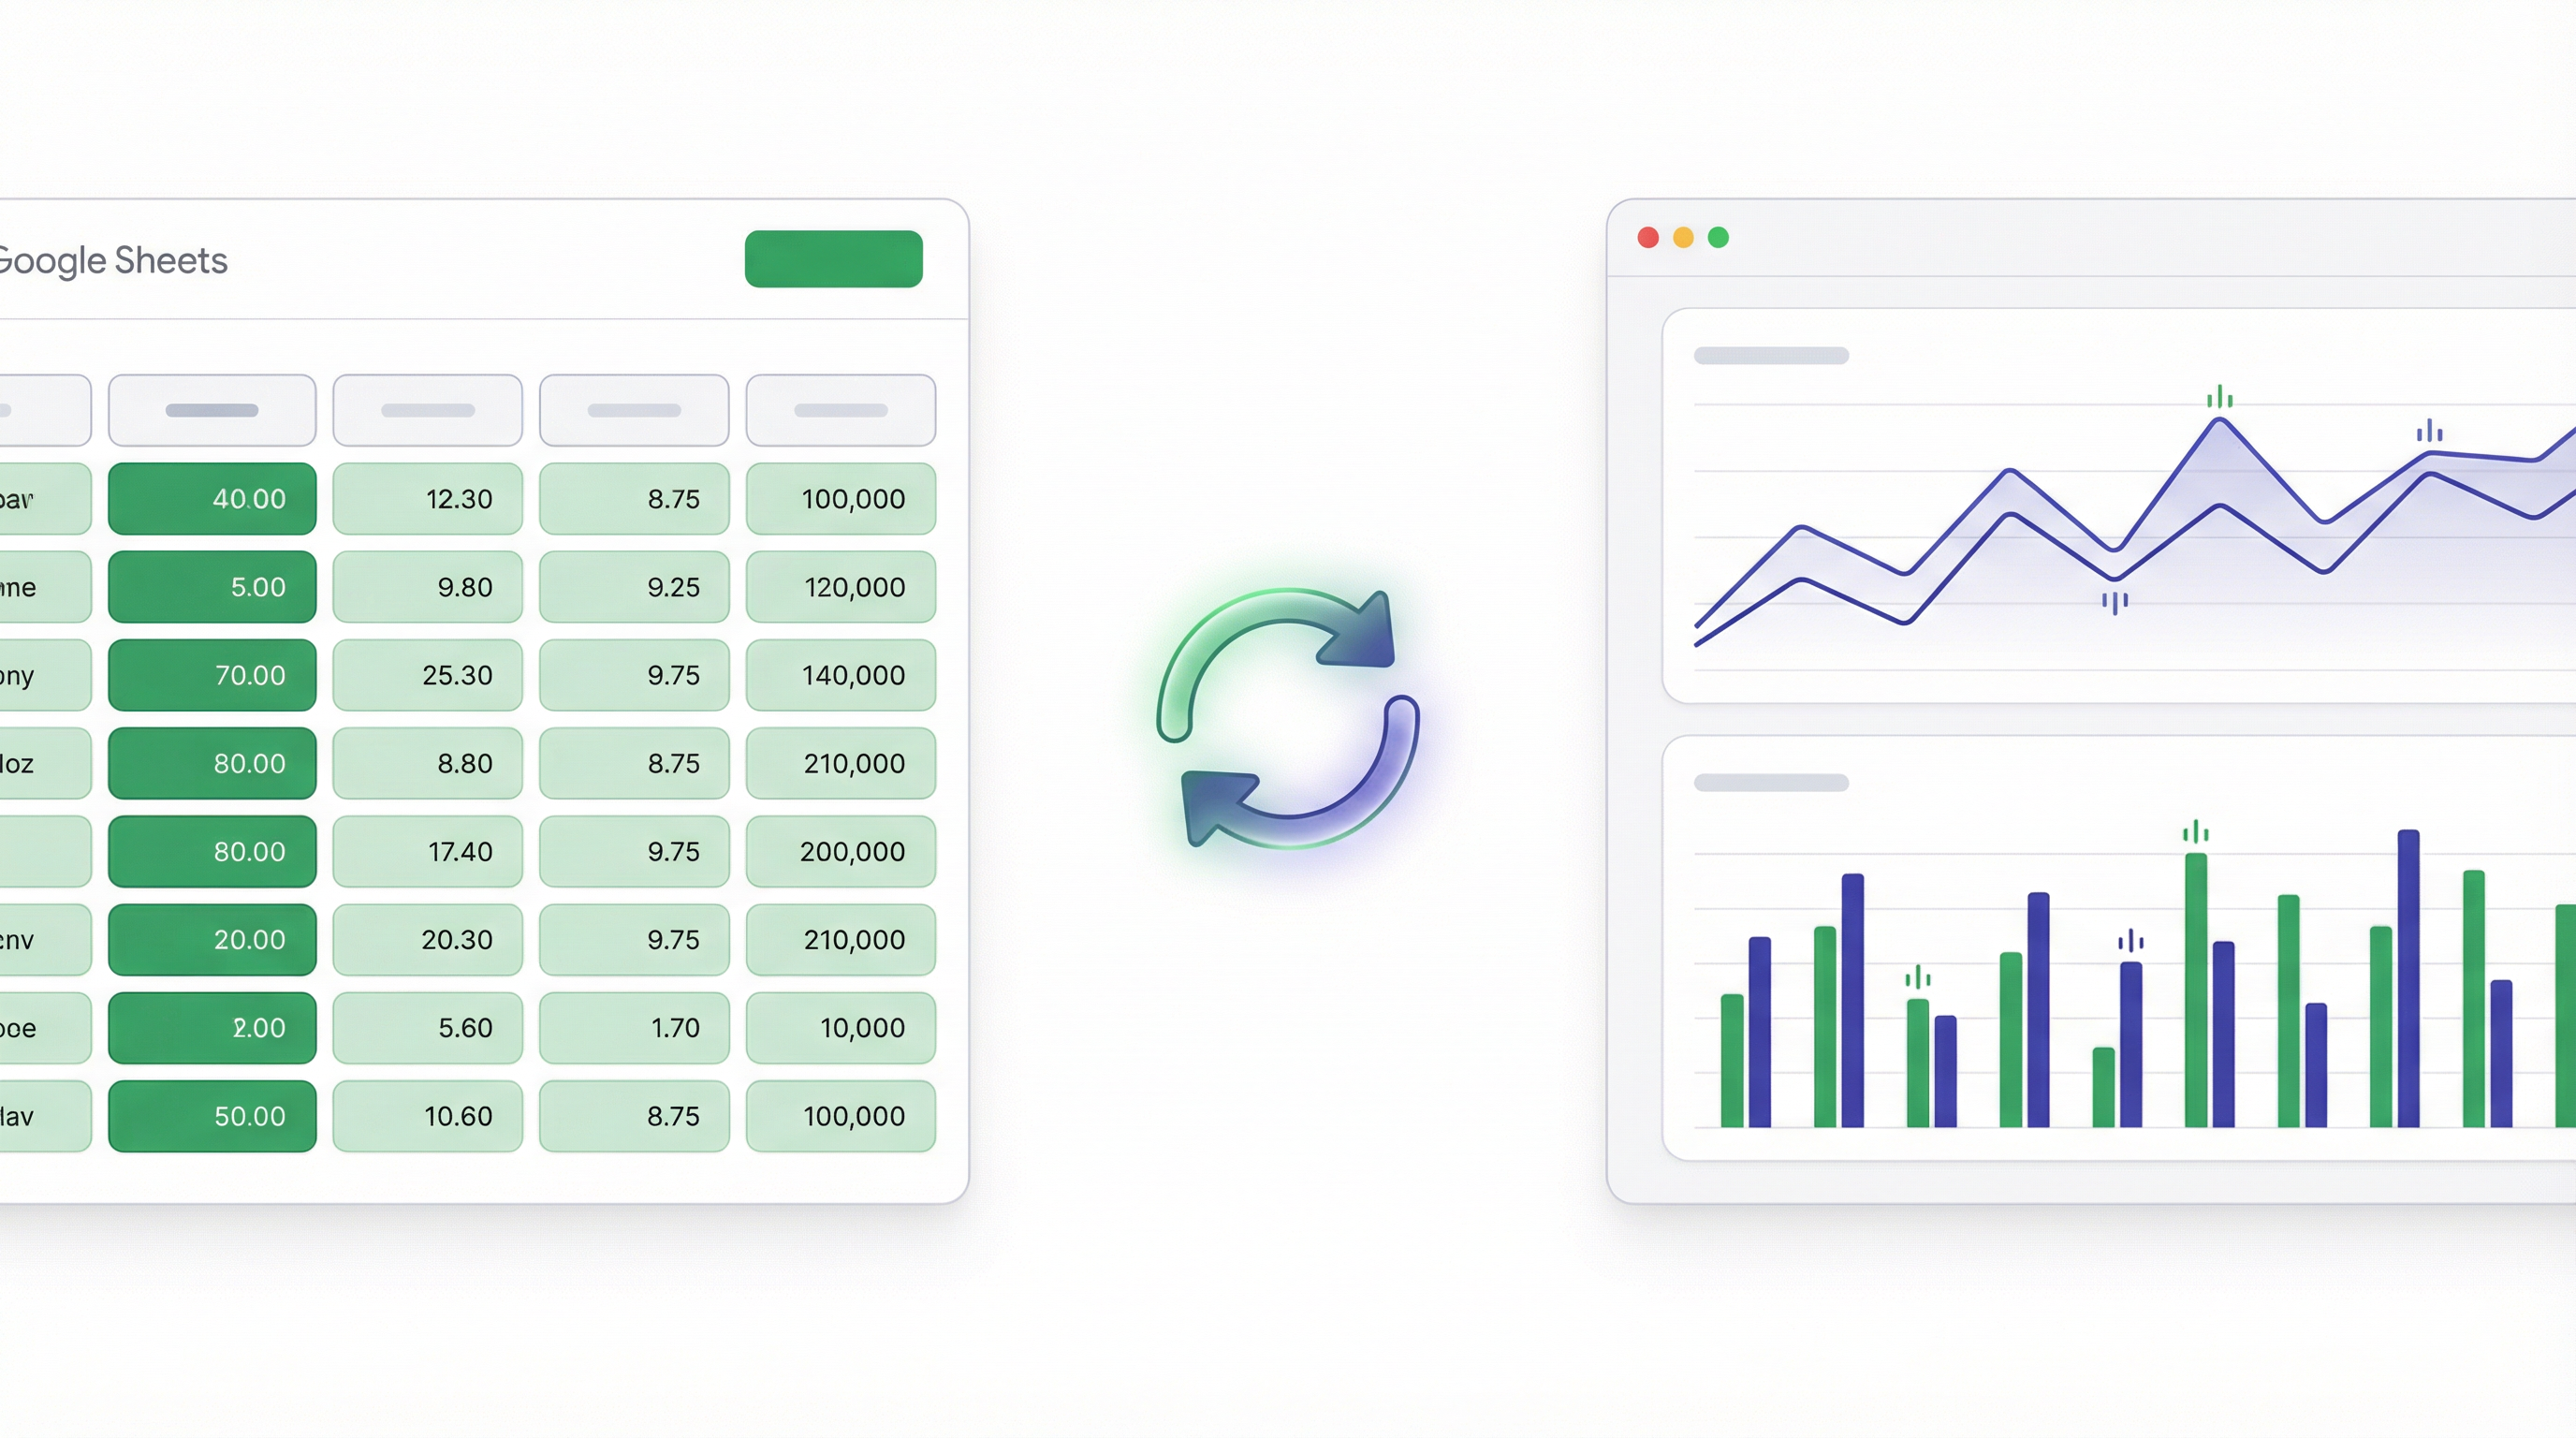
How to Turn a Google Sheet into a Live Dashboard
Guide
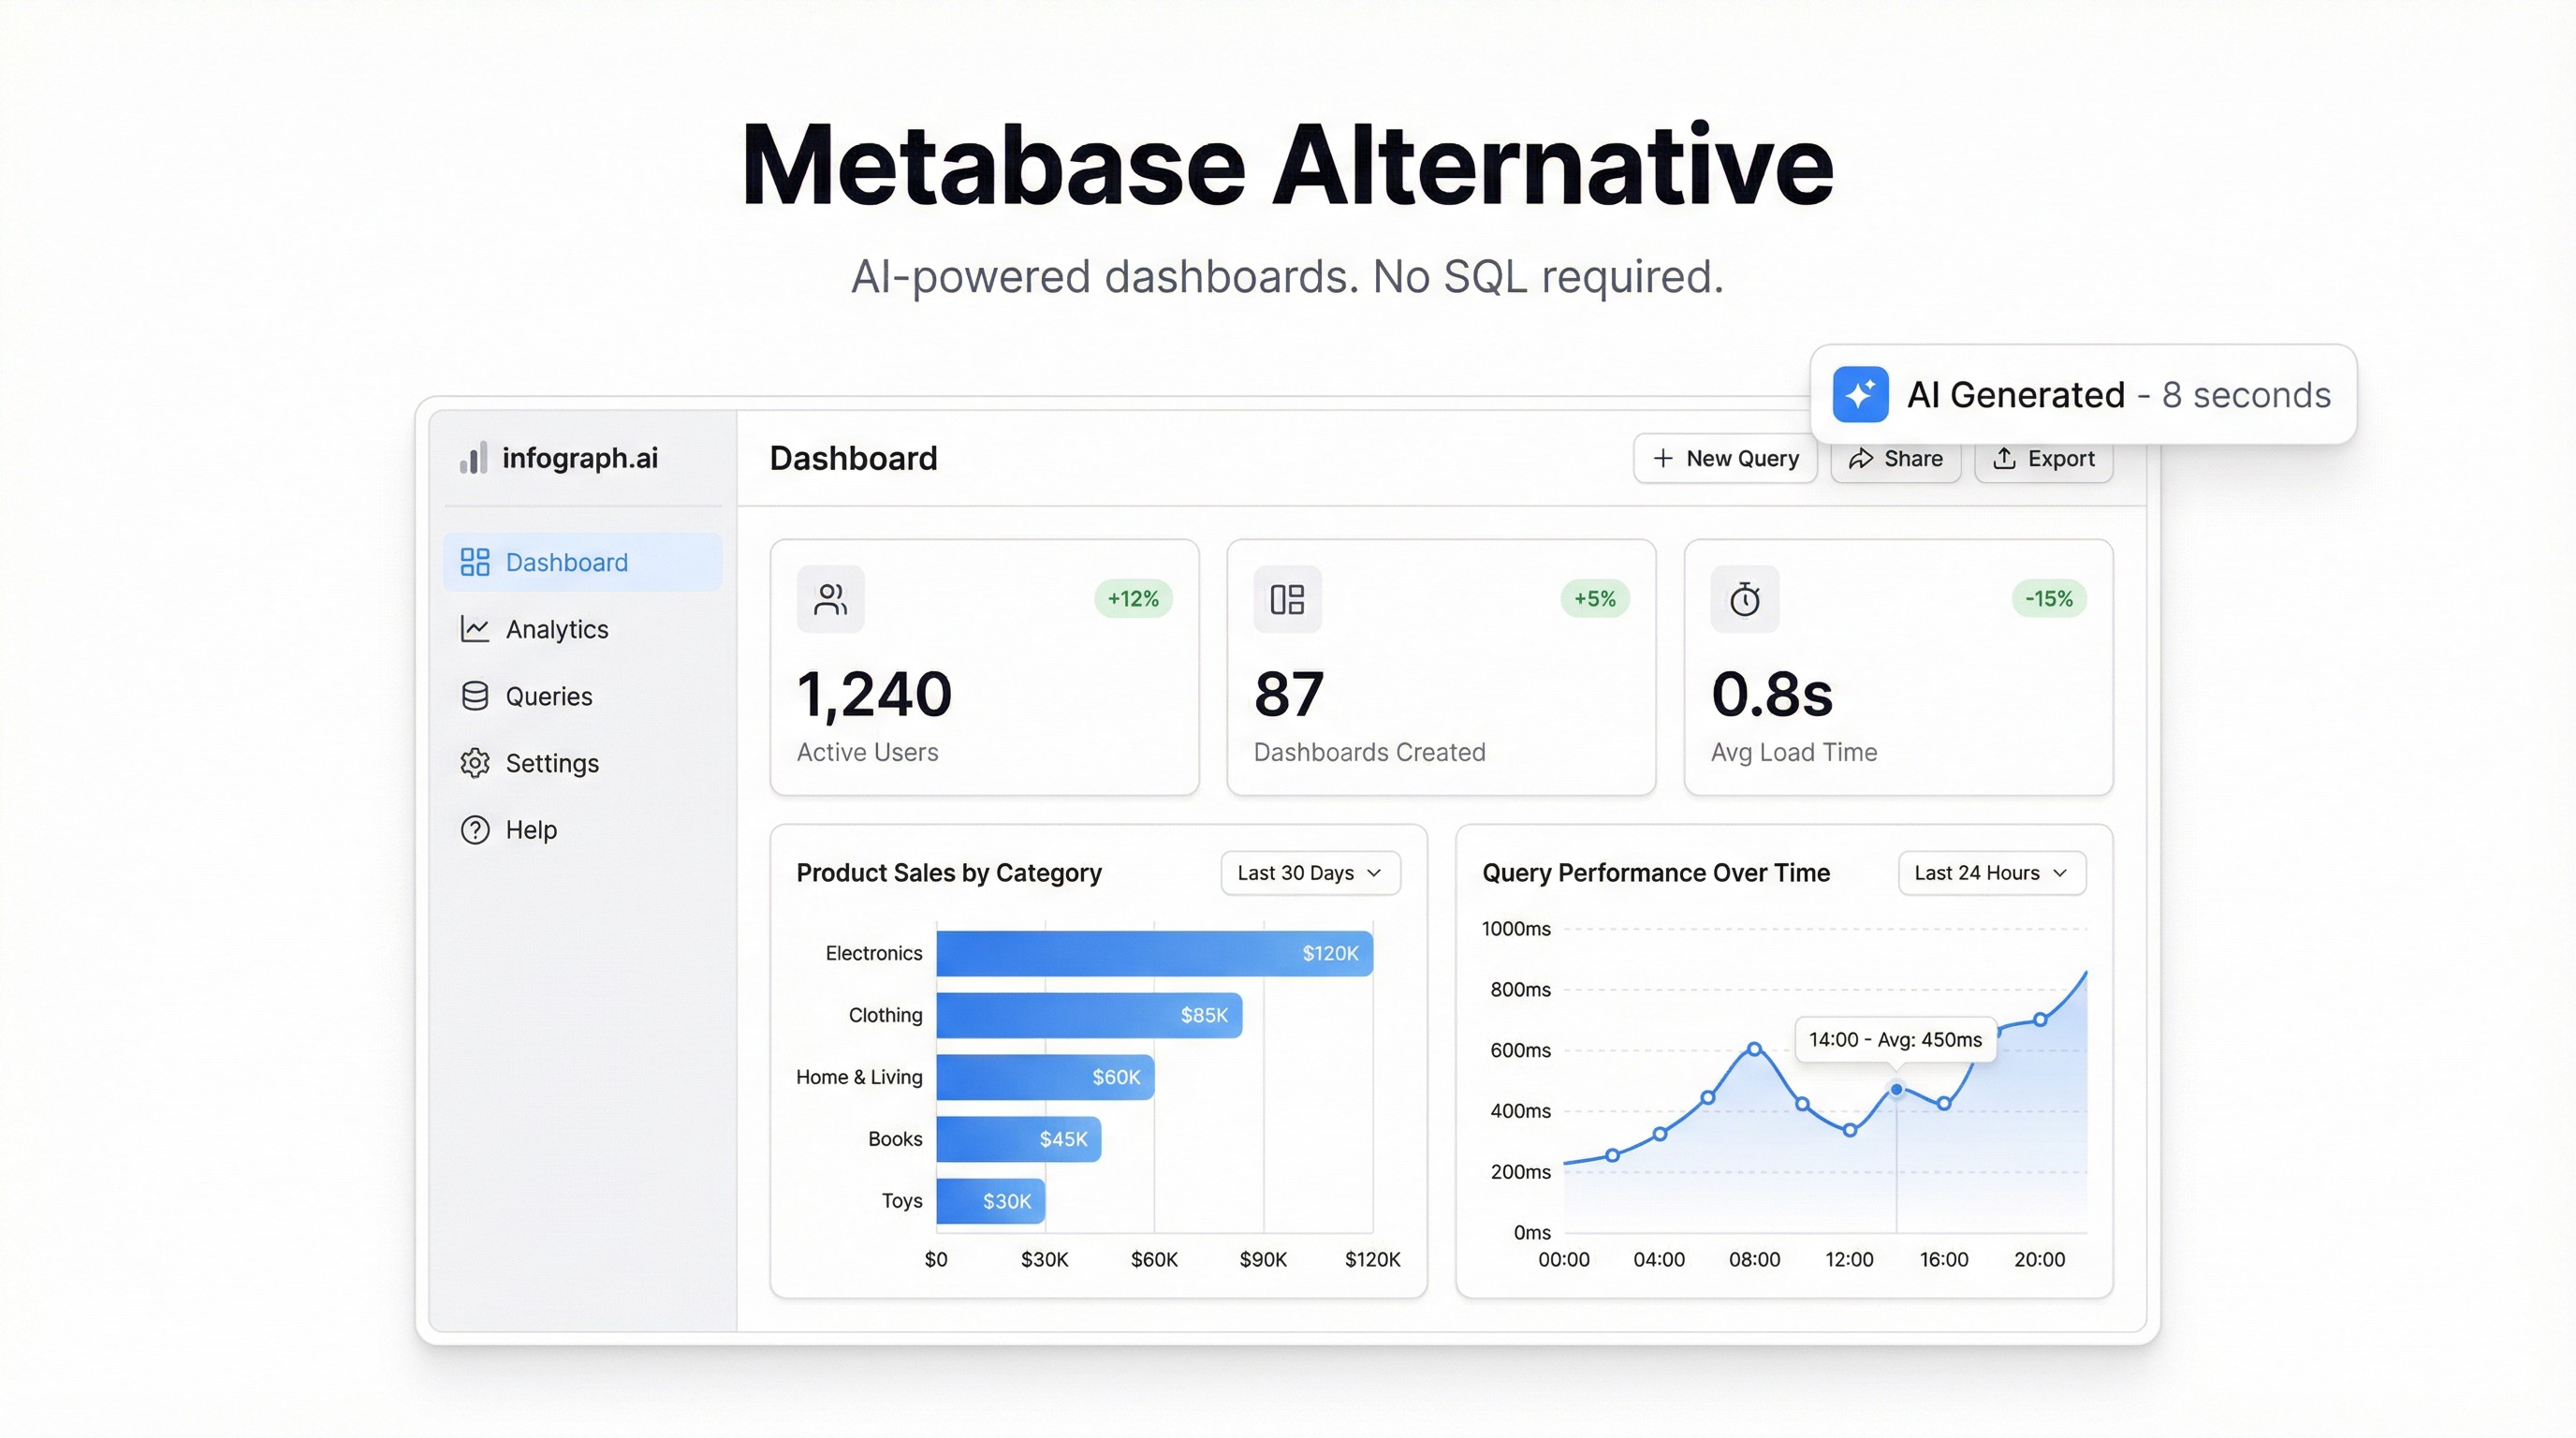
The Best Metabase Alternative in 2026 (For Teams Who Don't Want to Self-Host)
Guide
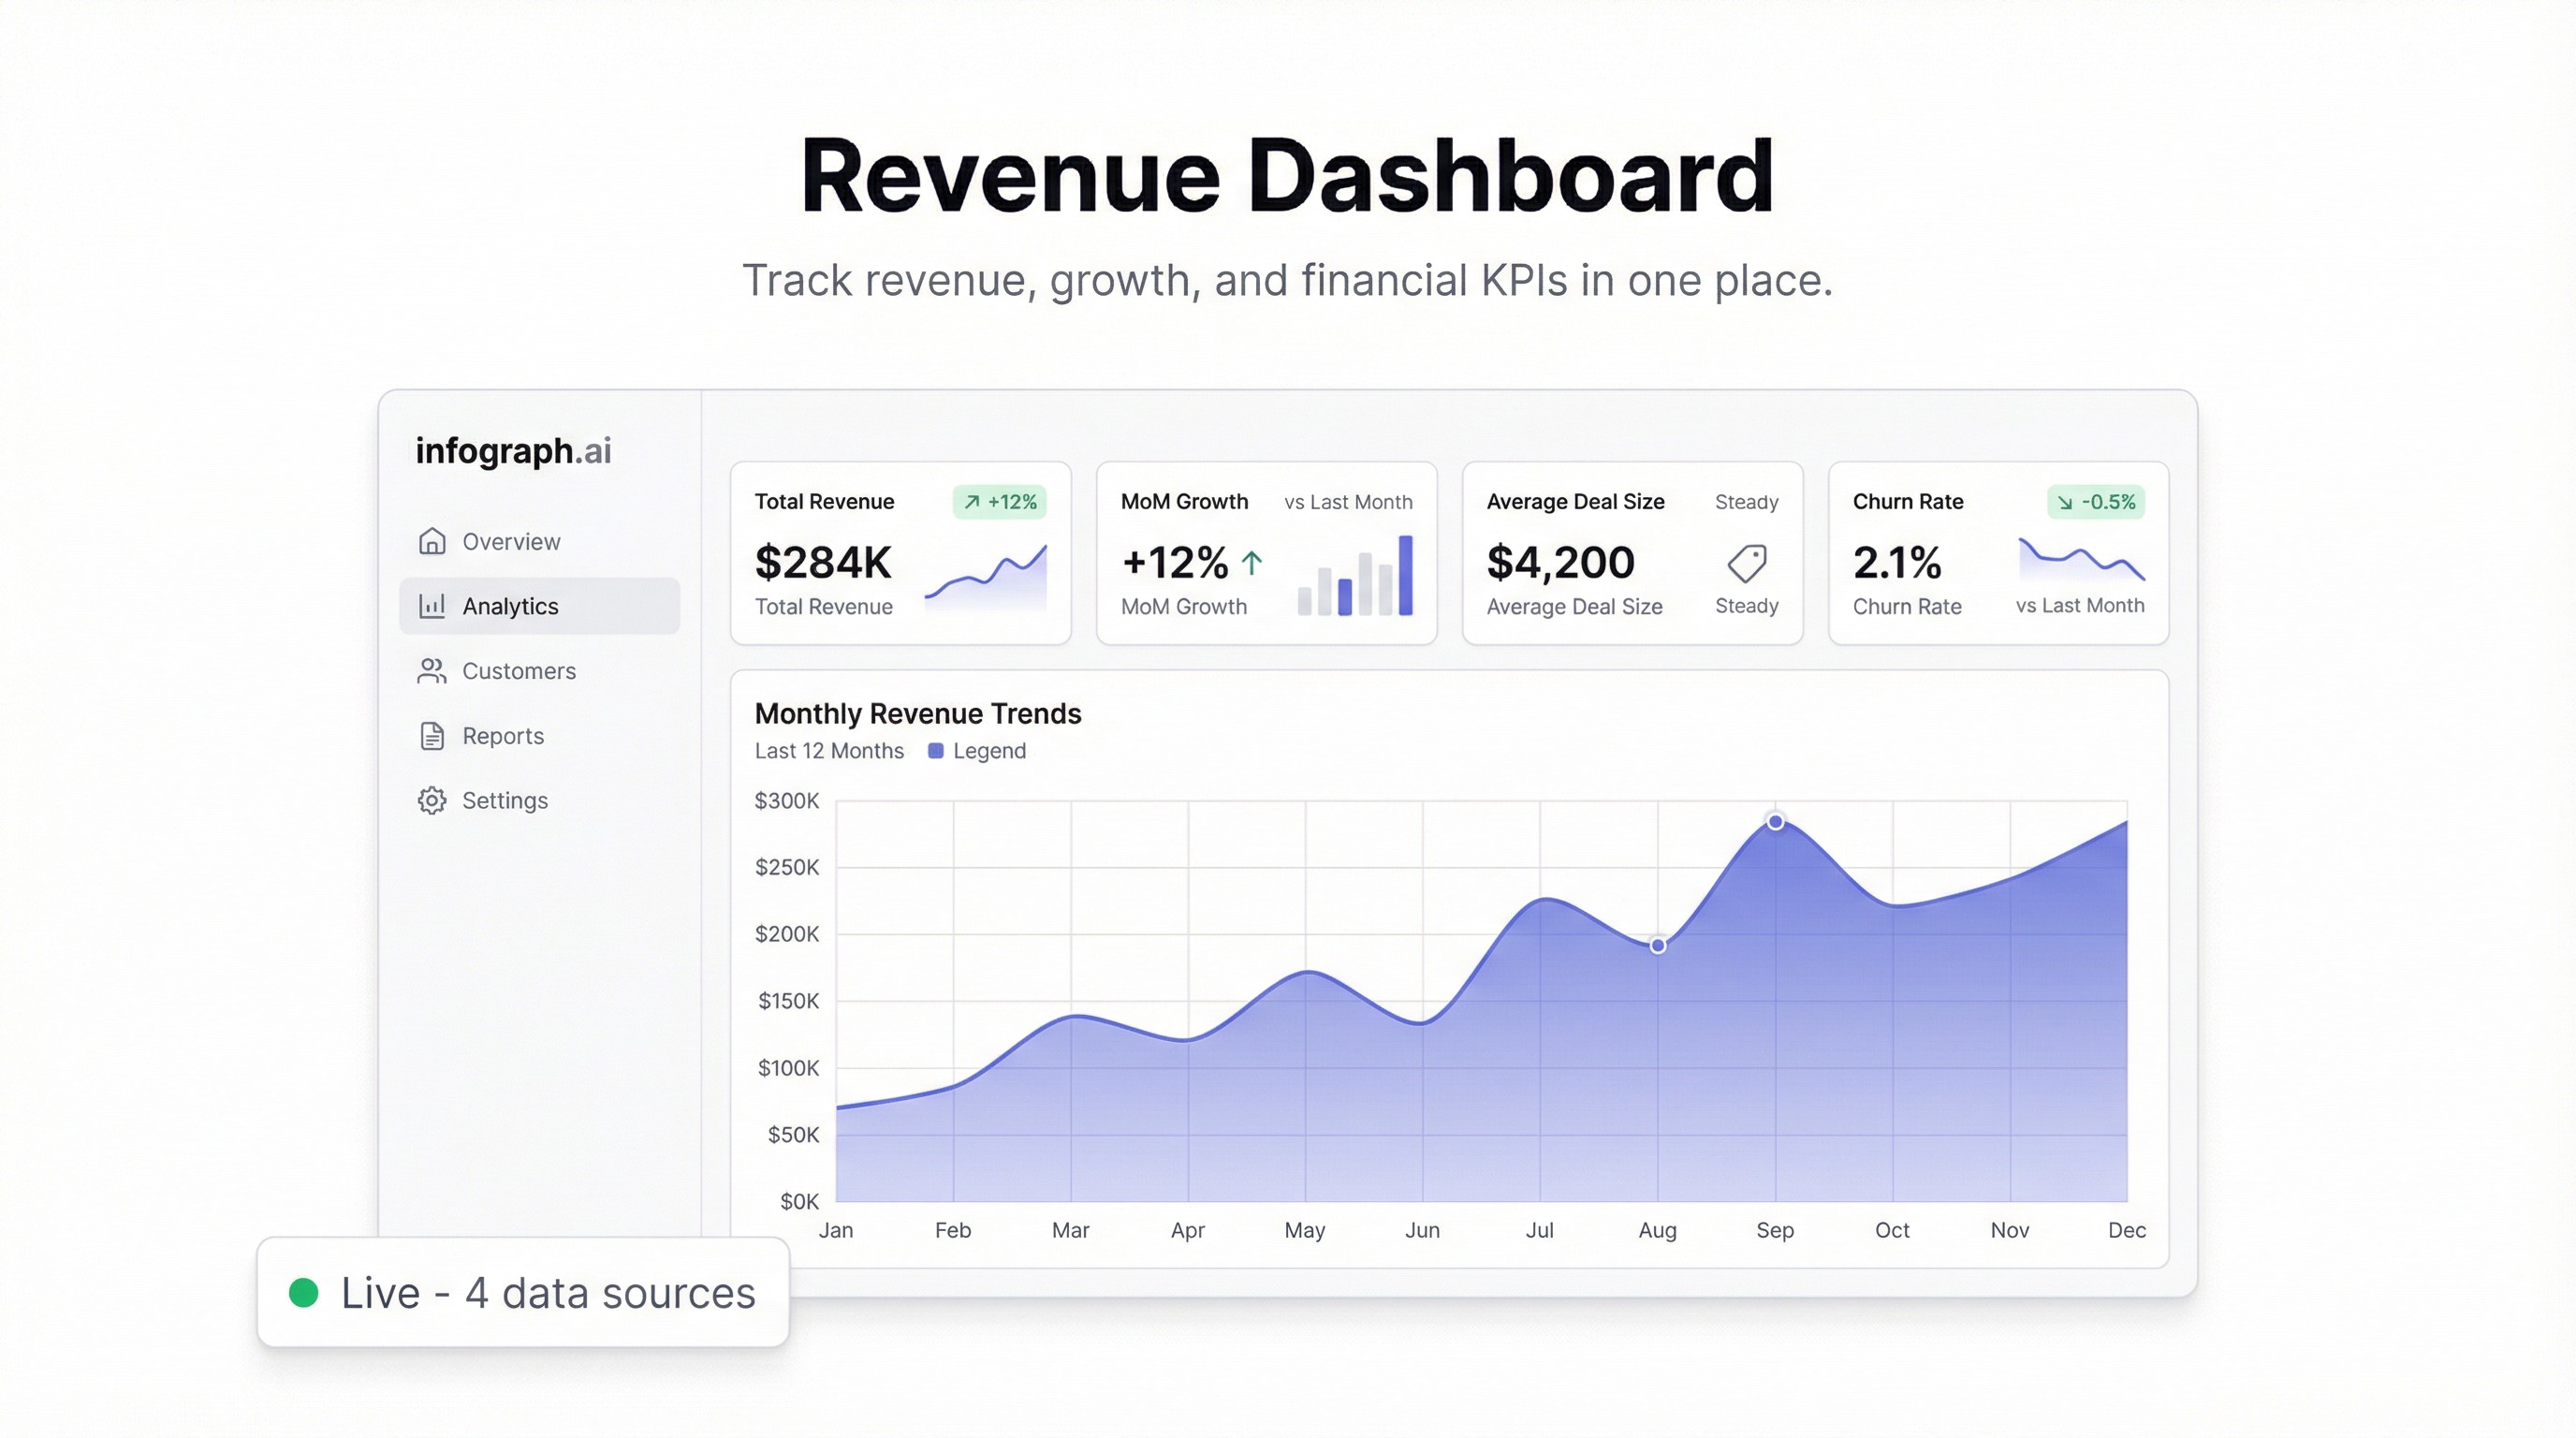
Revenue Dashboard: Track MRR, ARR, and Growth Rate Without a Data Team
General
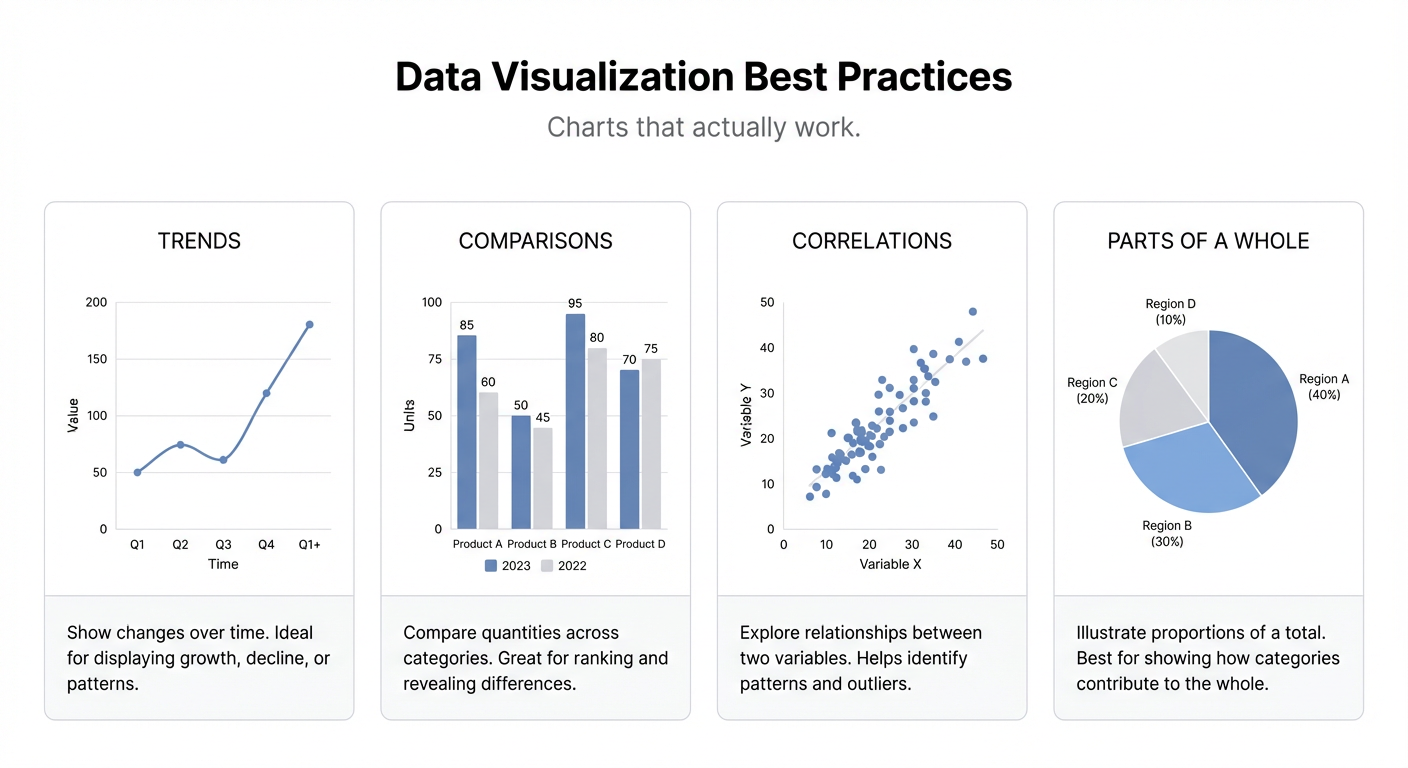
Data Visualization Best Practices That Actually Work
Dashboard
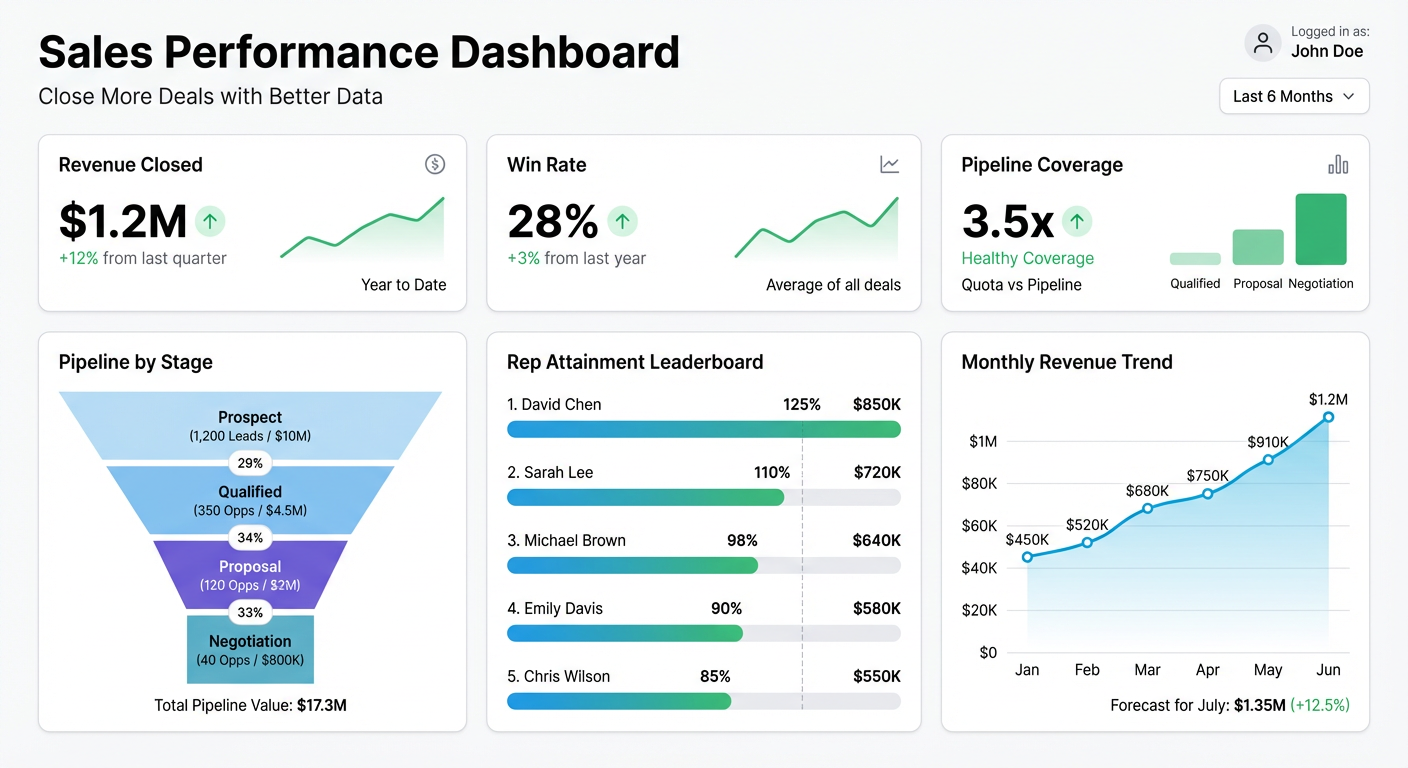
Sales Performance Dashboard: Close More Deals with Better Data
Guide
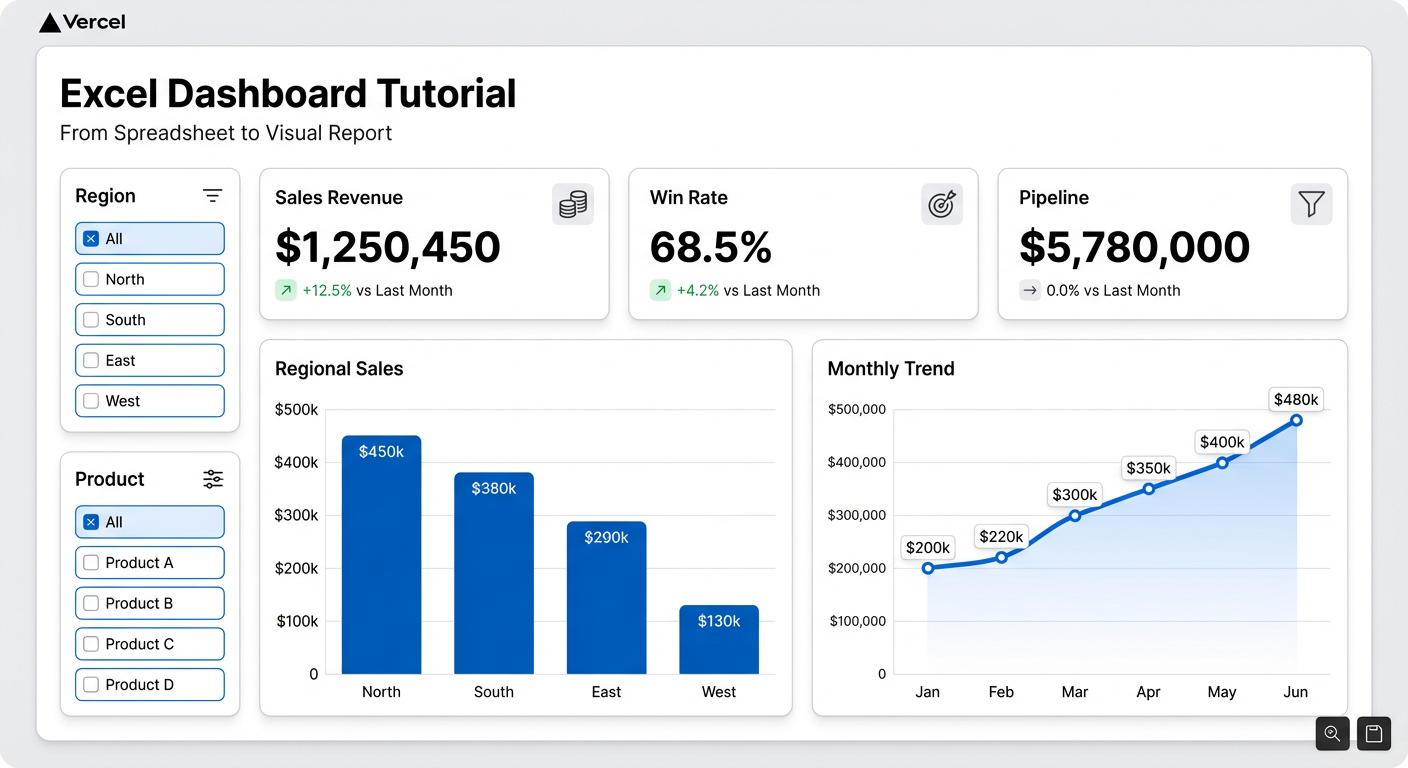
Excel Dashboard Tutorial: From Spreadsheet to Visual Report
Guide
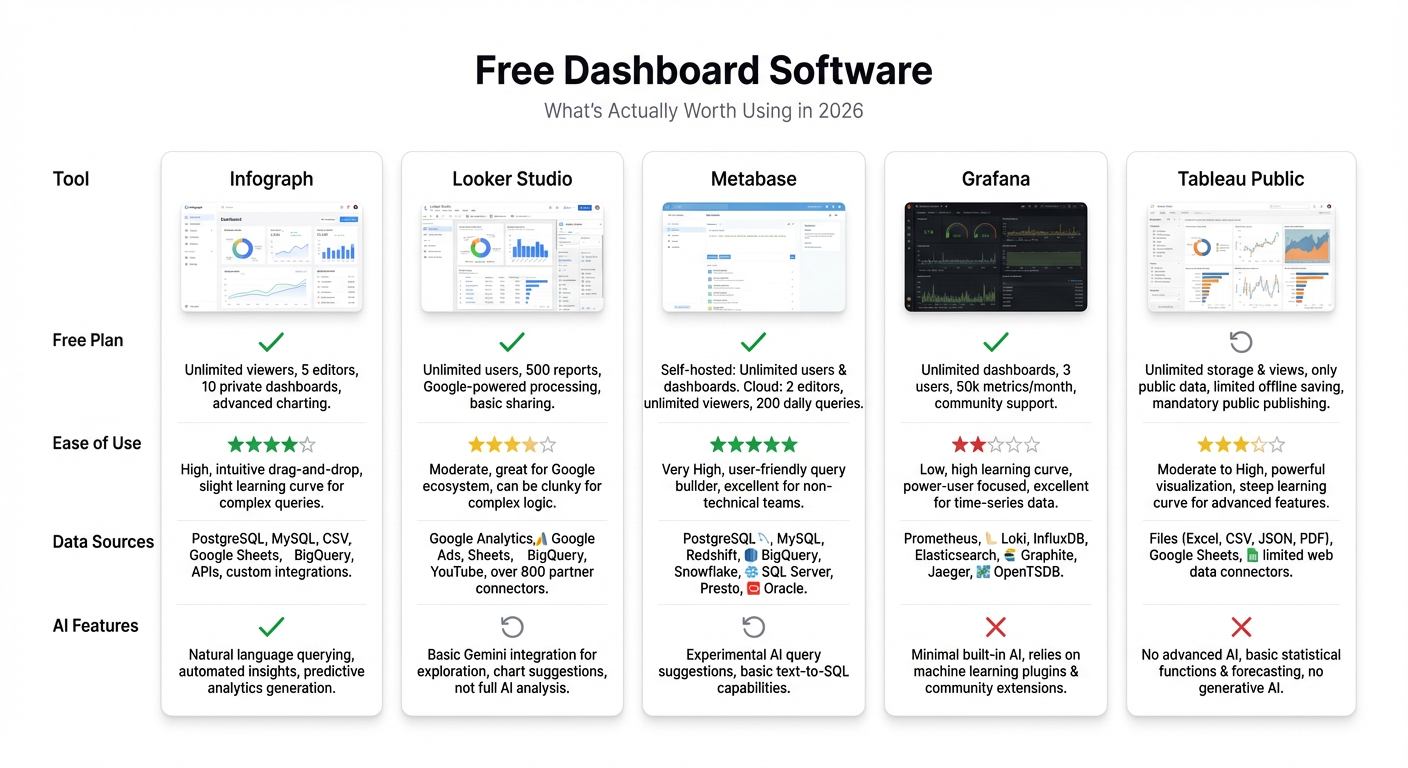
Free Dashboard Software: What's Actually Worth Using in 2026
Guide
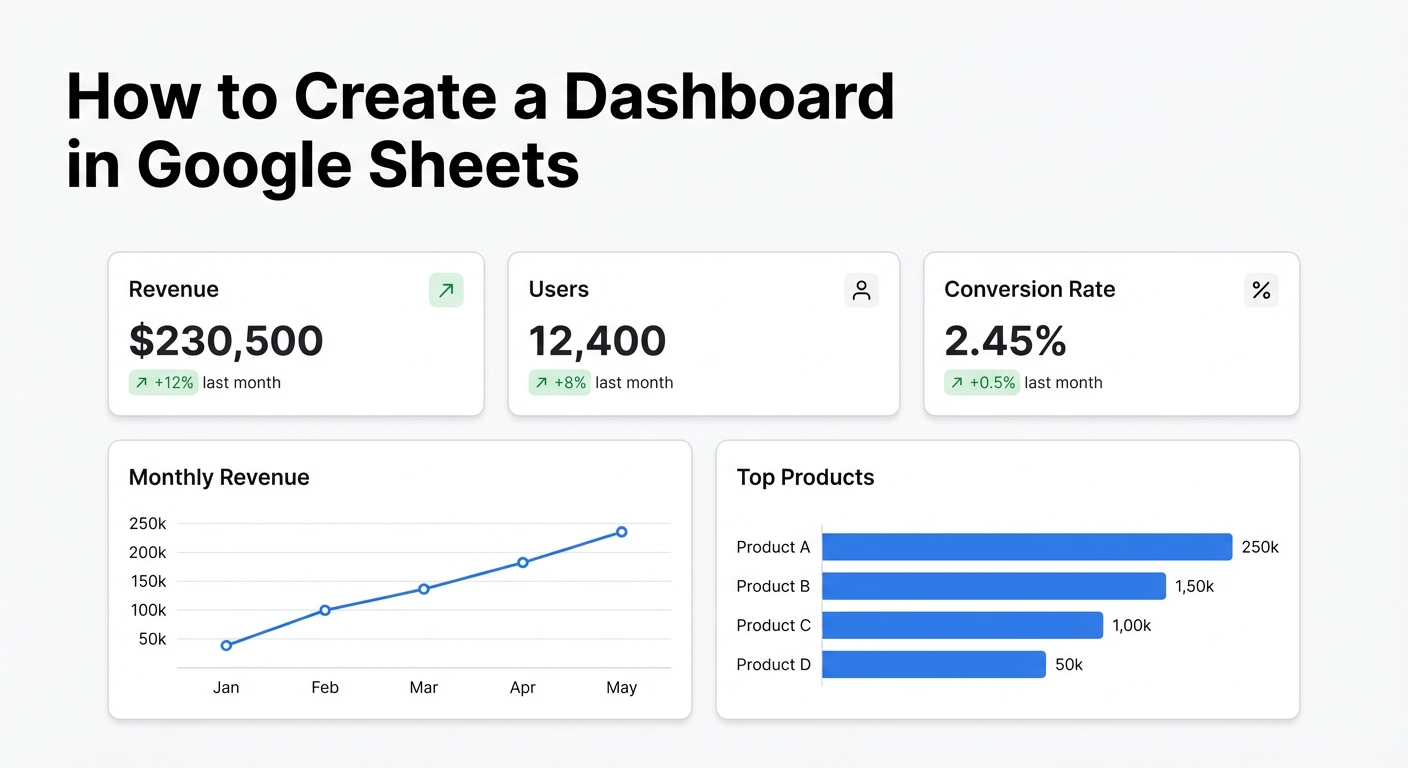
How to Create a Dashboard in Google Sheets
Dashboard
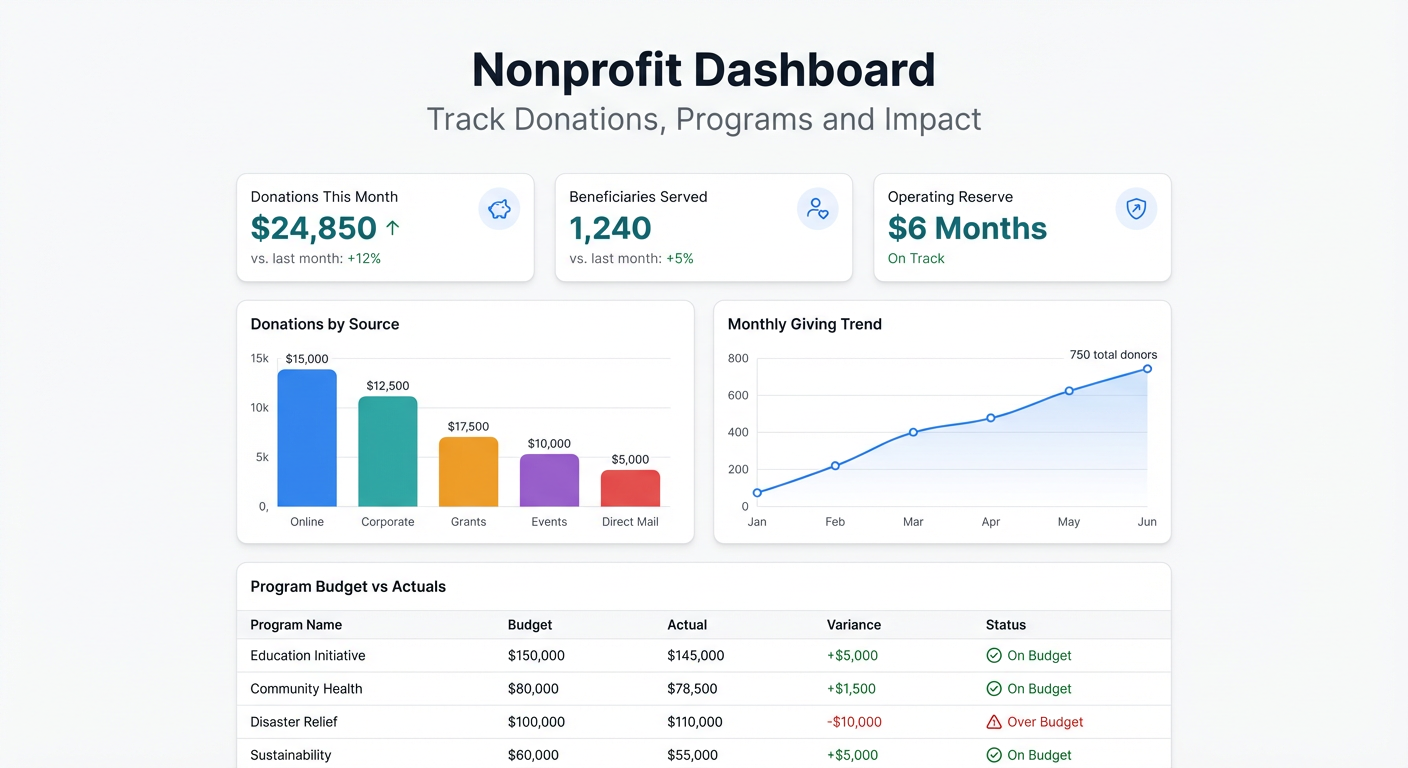
Nonprofit Dashboard: Track Donations, Programs and Impact
Guide
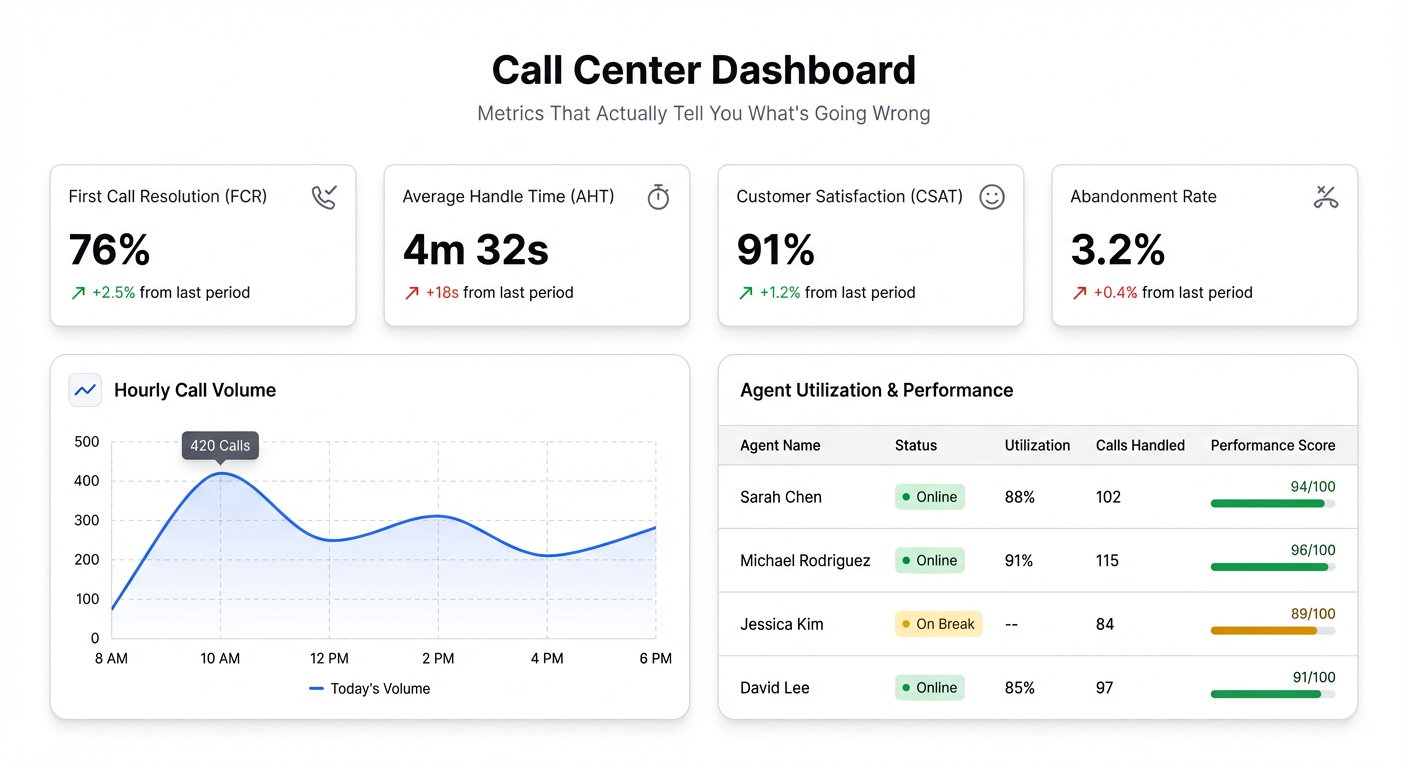
Call Center Dashboard: The Metrics That Actually Tell You What's Going Wrong
Guide
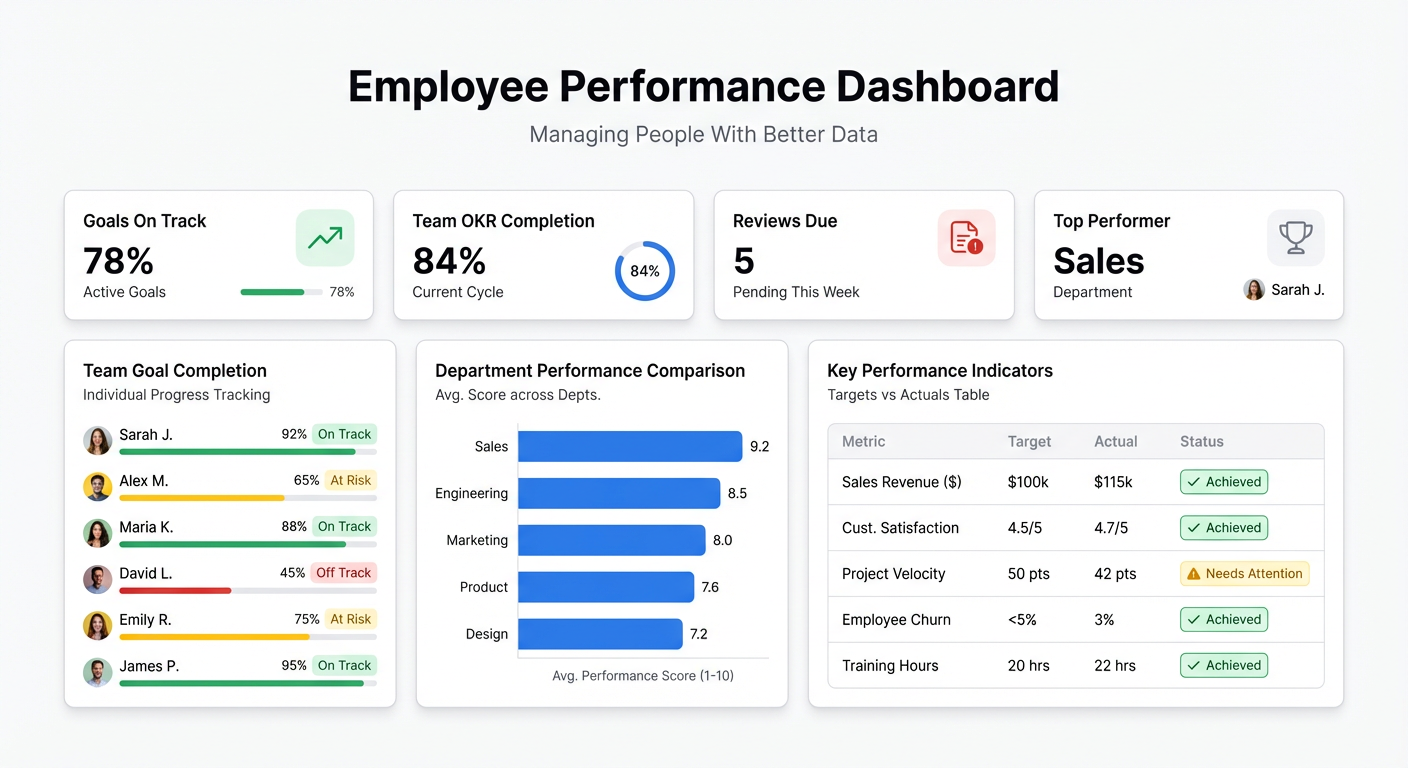
The Employee Performance Dashboard: Managing People With Better Data
Guide
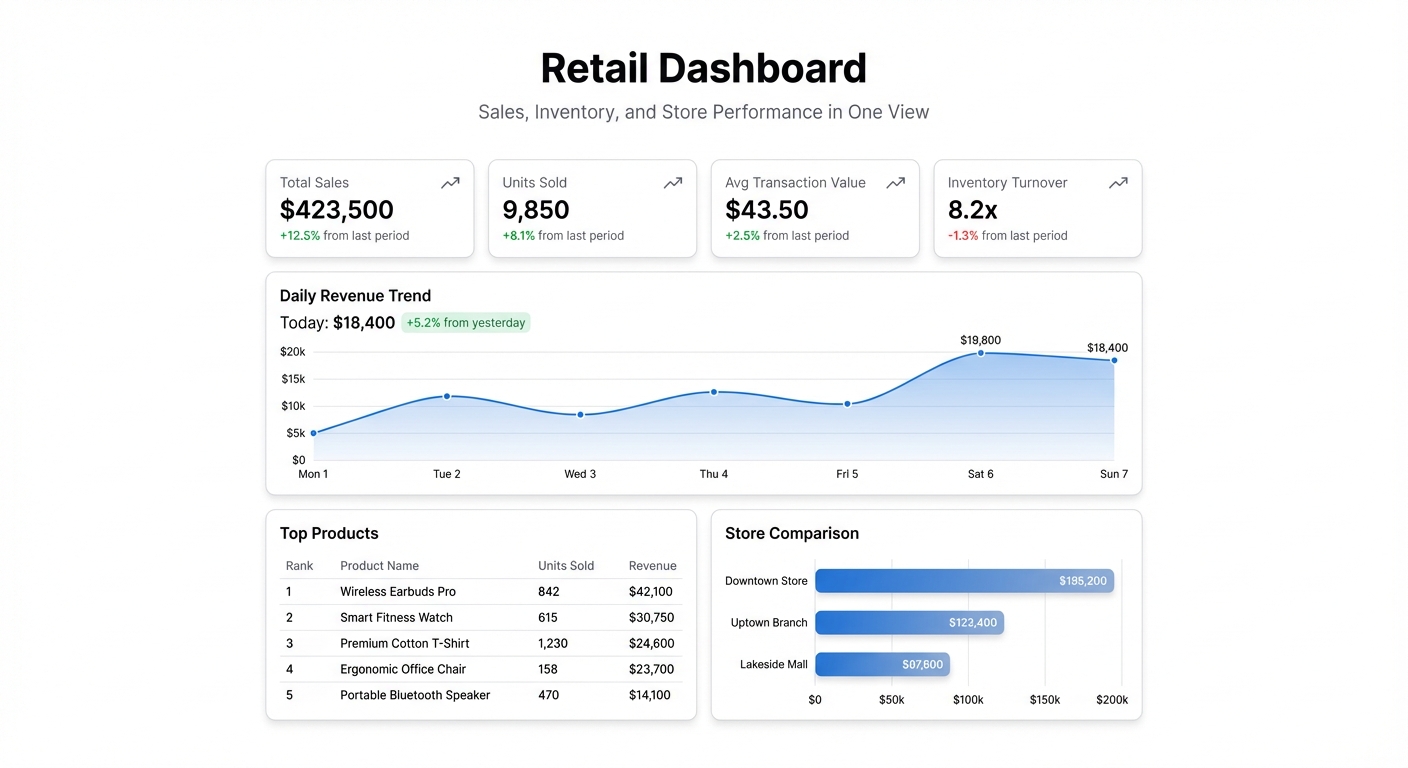
Retail Dashboard: Track Sales, Inventory, and Store Performance in One View
Guide
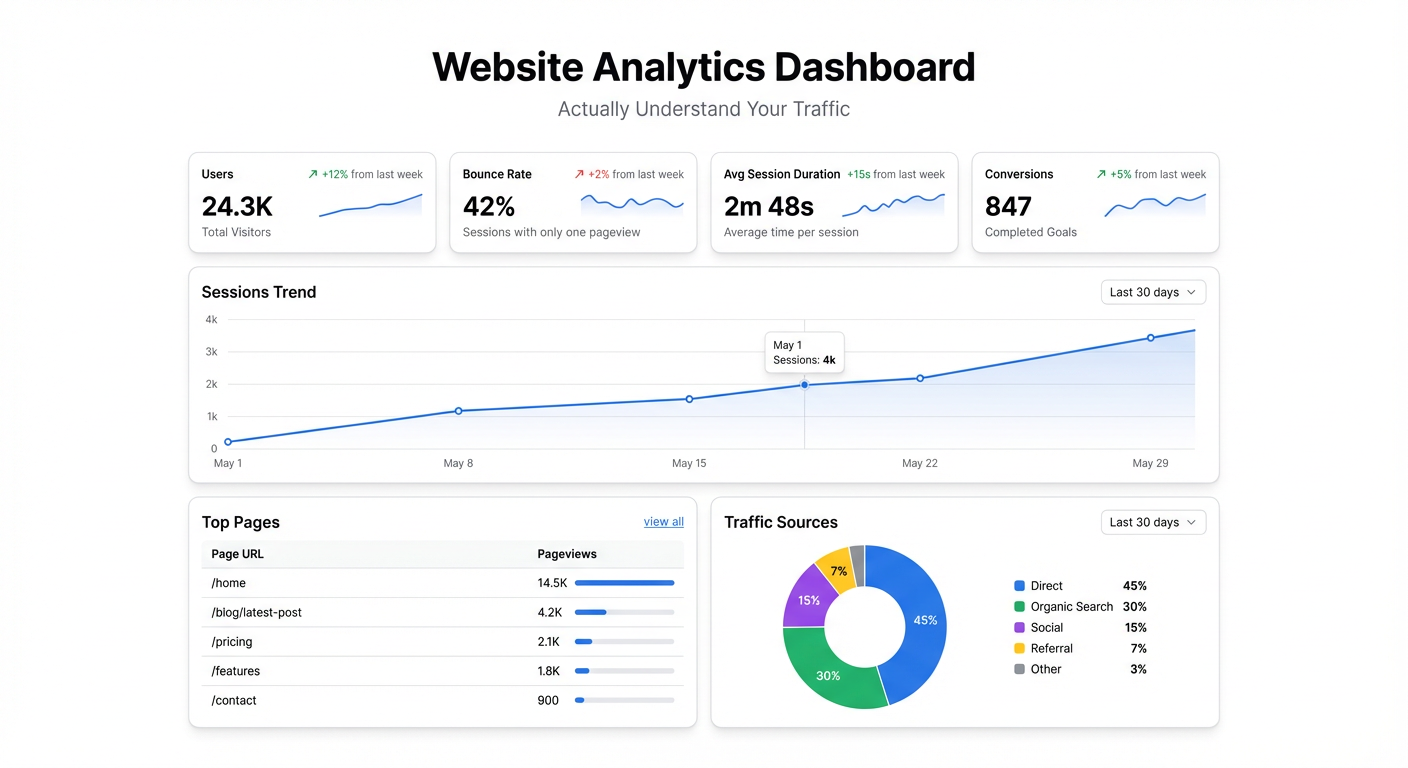
The Website Analytics Dashboard: Actually Understand Your Traffic
Guide
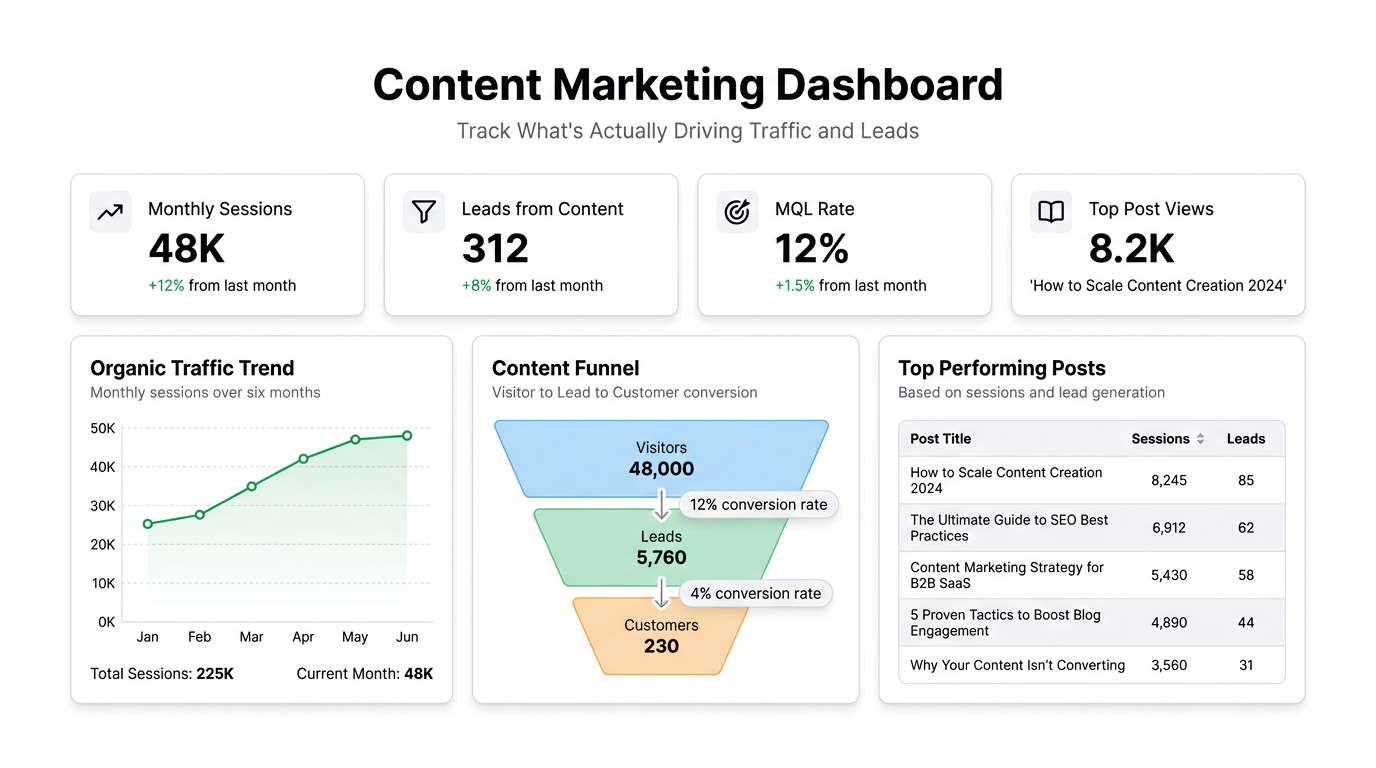
Content Marketing Dashboard: Track What's Actually Driving Traffic and Leads
Guide
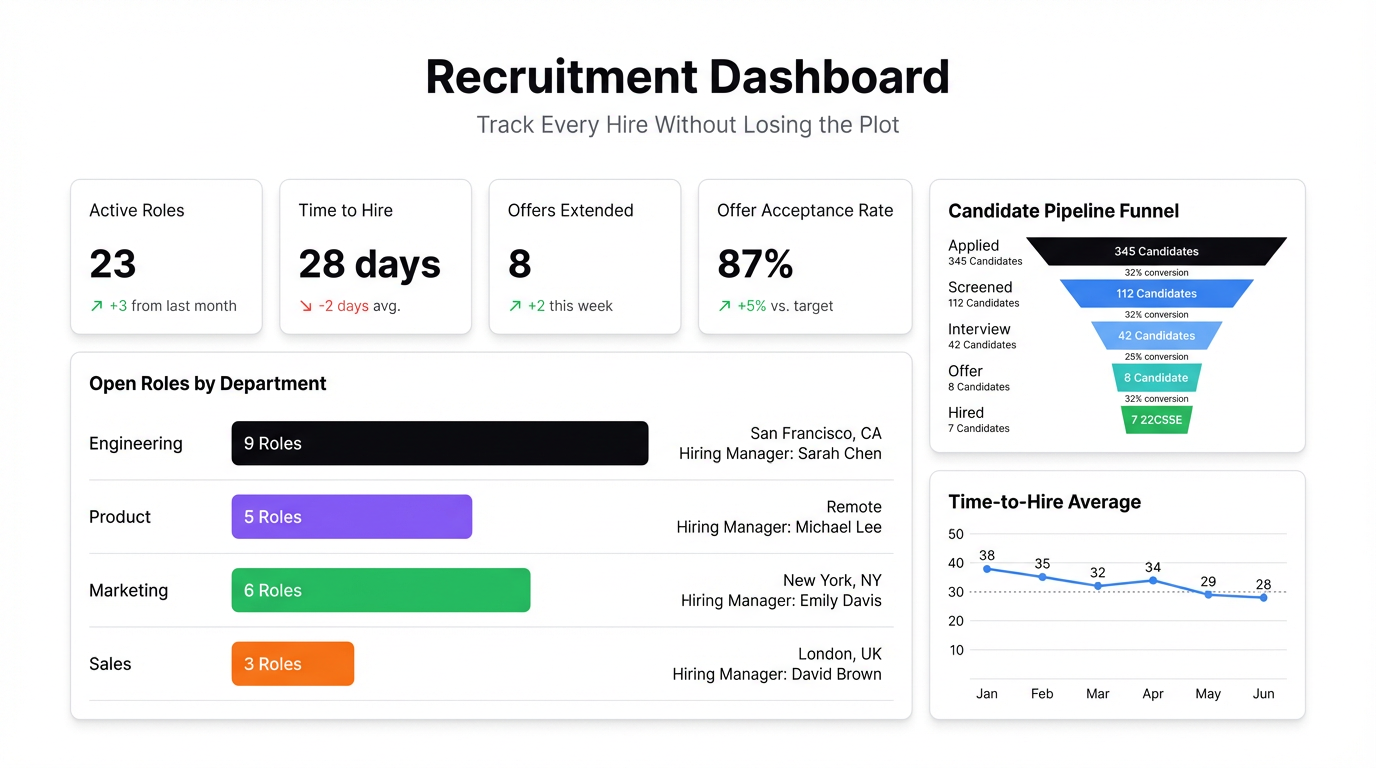
Recruitment Dashboard: Track Every Hire Without Losing the Plot
Guide
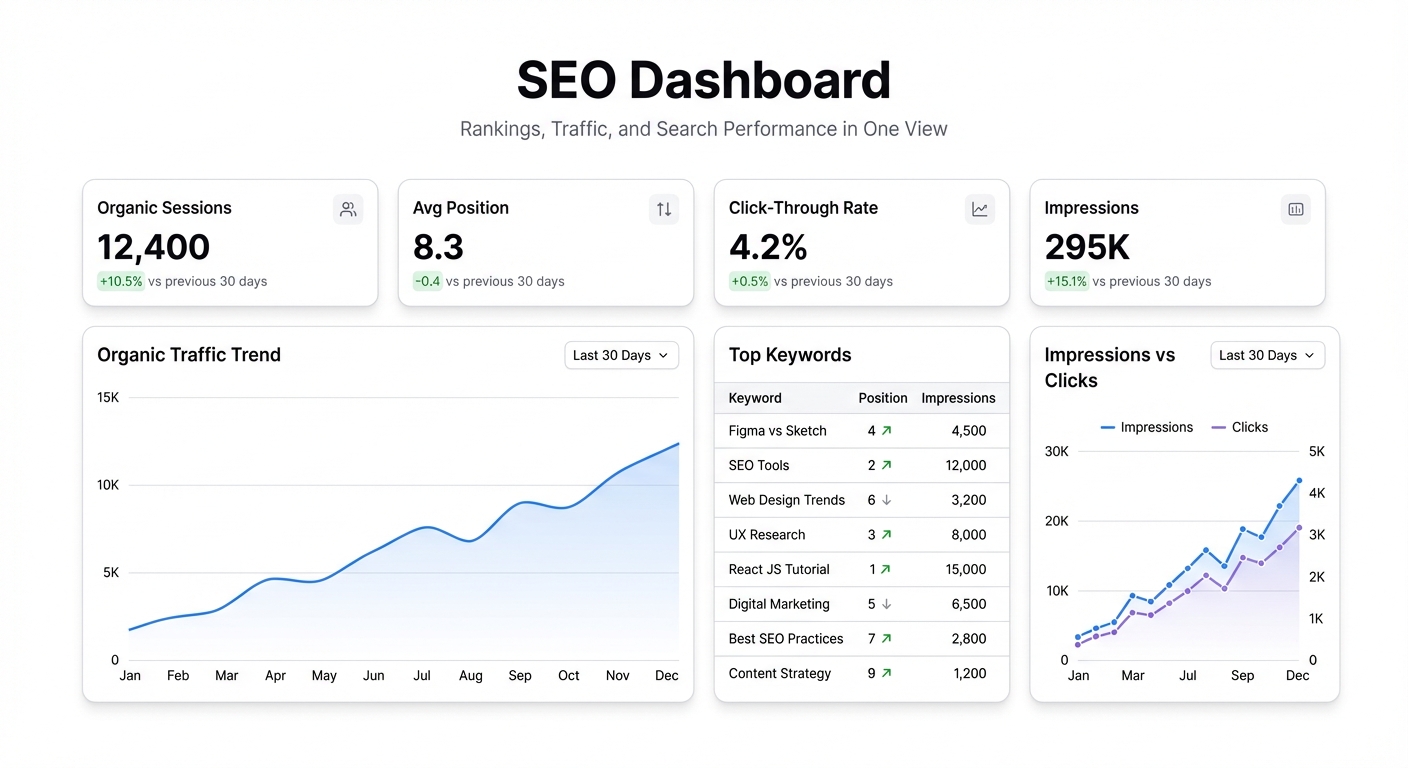
SEO Dashboard: One View for Rankings, Traffic, and Search Performance
Guide
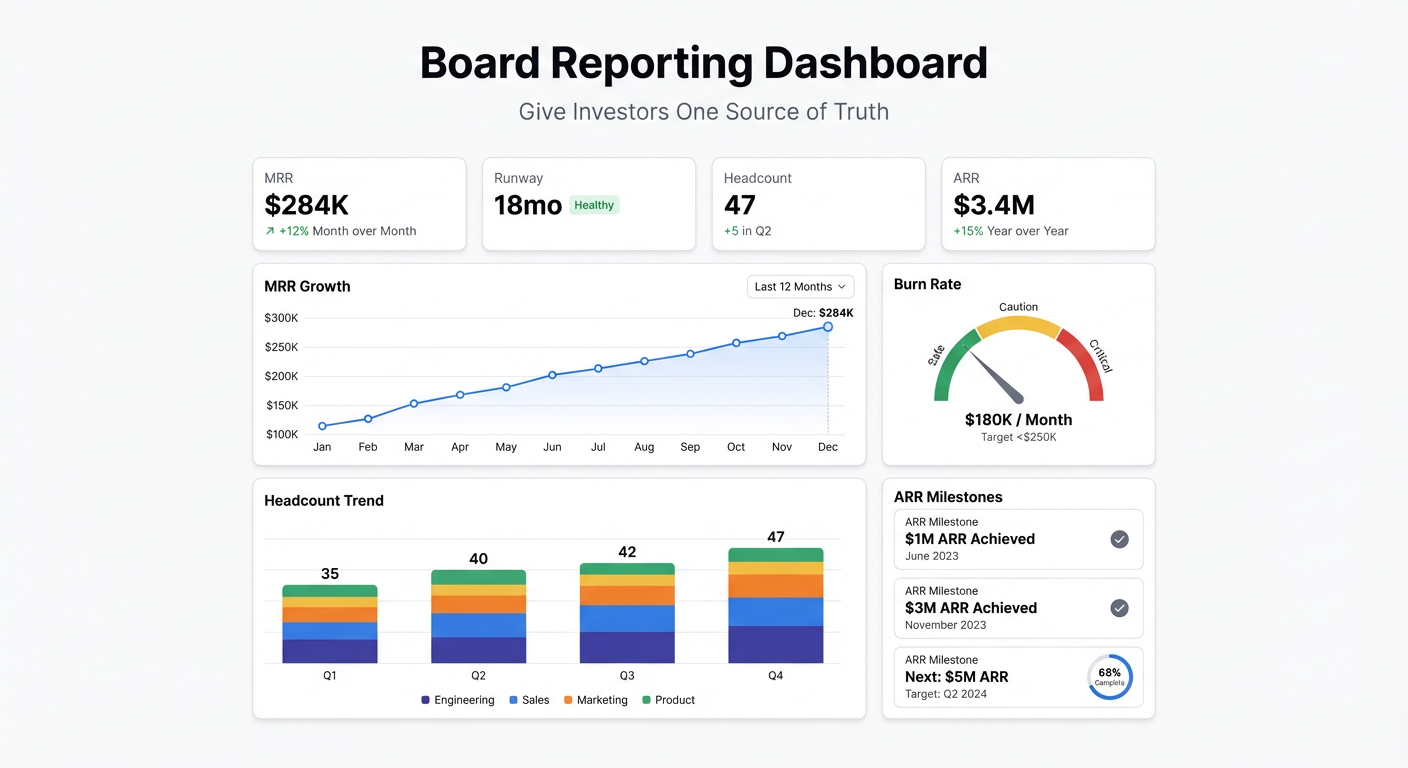
Board Reporting Dashboard: Give Investors One Source of Truth
Guide
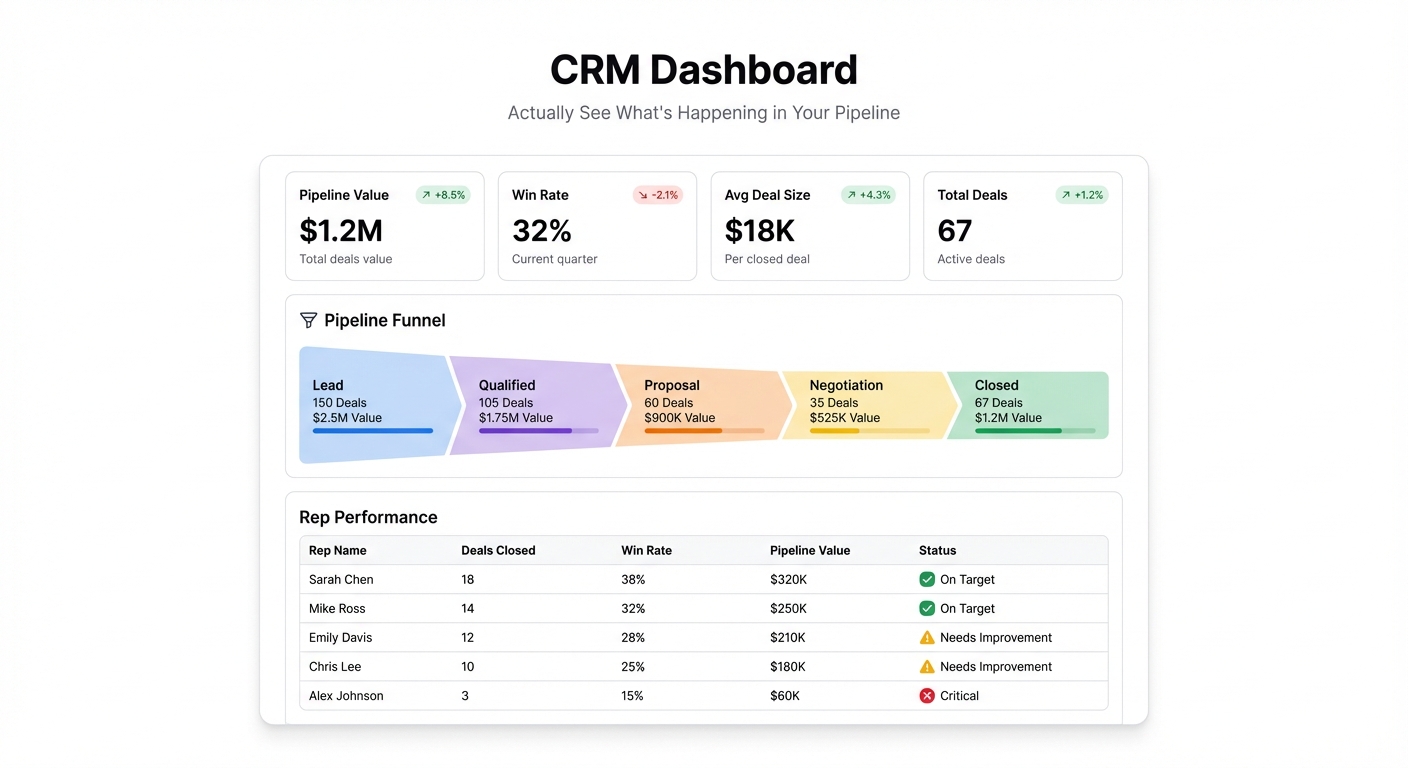
CRM Dashboard: How to Actually See What's Happening in Your Pipeline
Guide
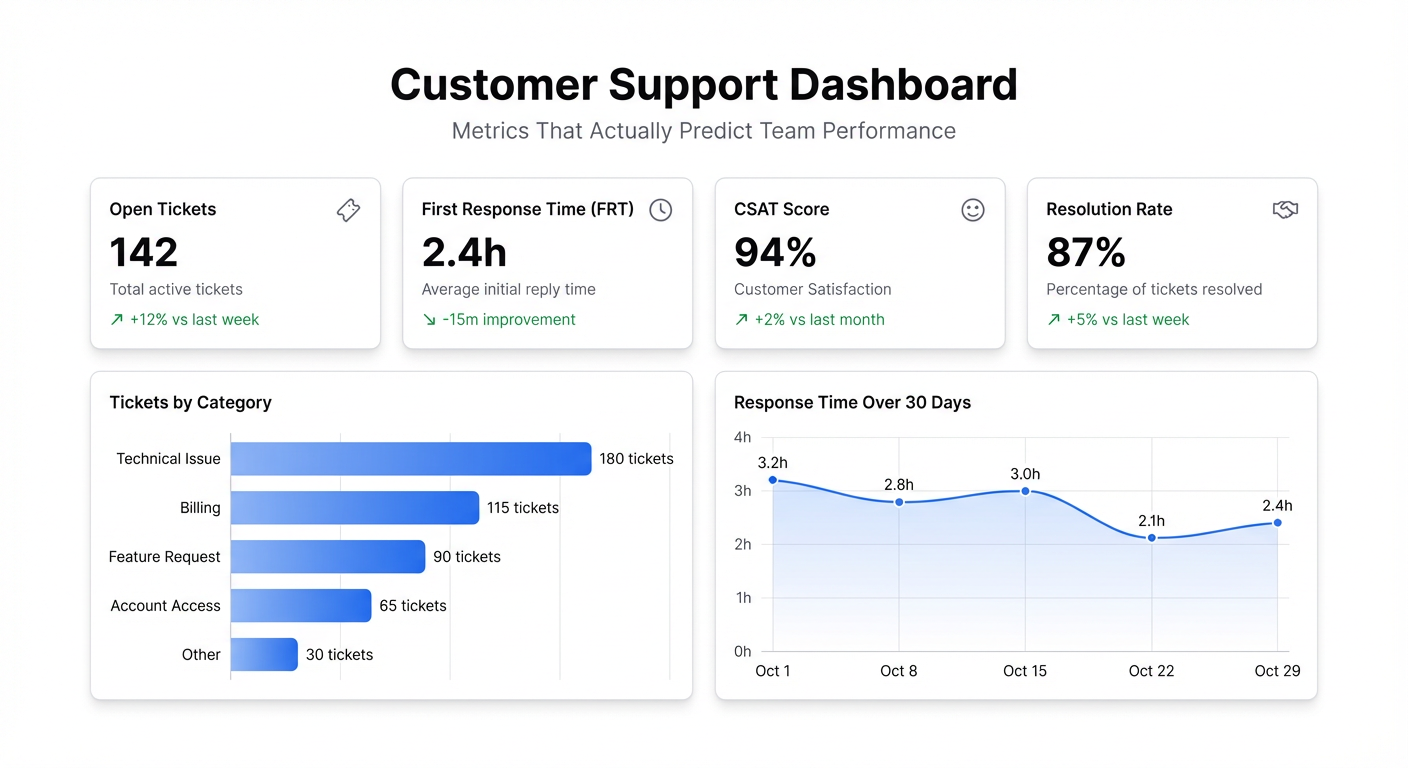
Customer Support Dashboard: The Metrics That Actually Predict Team Performance
Guide
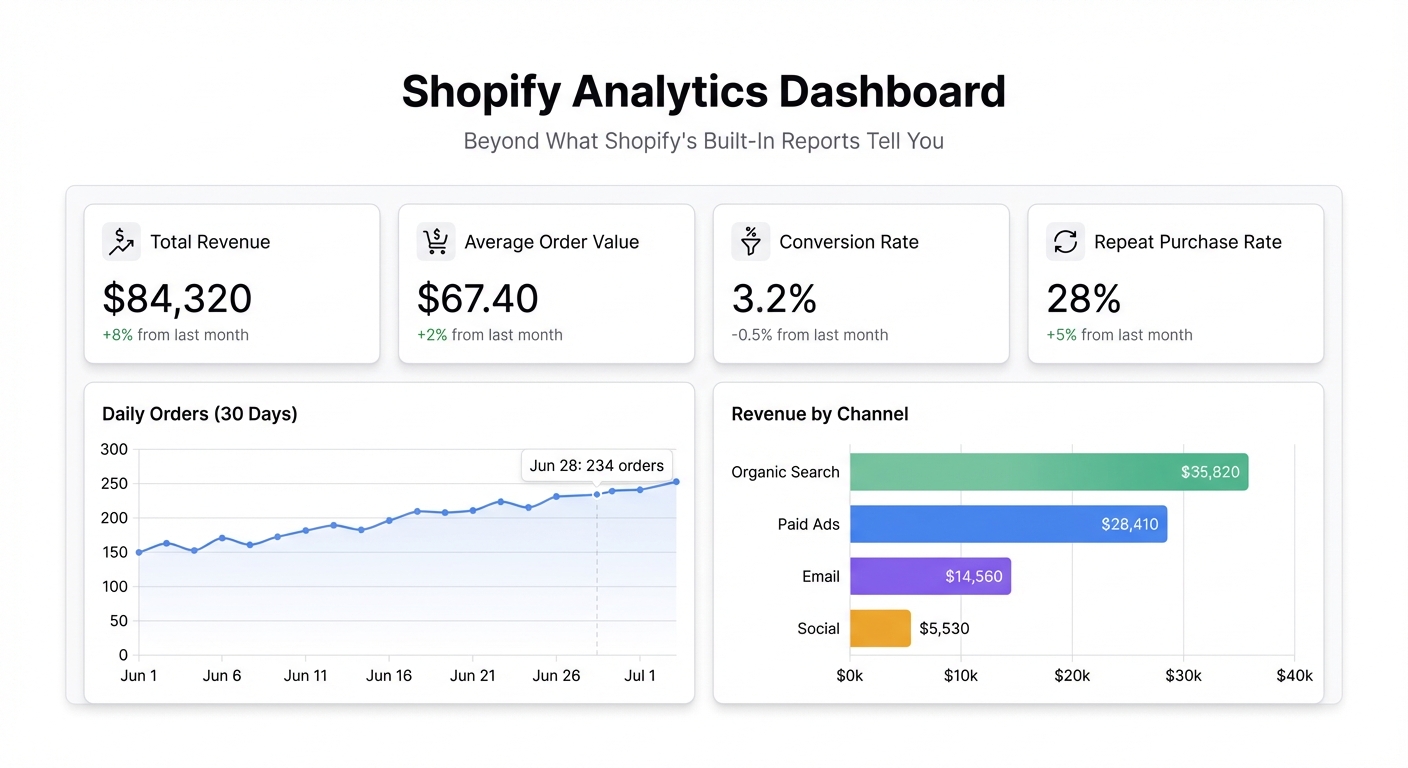
Shopify Analytics Dashboard: See Your Store's Real Numbers
Guide
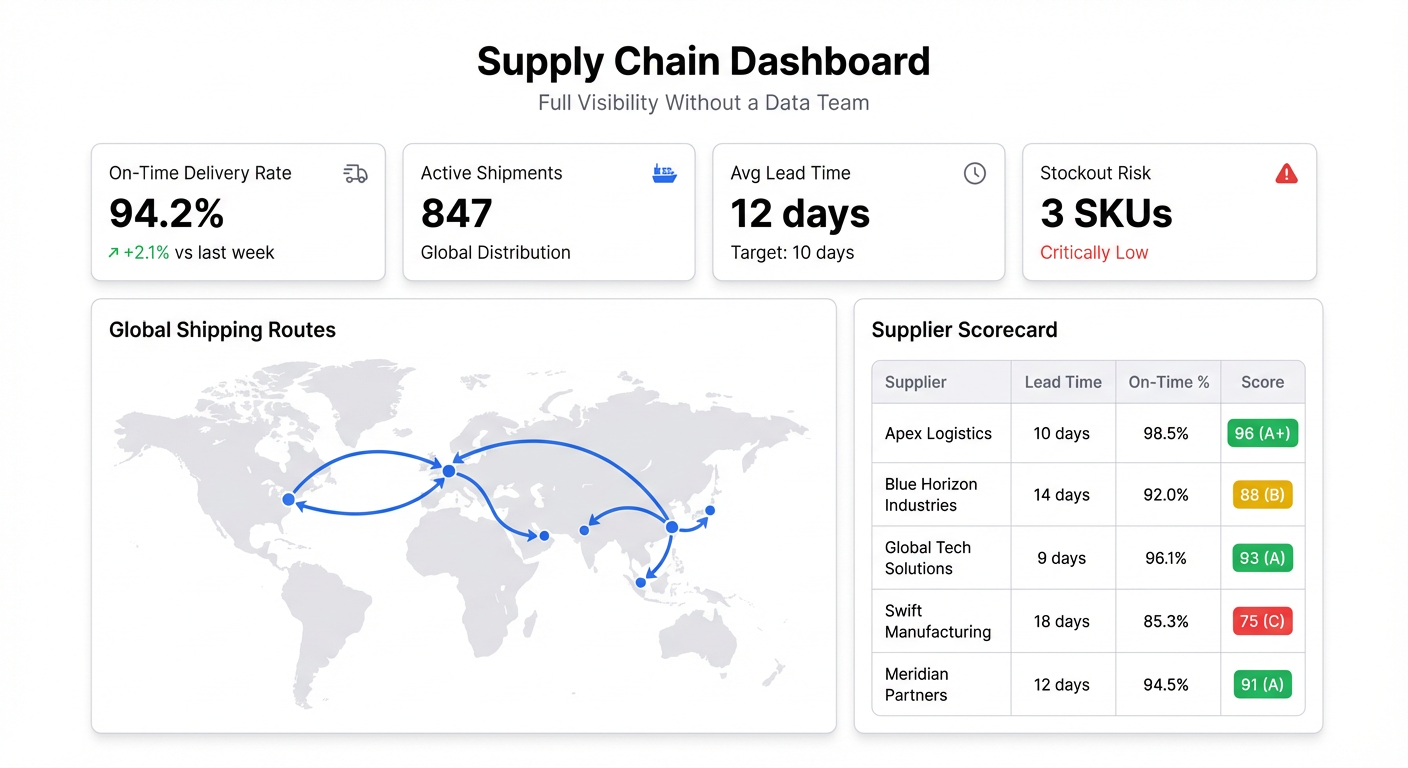
Supply Chain Dashboard: Get Full Visibility Without a Data Team
Guide
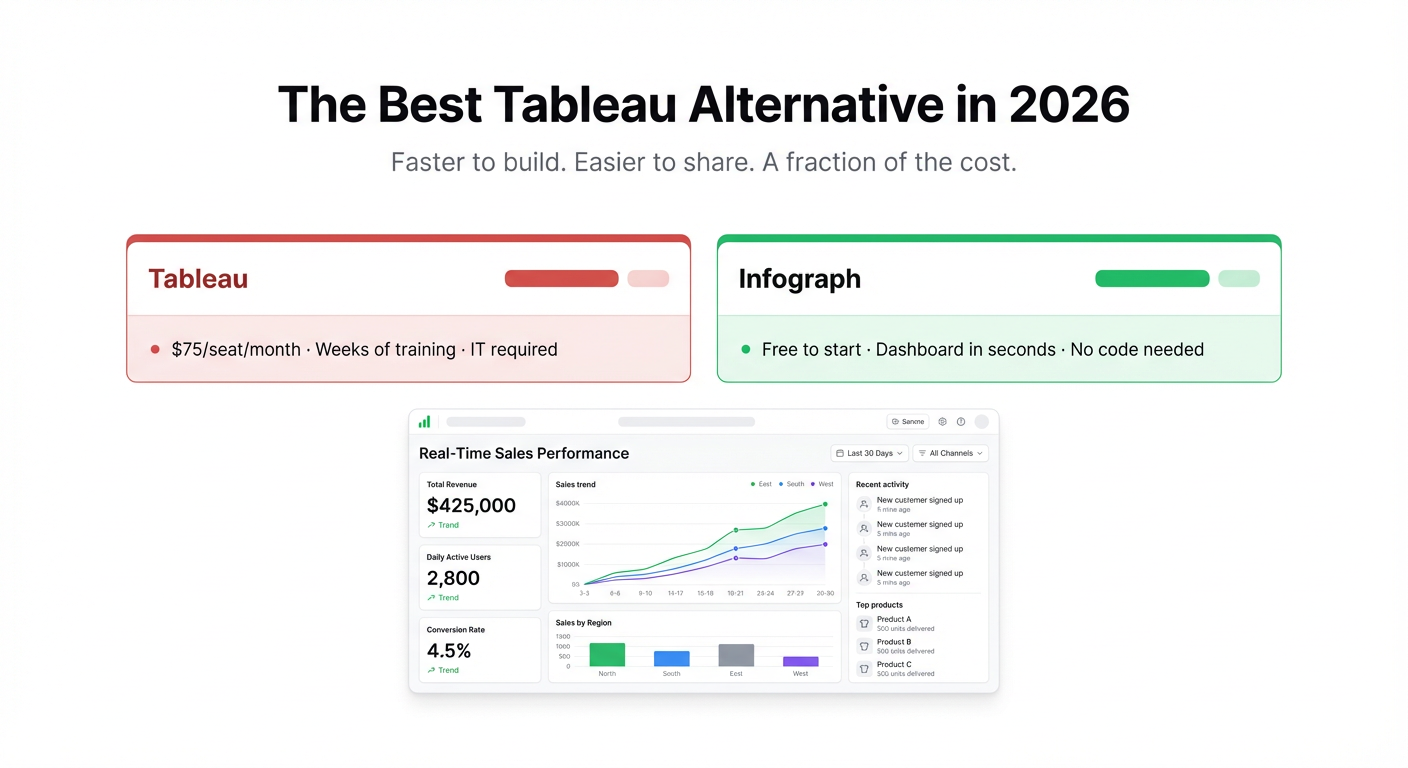
The Best Tableau Alternative in 2026
Guide
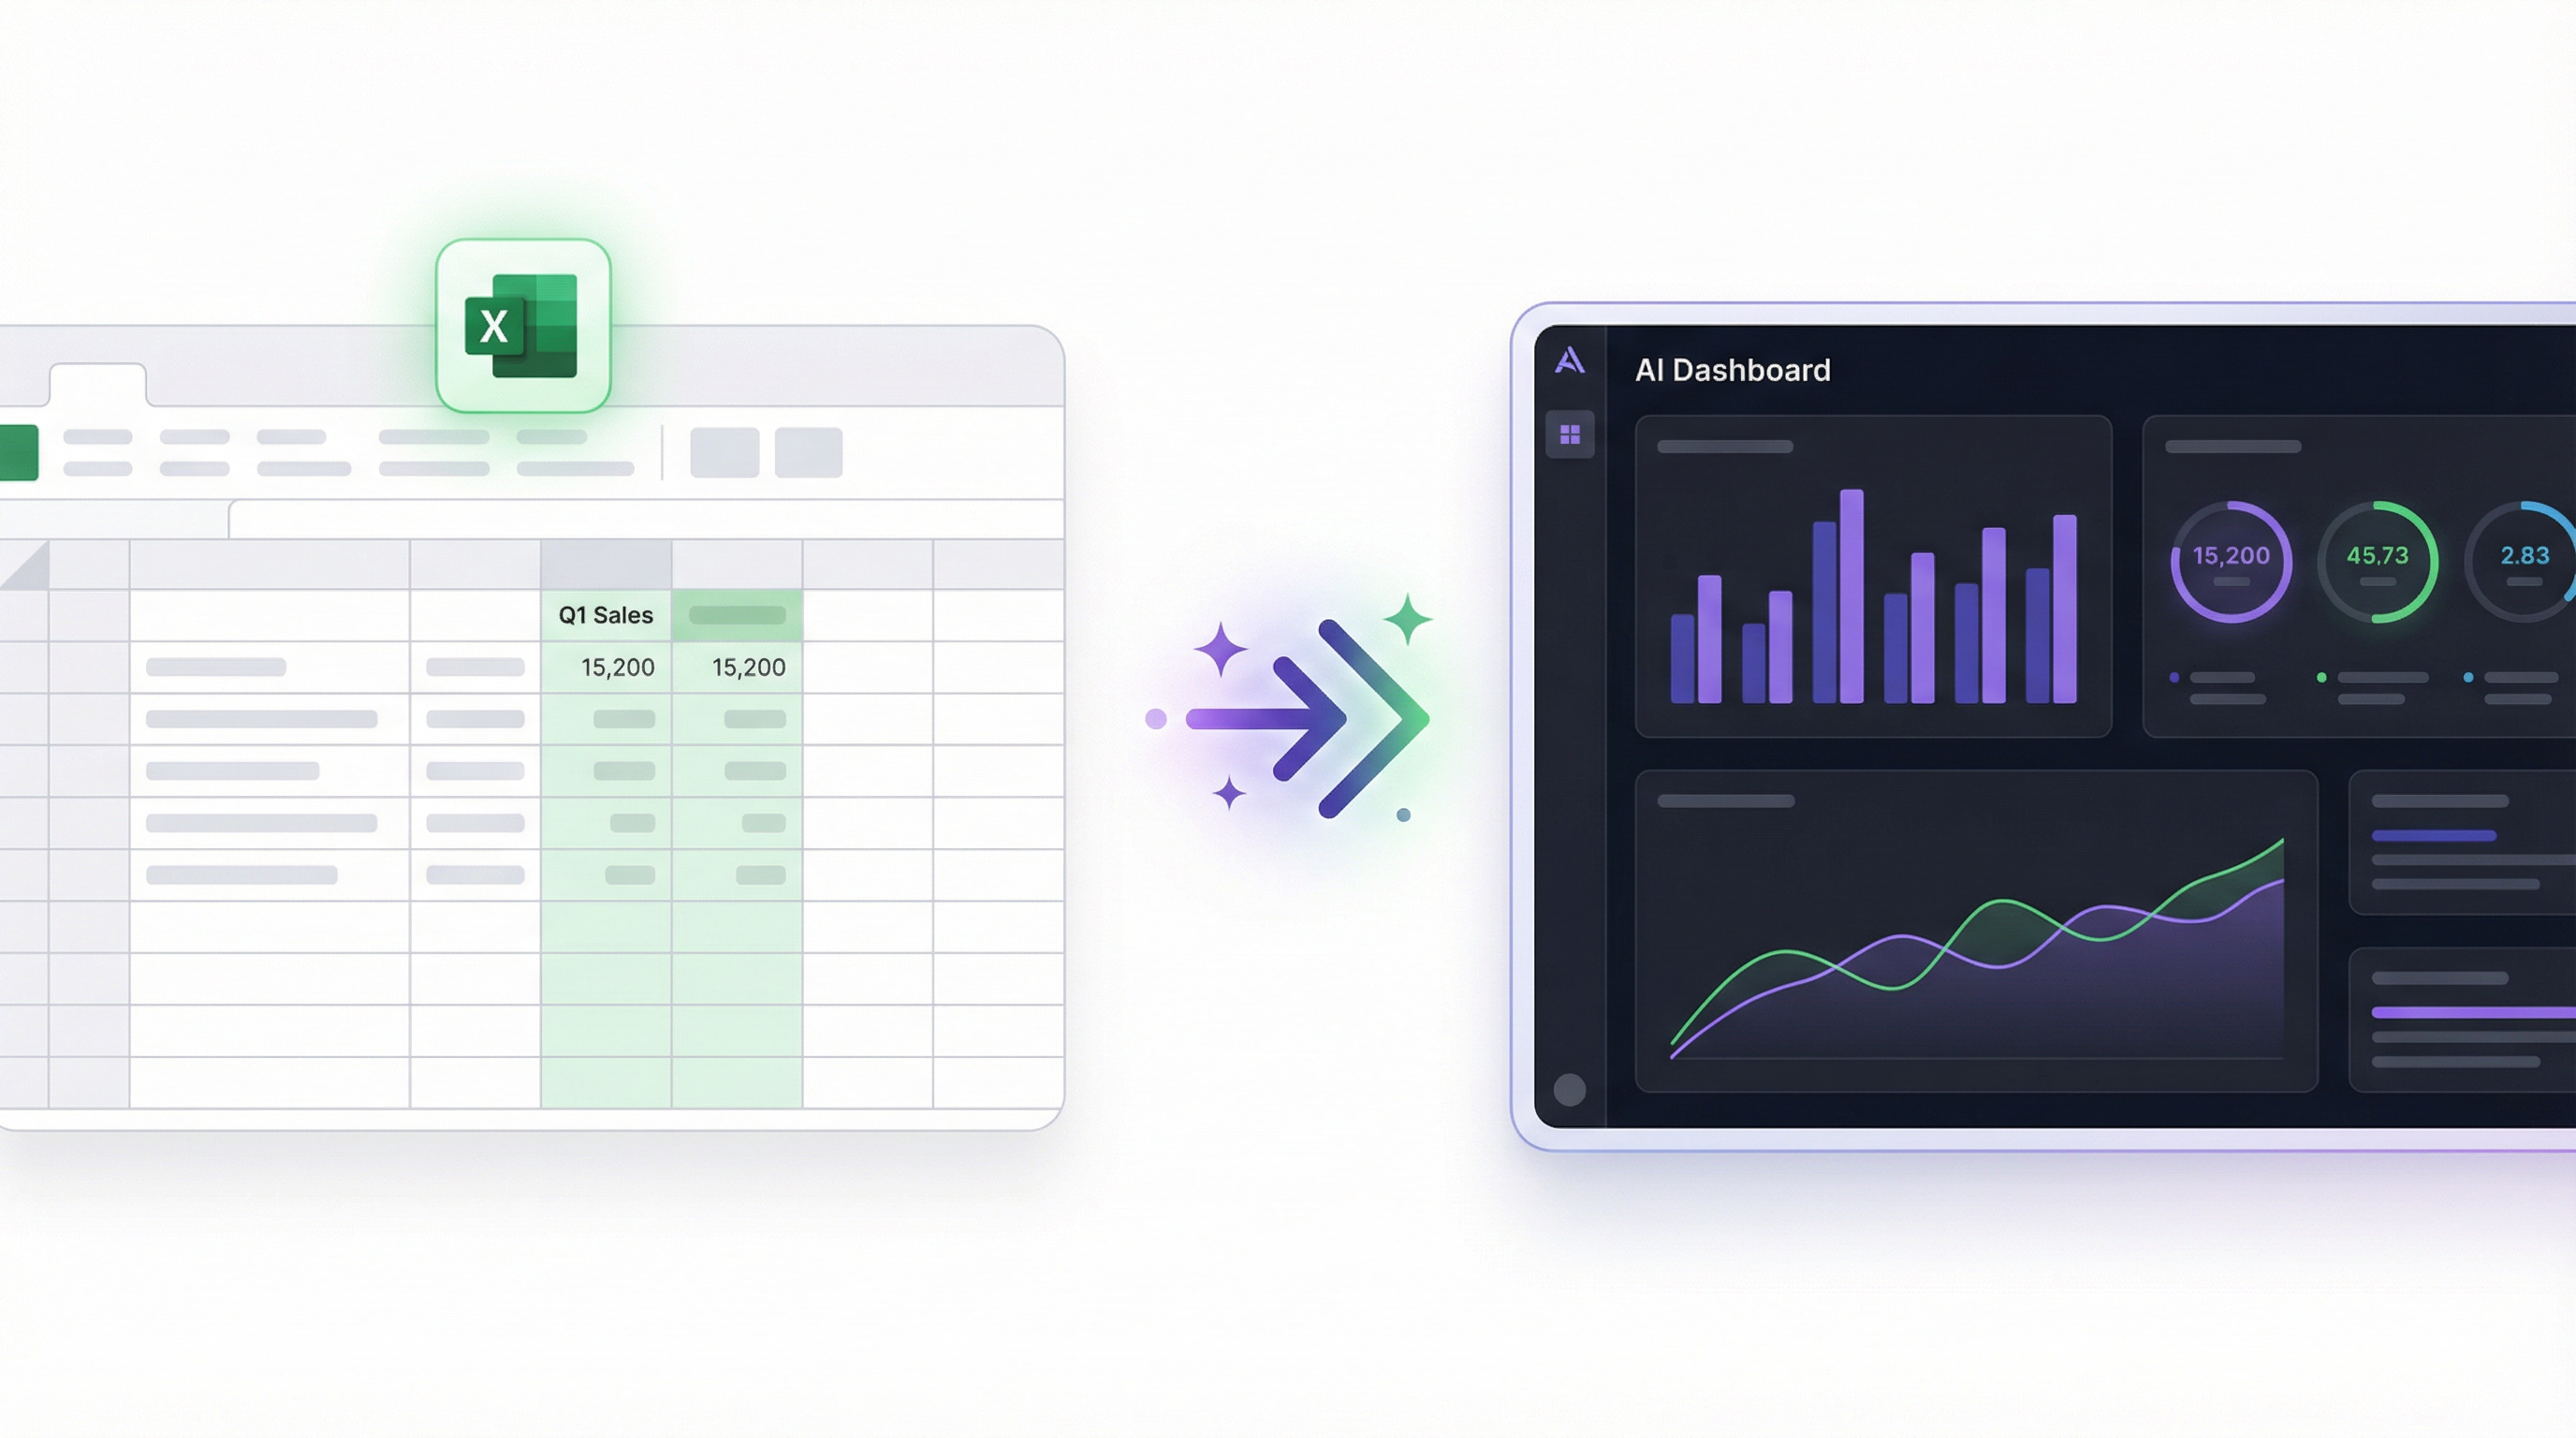
How to Create an AI Dashboard from Excel Data
Guide
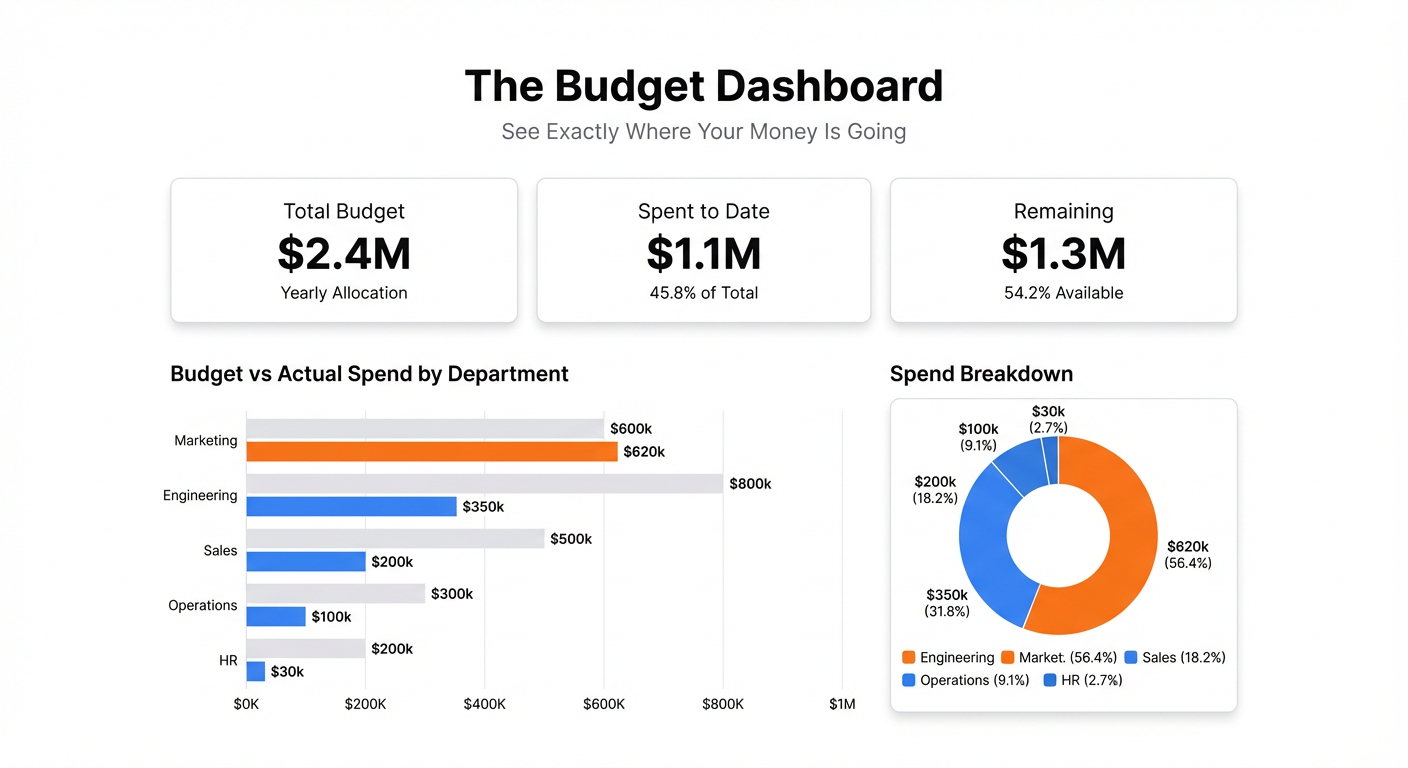
The Budget Dashboard: See Exactly Where Your Money Is Going
Guide
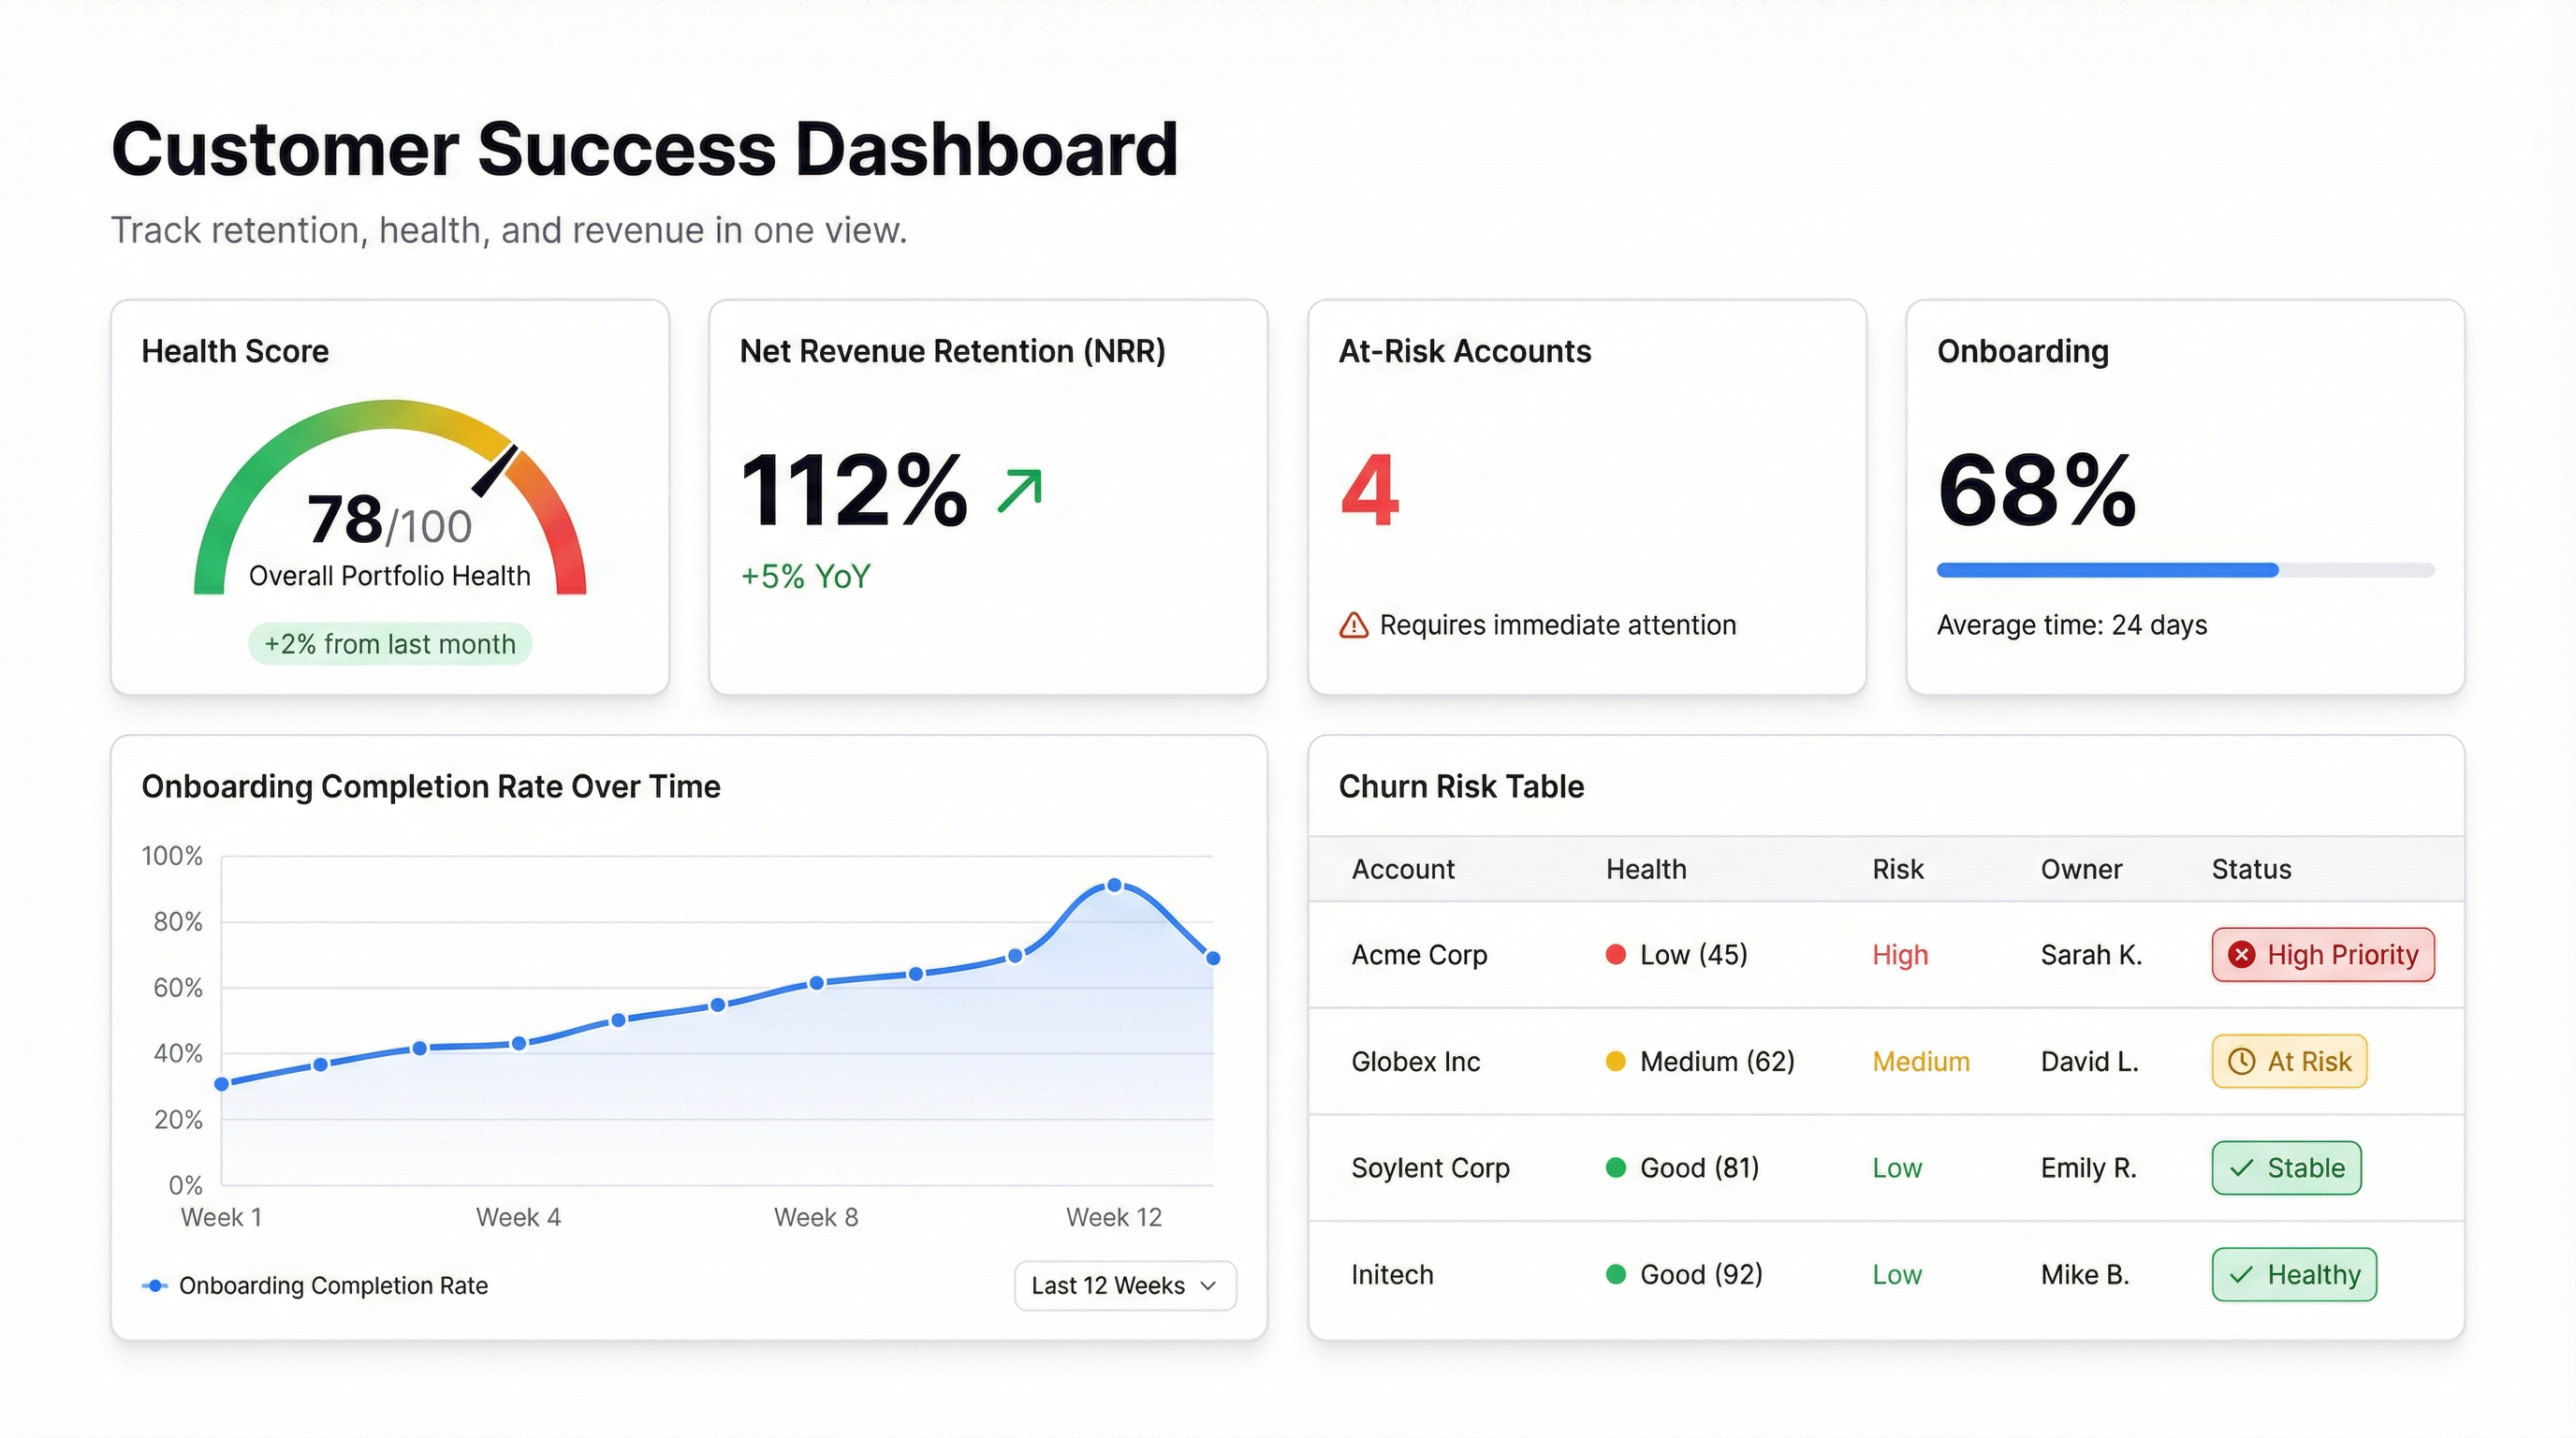
Customer Success Dashboard: Track Retention, Health, and Revenue in One View
Guide
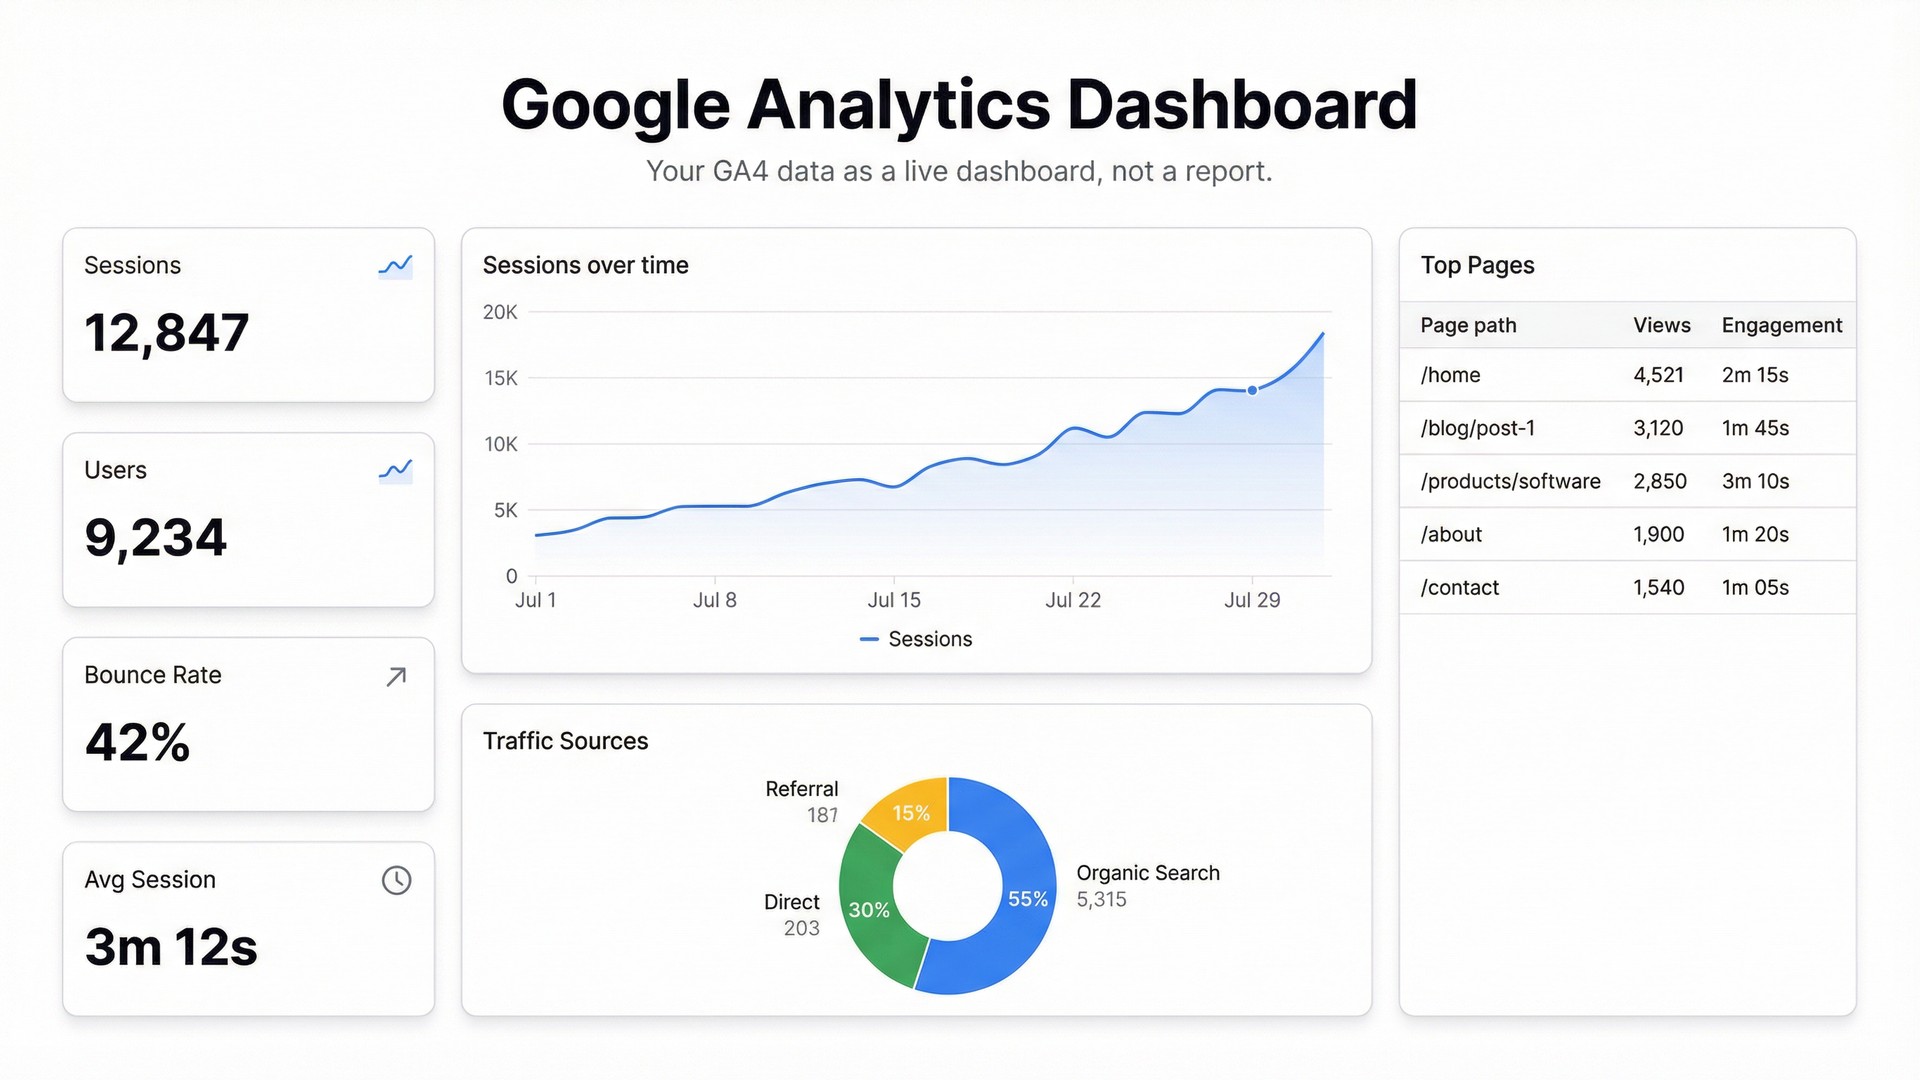
How to Turn Your Google Analytics Data into a Live Dashboard
Guide
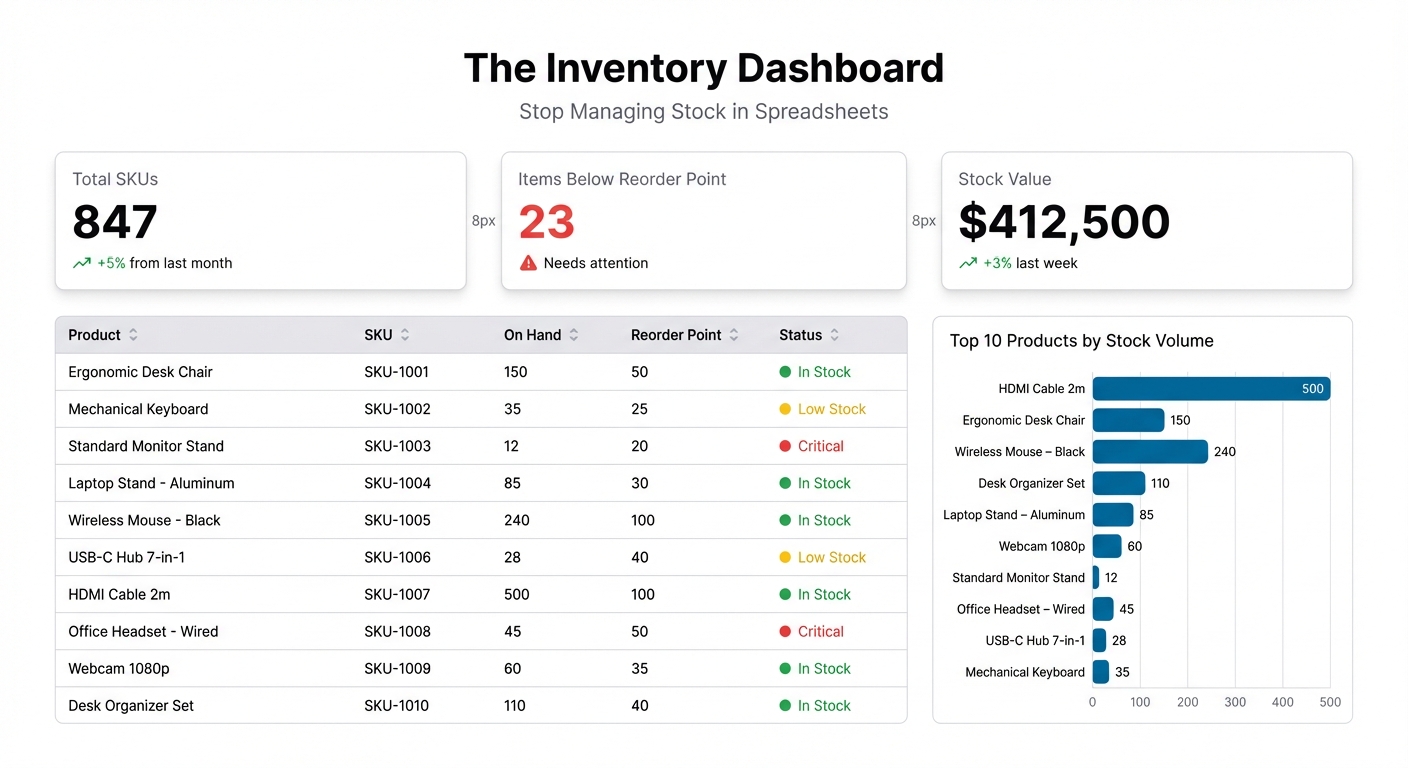
The Inventory Dashboard: Stop Managing Stock in Spreadsheets
Guide
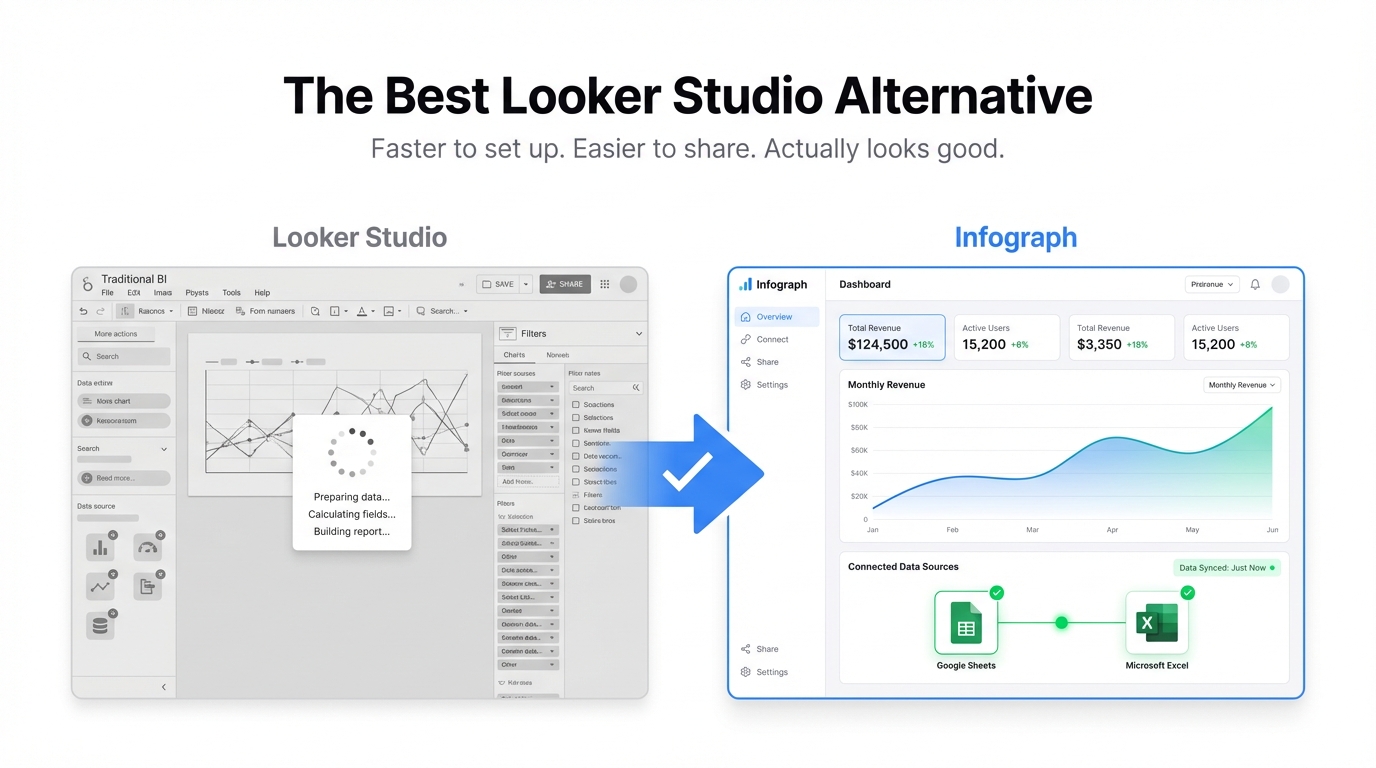
The Best Looker Studio Alternative in 2026
Guide
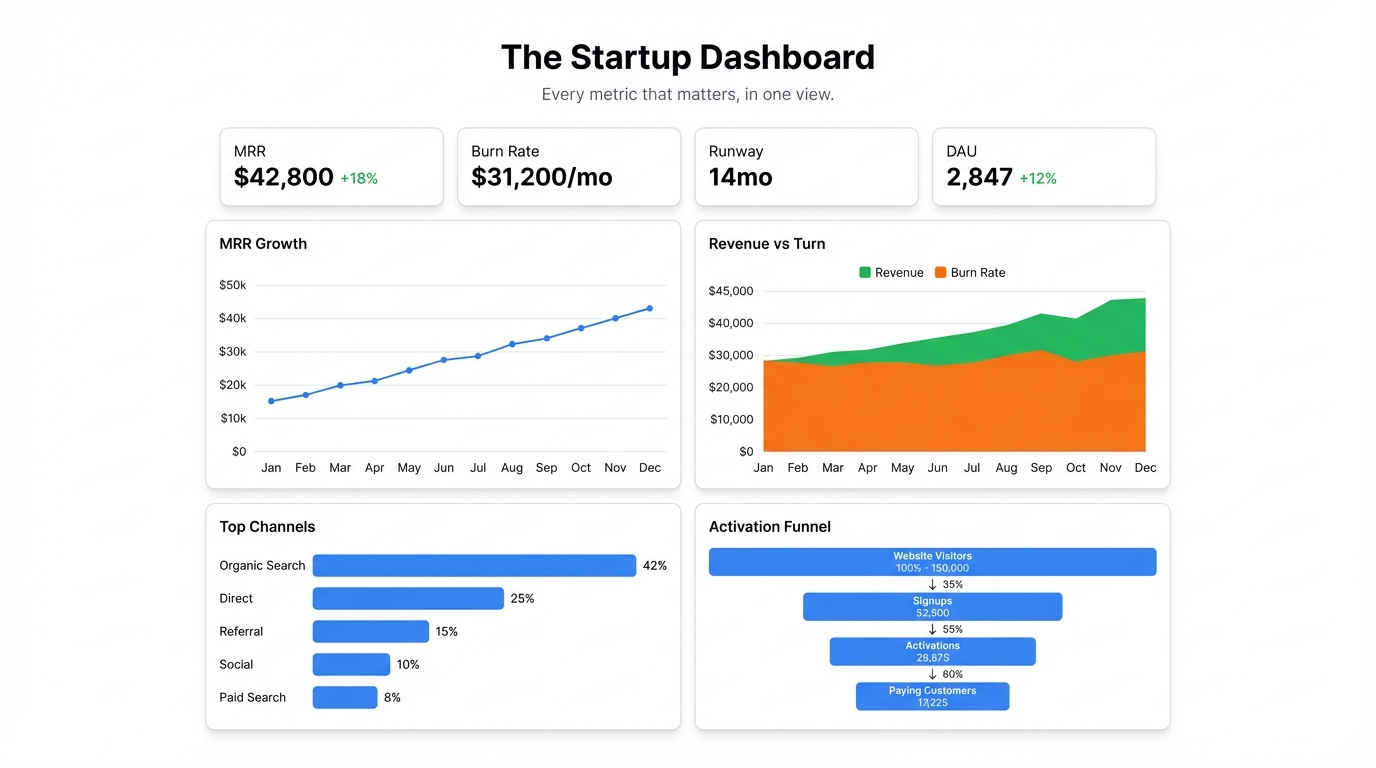
The Startup Dashboard: One View of Every Metric That Matters
Guide
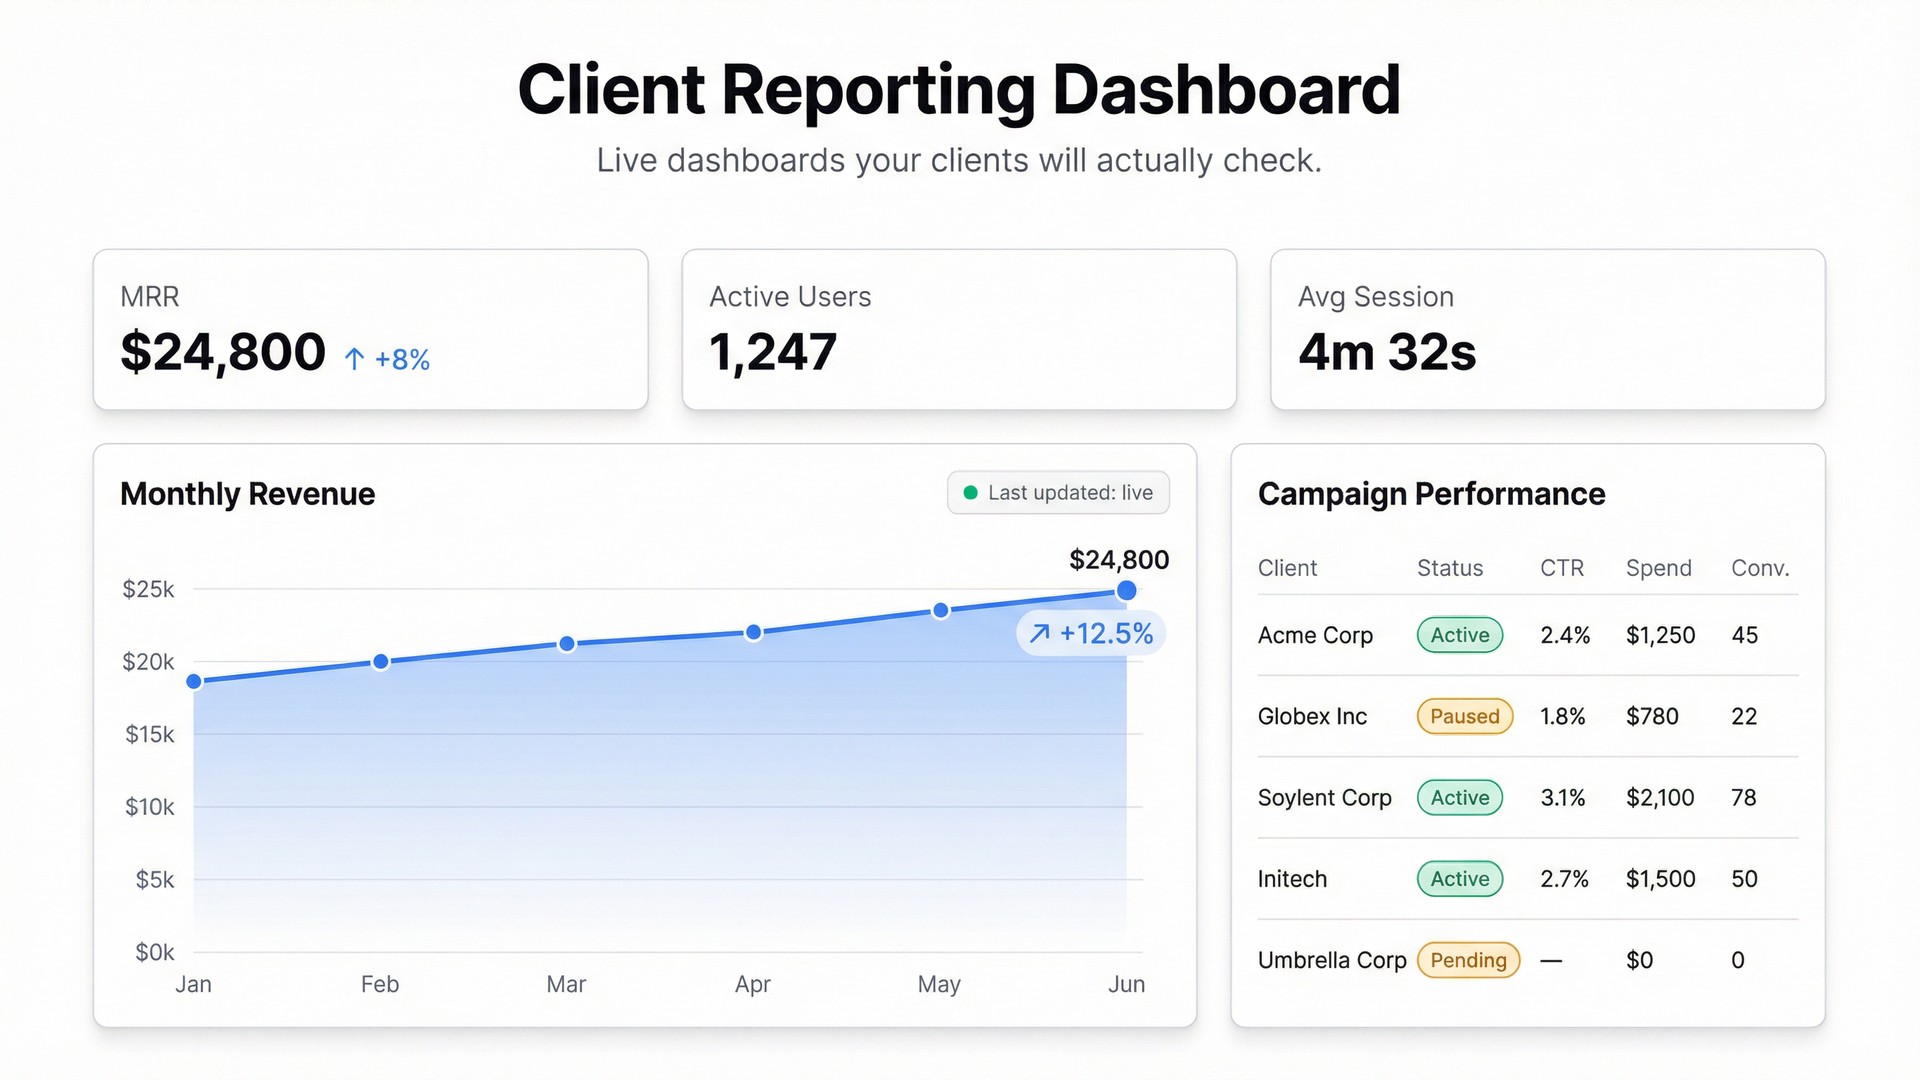
Client Reporting Dashboards: Build a Live Dashboard Your Clients Will Actually Check
Guide
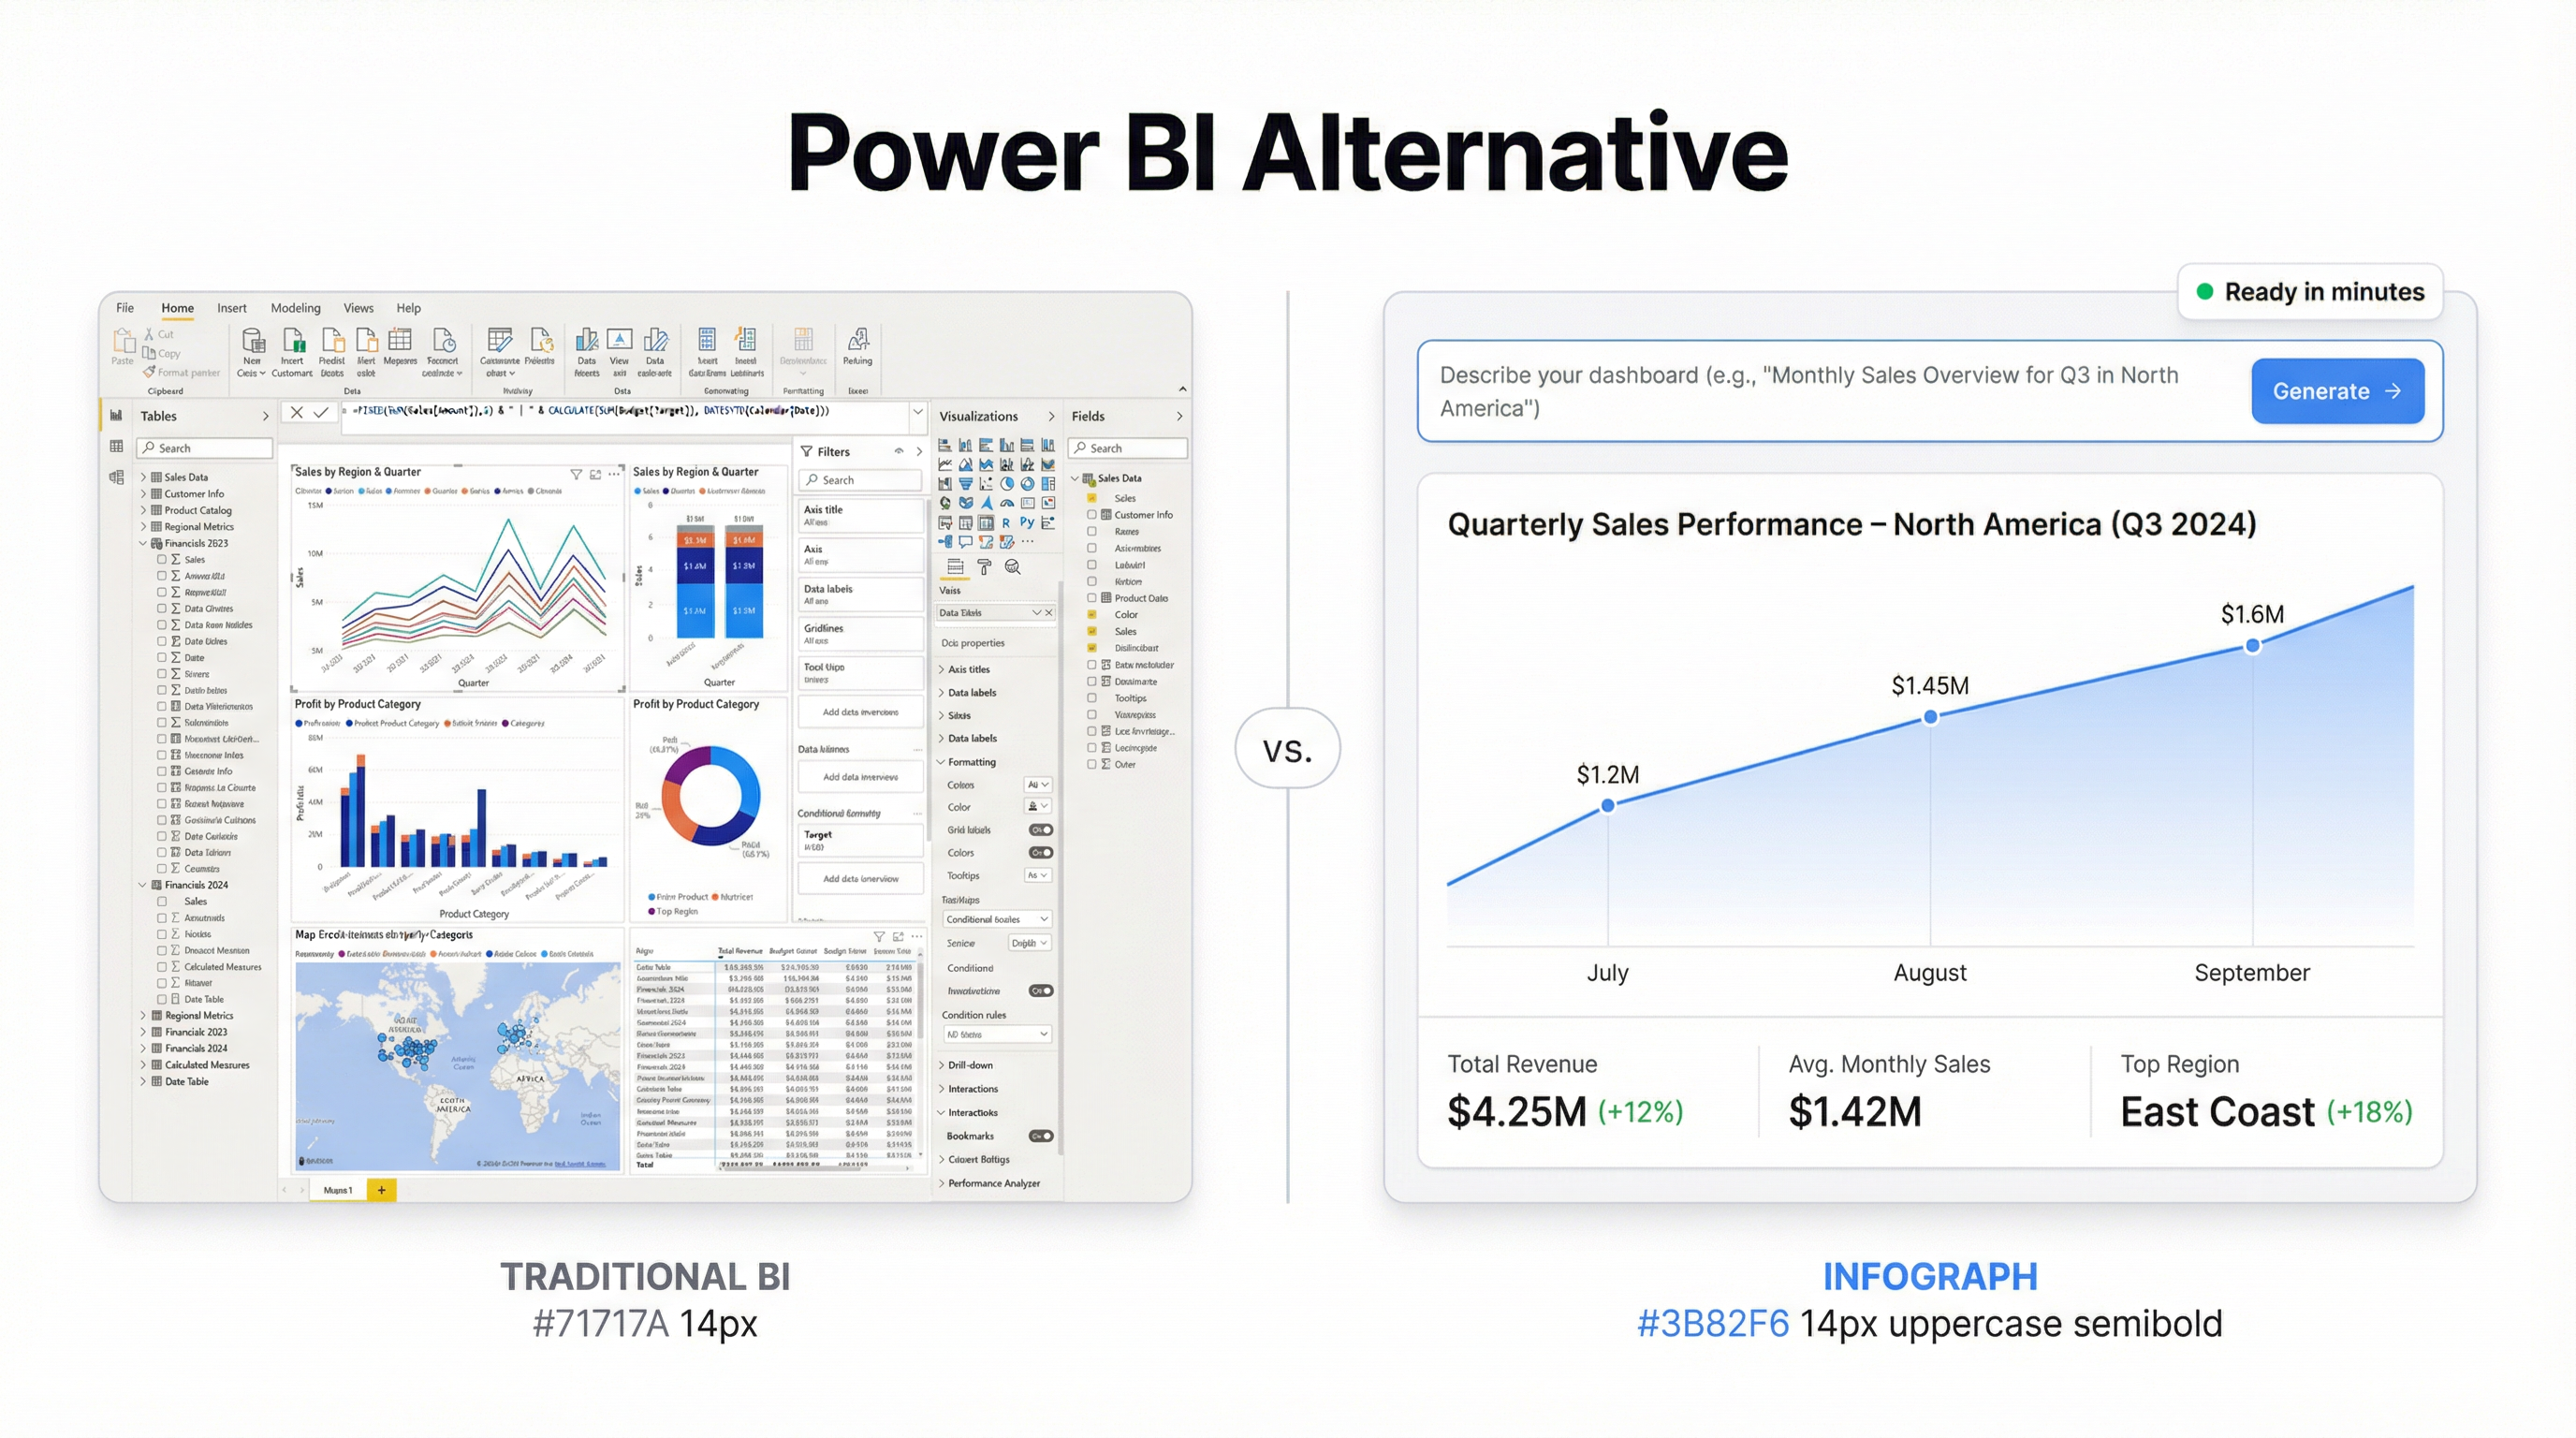
The Best Power BI Alternative in 2026 (Especially If You Just Need Dashboards)
Guide
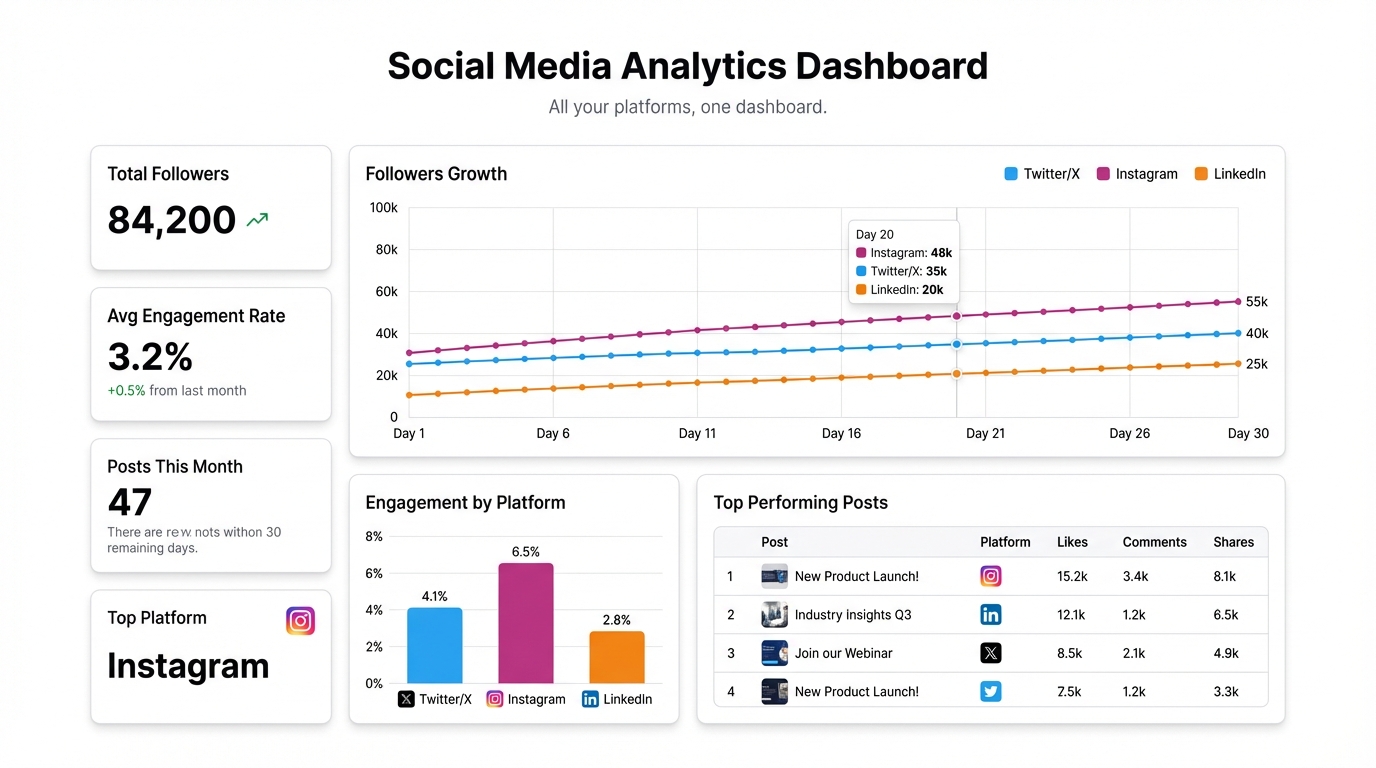
Social Media Analytics Dashboard: Unify Your Data Across Every Platform
General
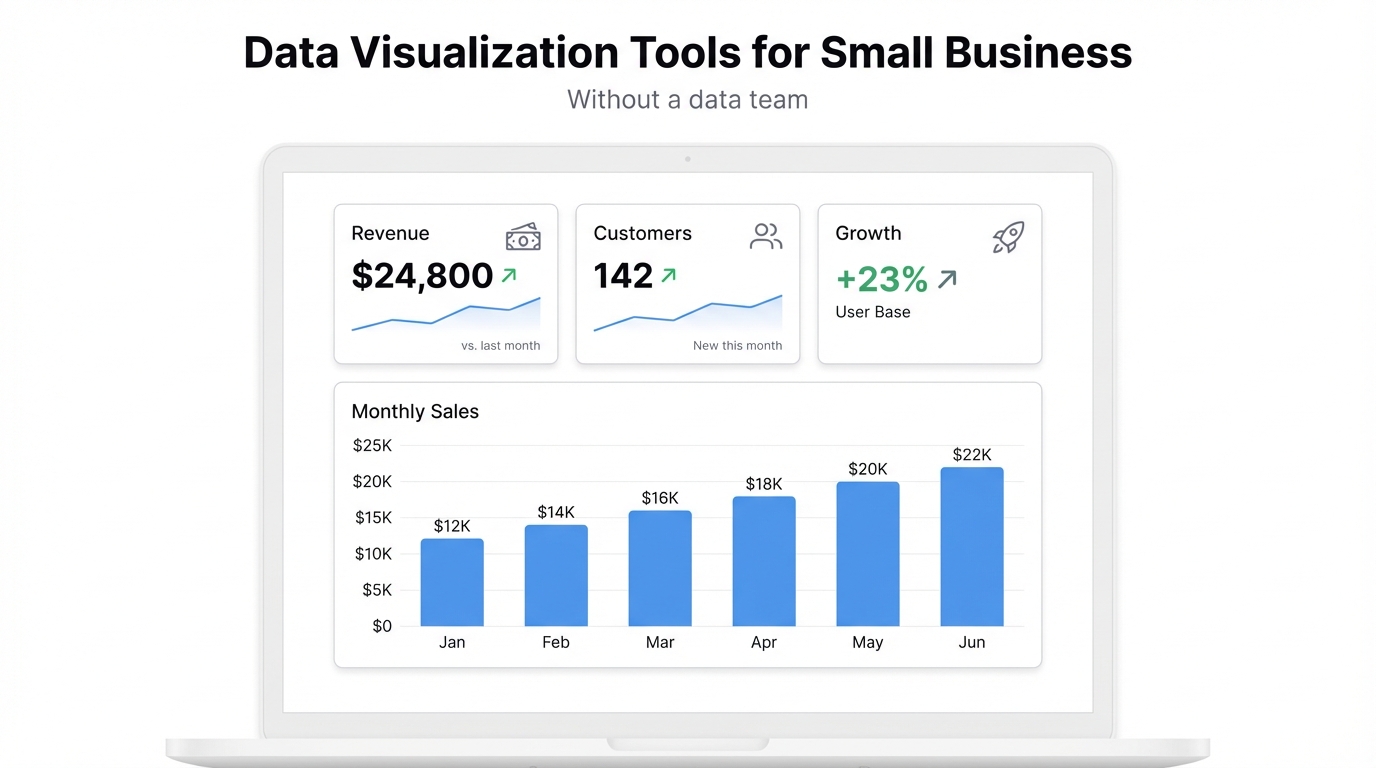
Data Visualization Tools for Small Business: What Actually Works Without a Data Team
Guide
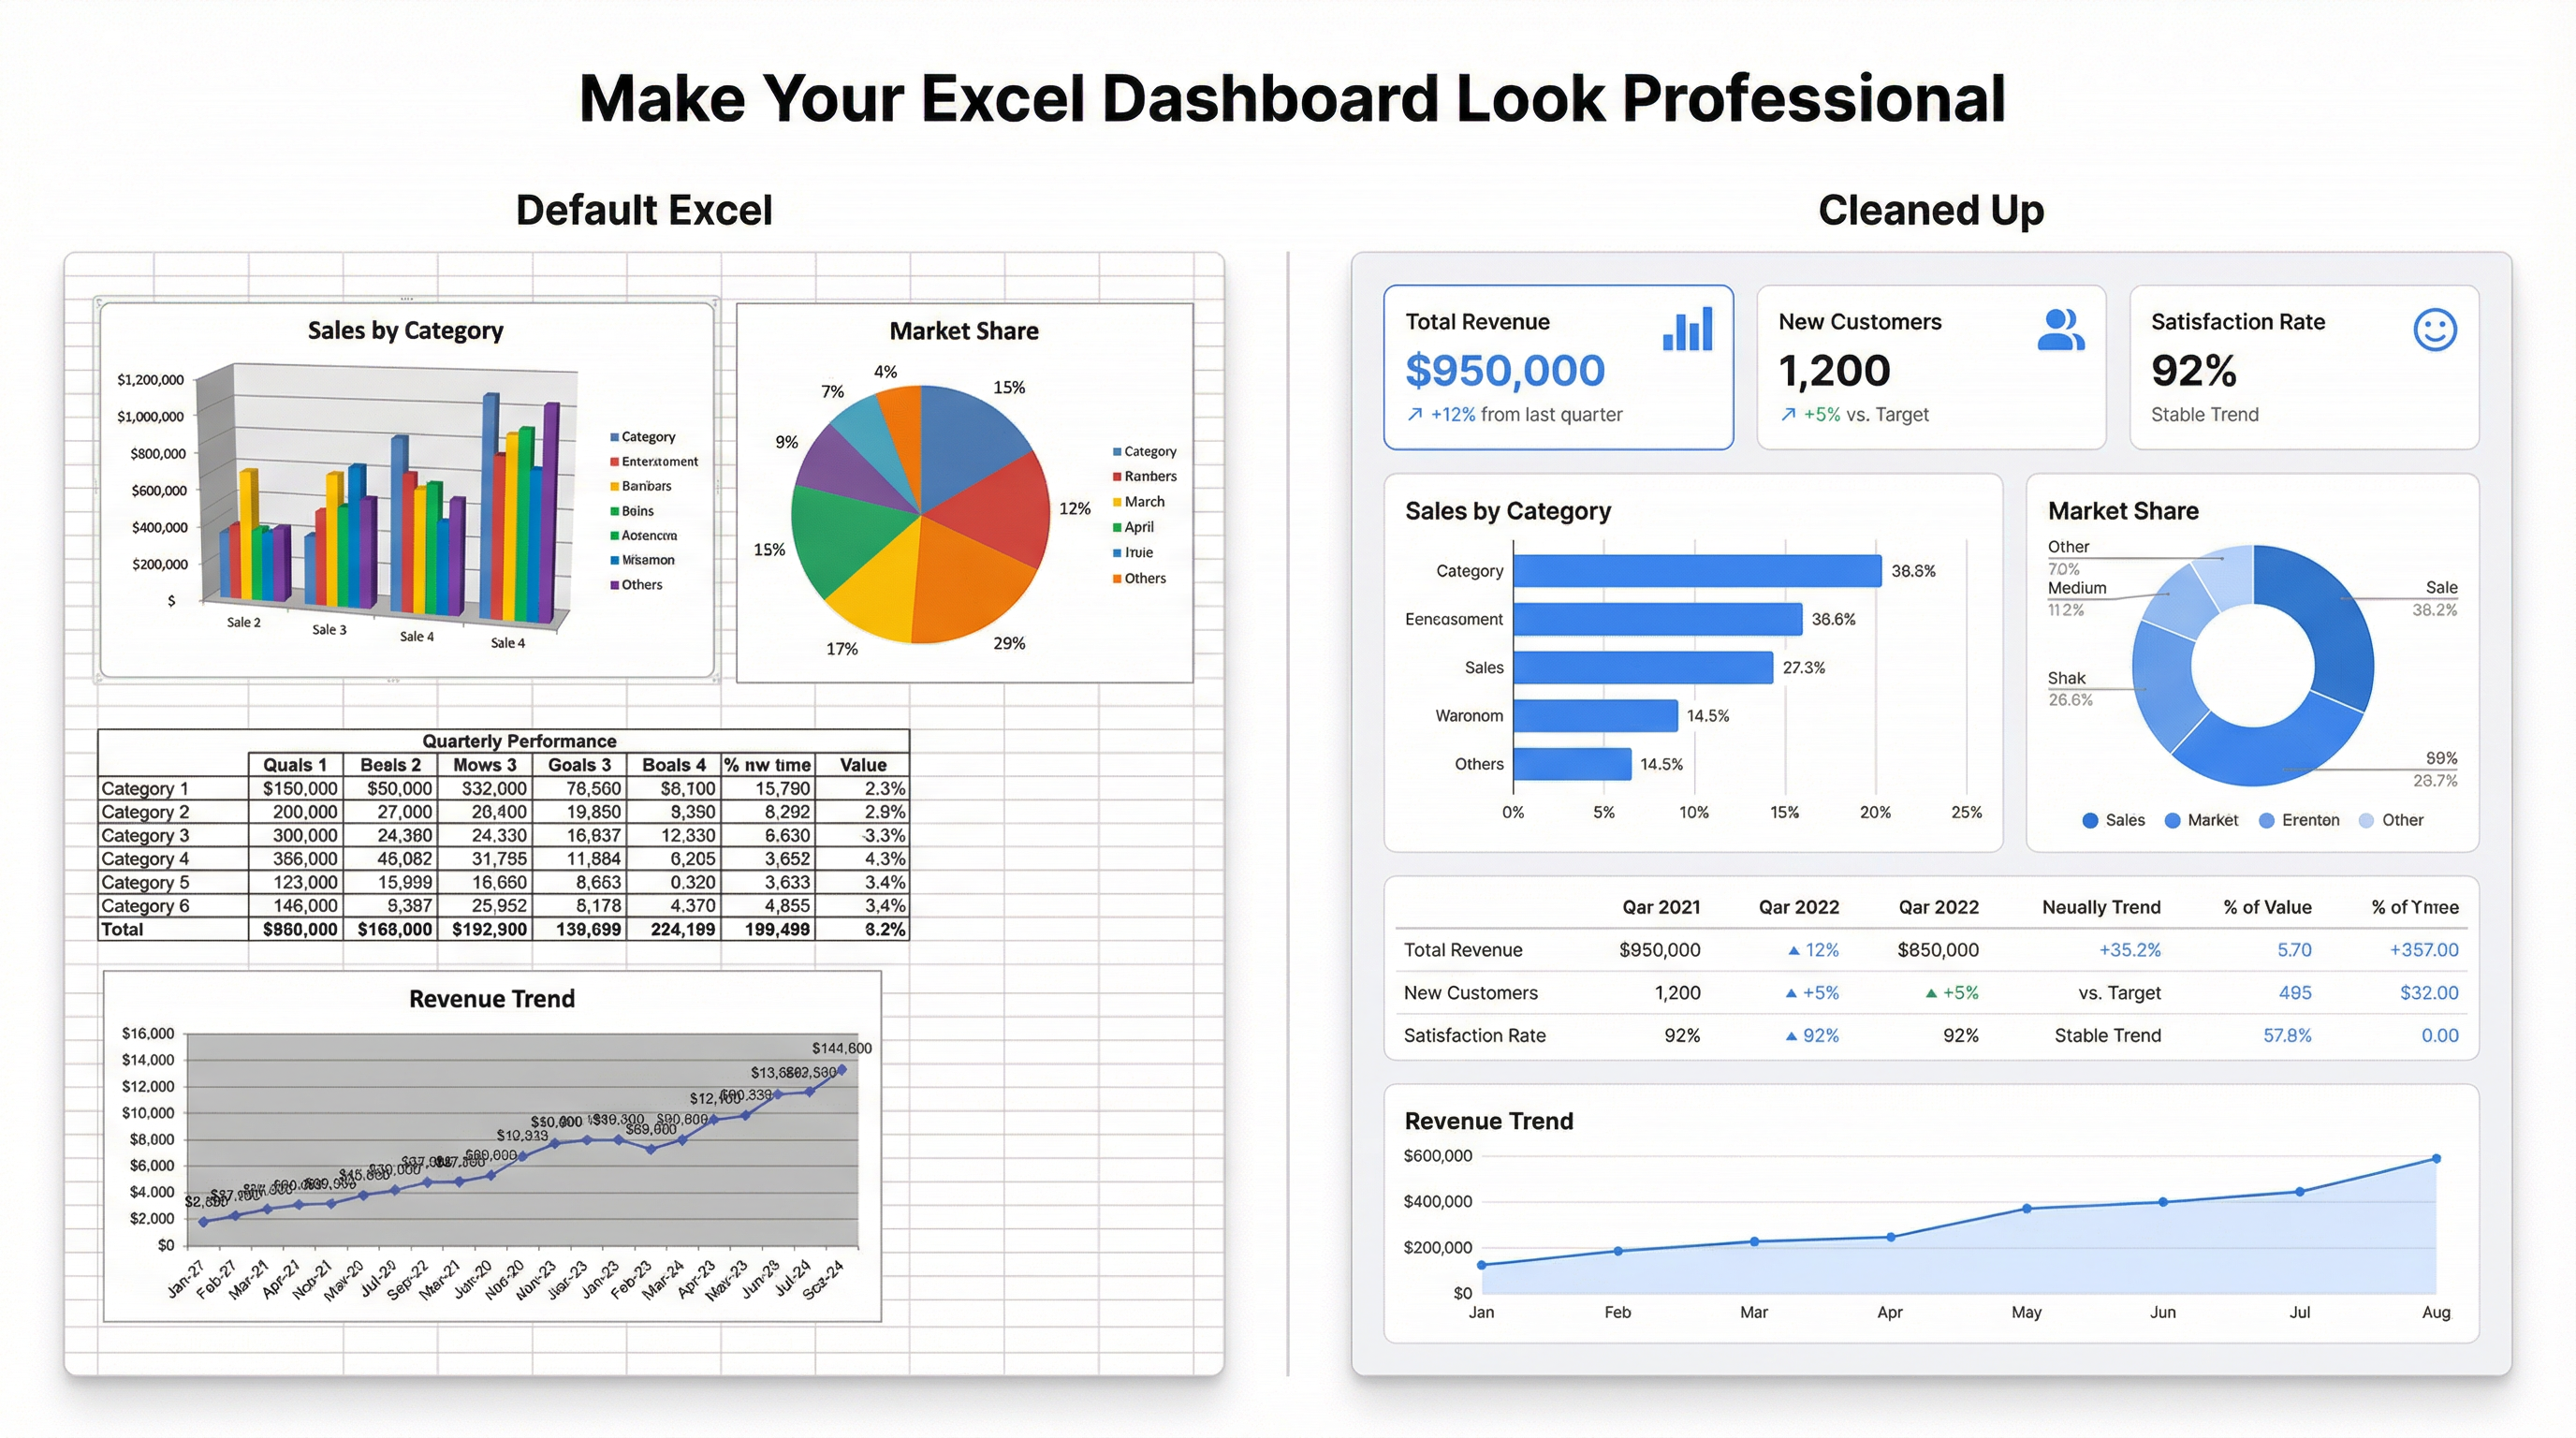
How to Make an Excel Dashboard Look Professional (Without Spending 10 Hours on It)
Guide
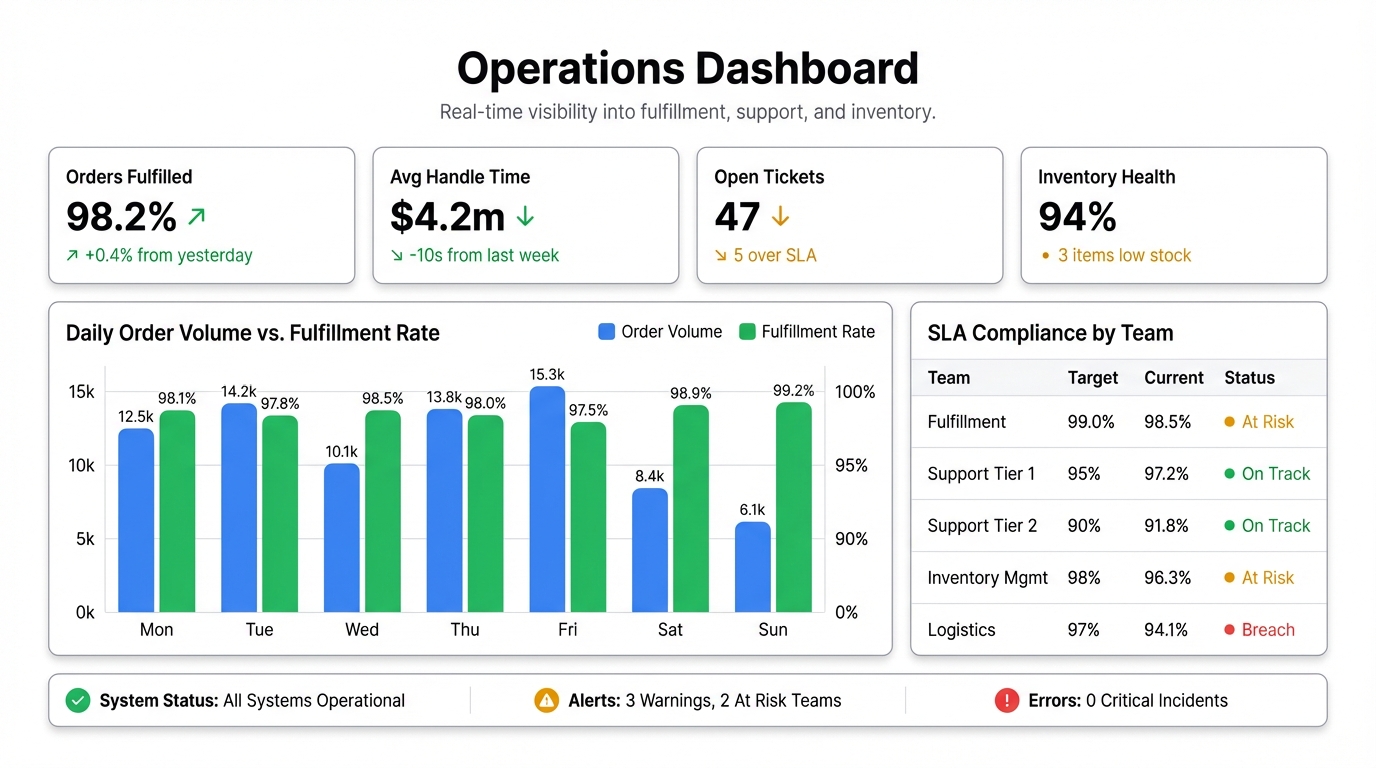
How to Build an Operations Dashboard (Without a Data Team)
Guide
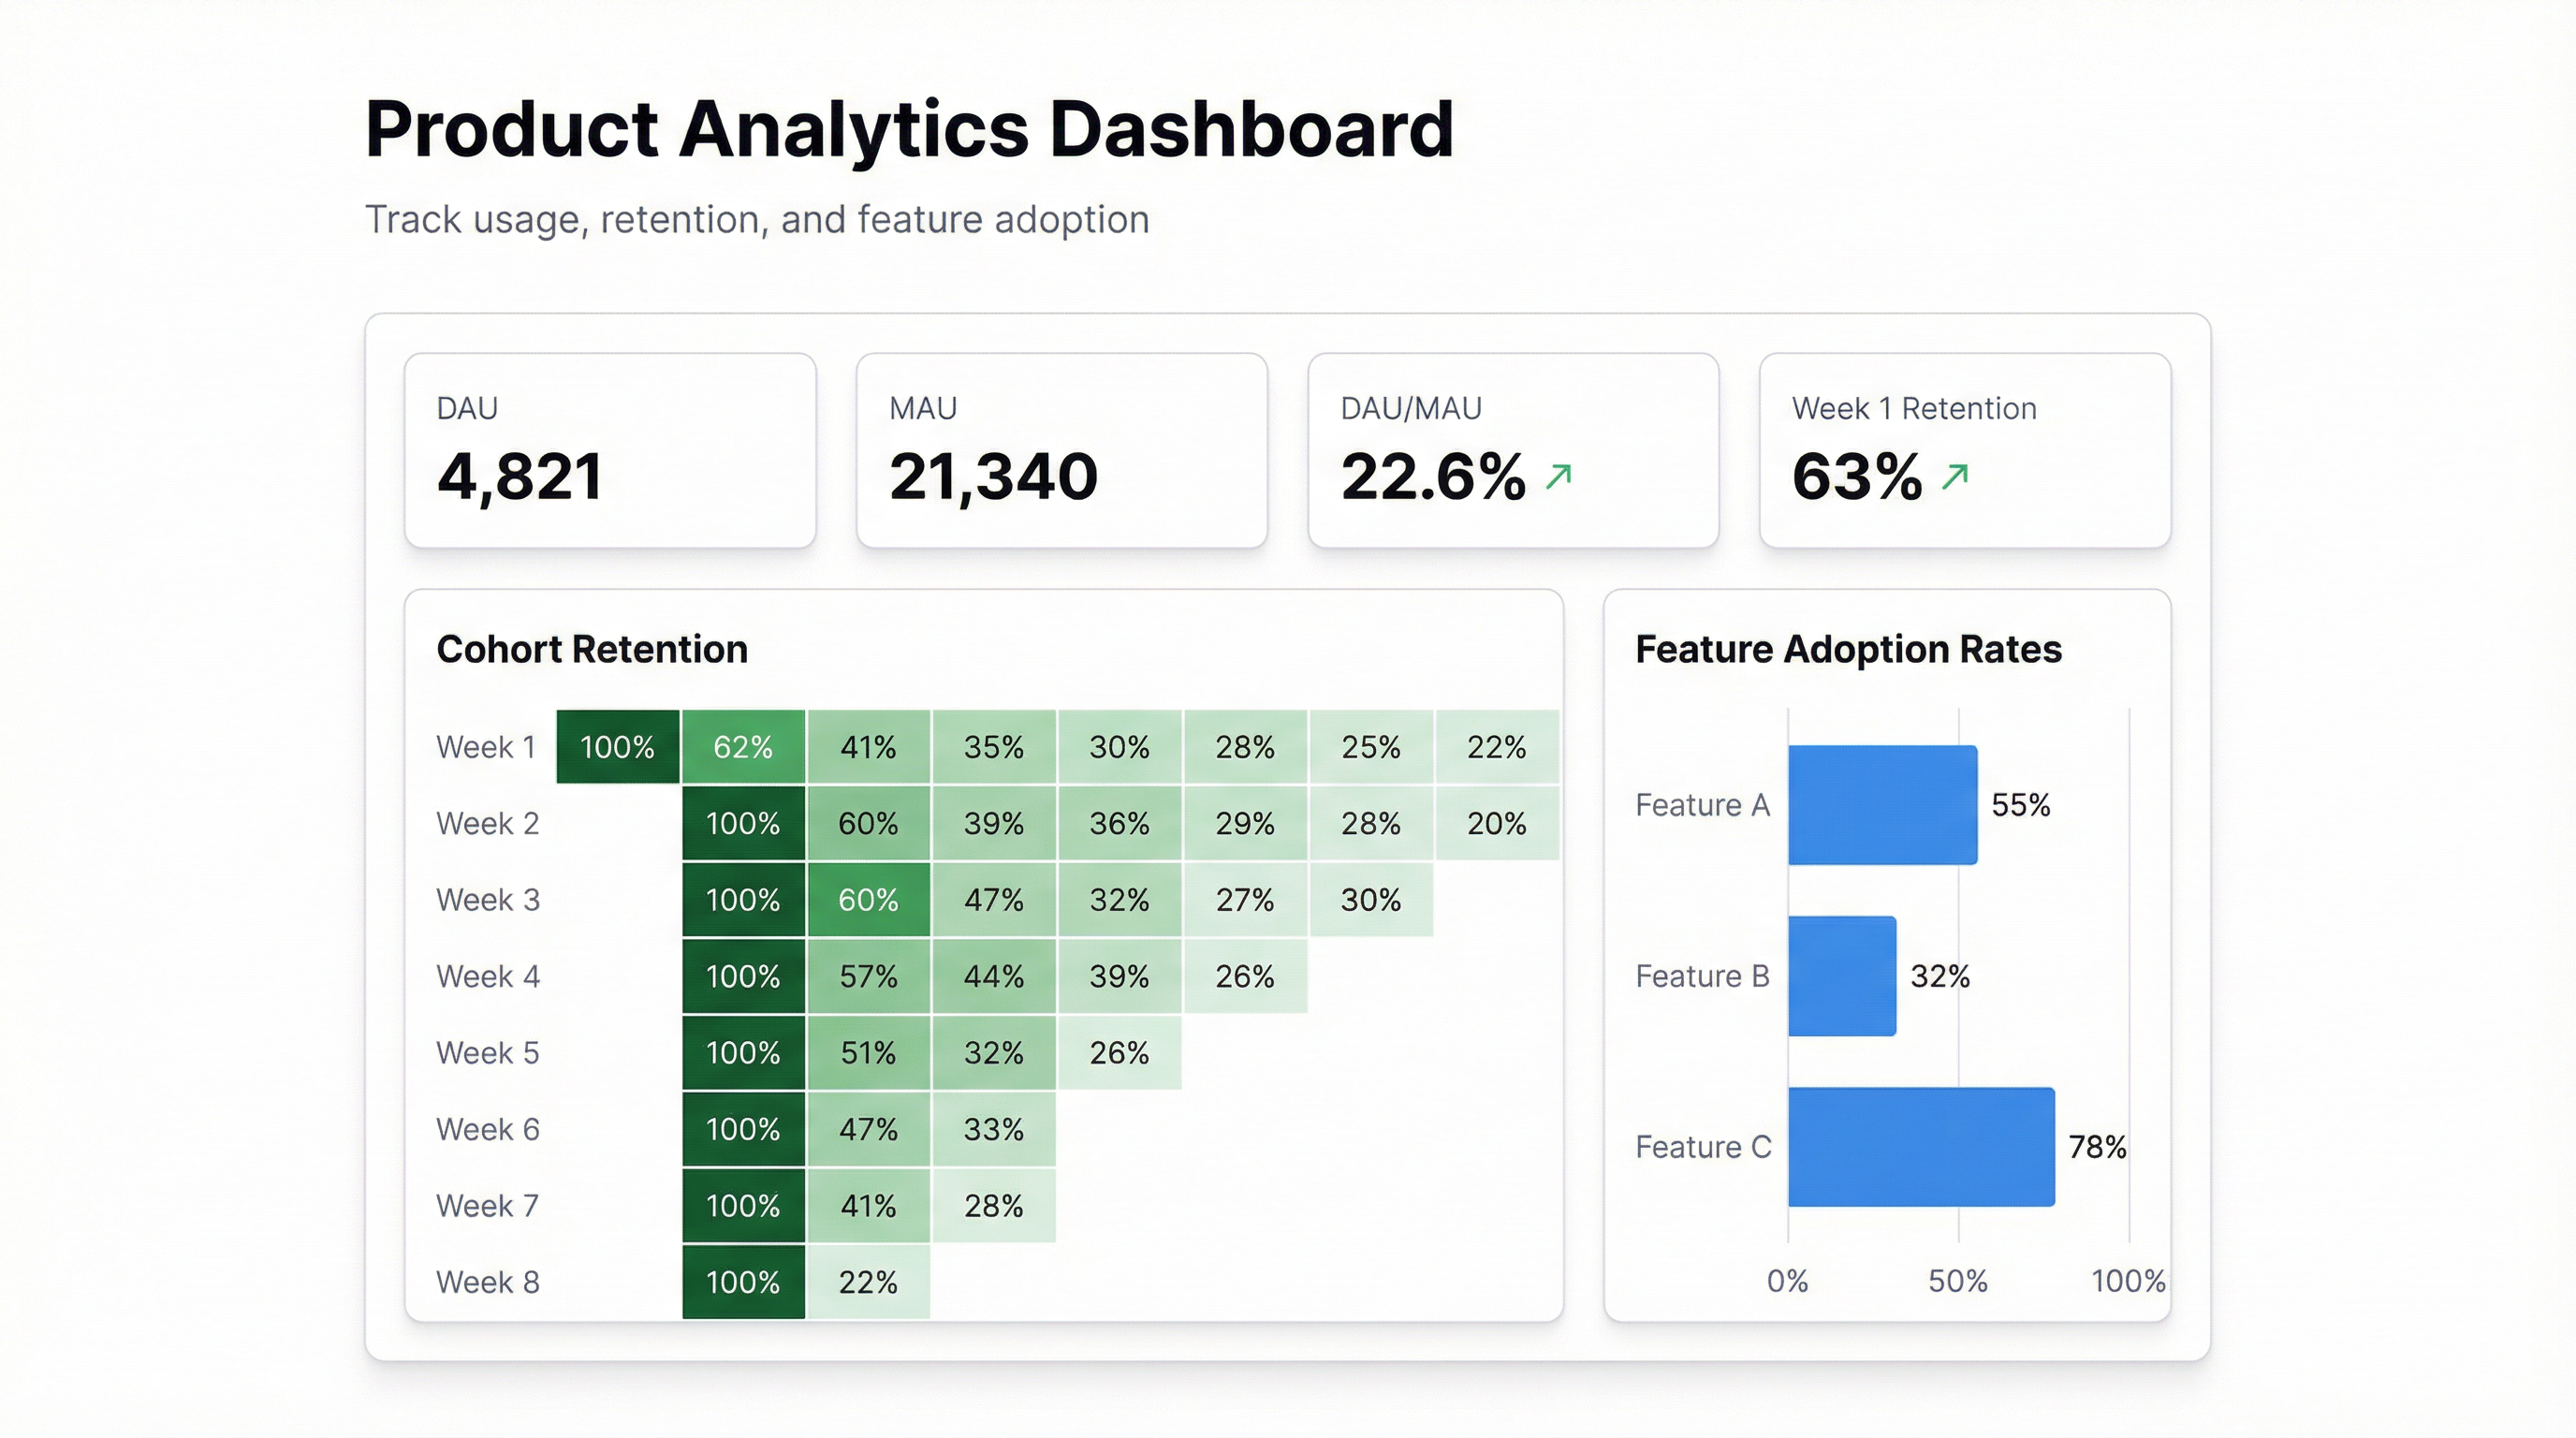
Product Analytics Dashboard: Track Usage, Retention, and Feature Adoption
Guide
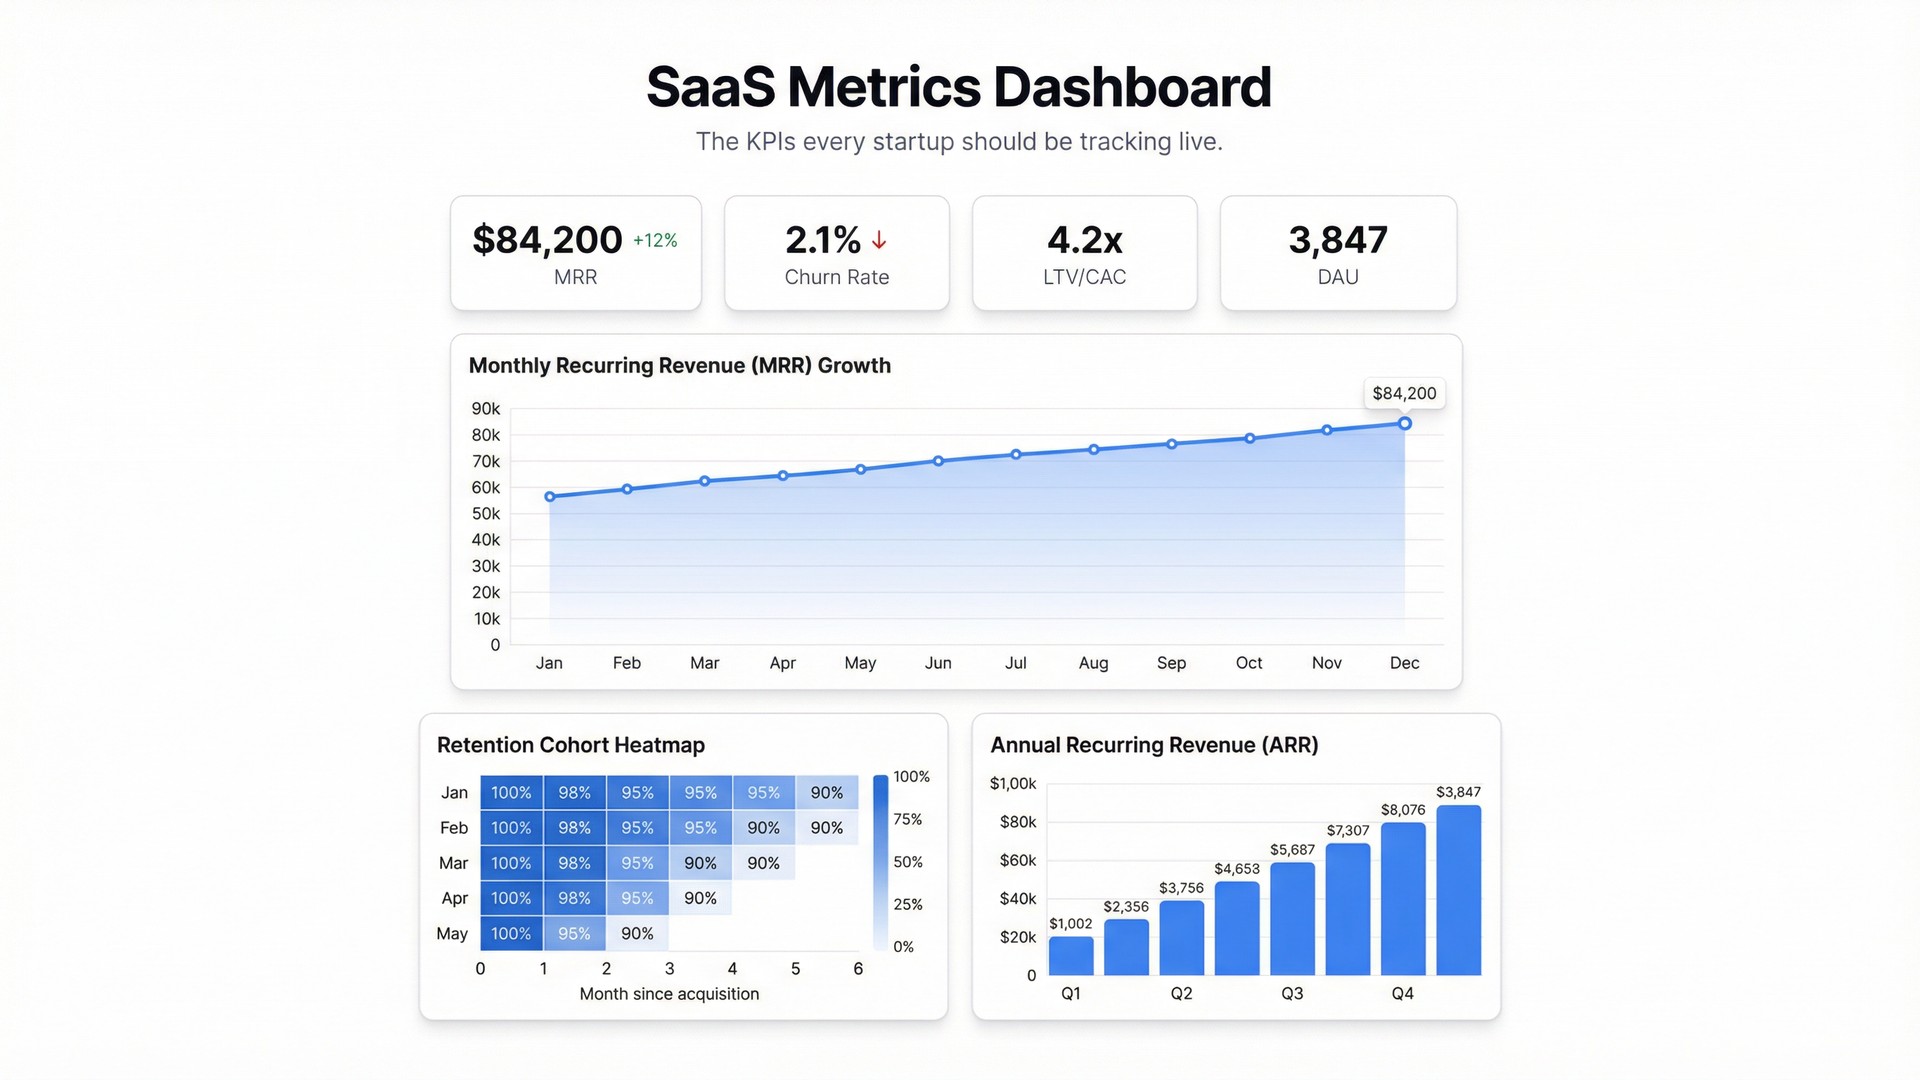
SaaS Metrics Dashboard: The KPIs Every Startup Should Be Tracking Live
Guide
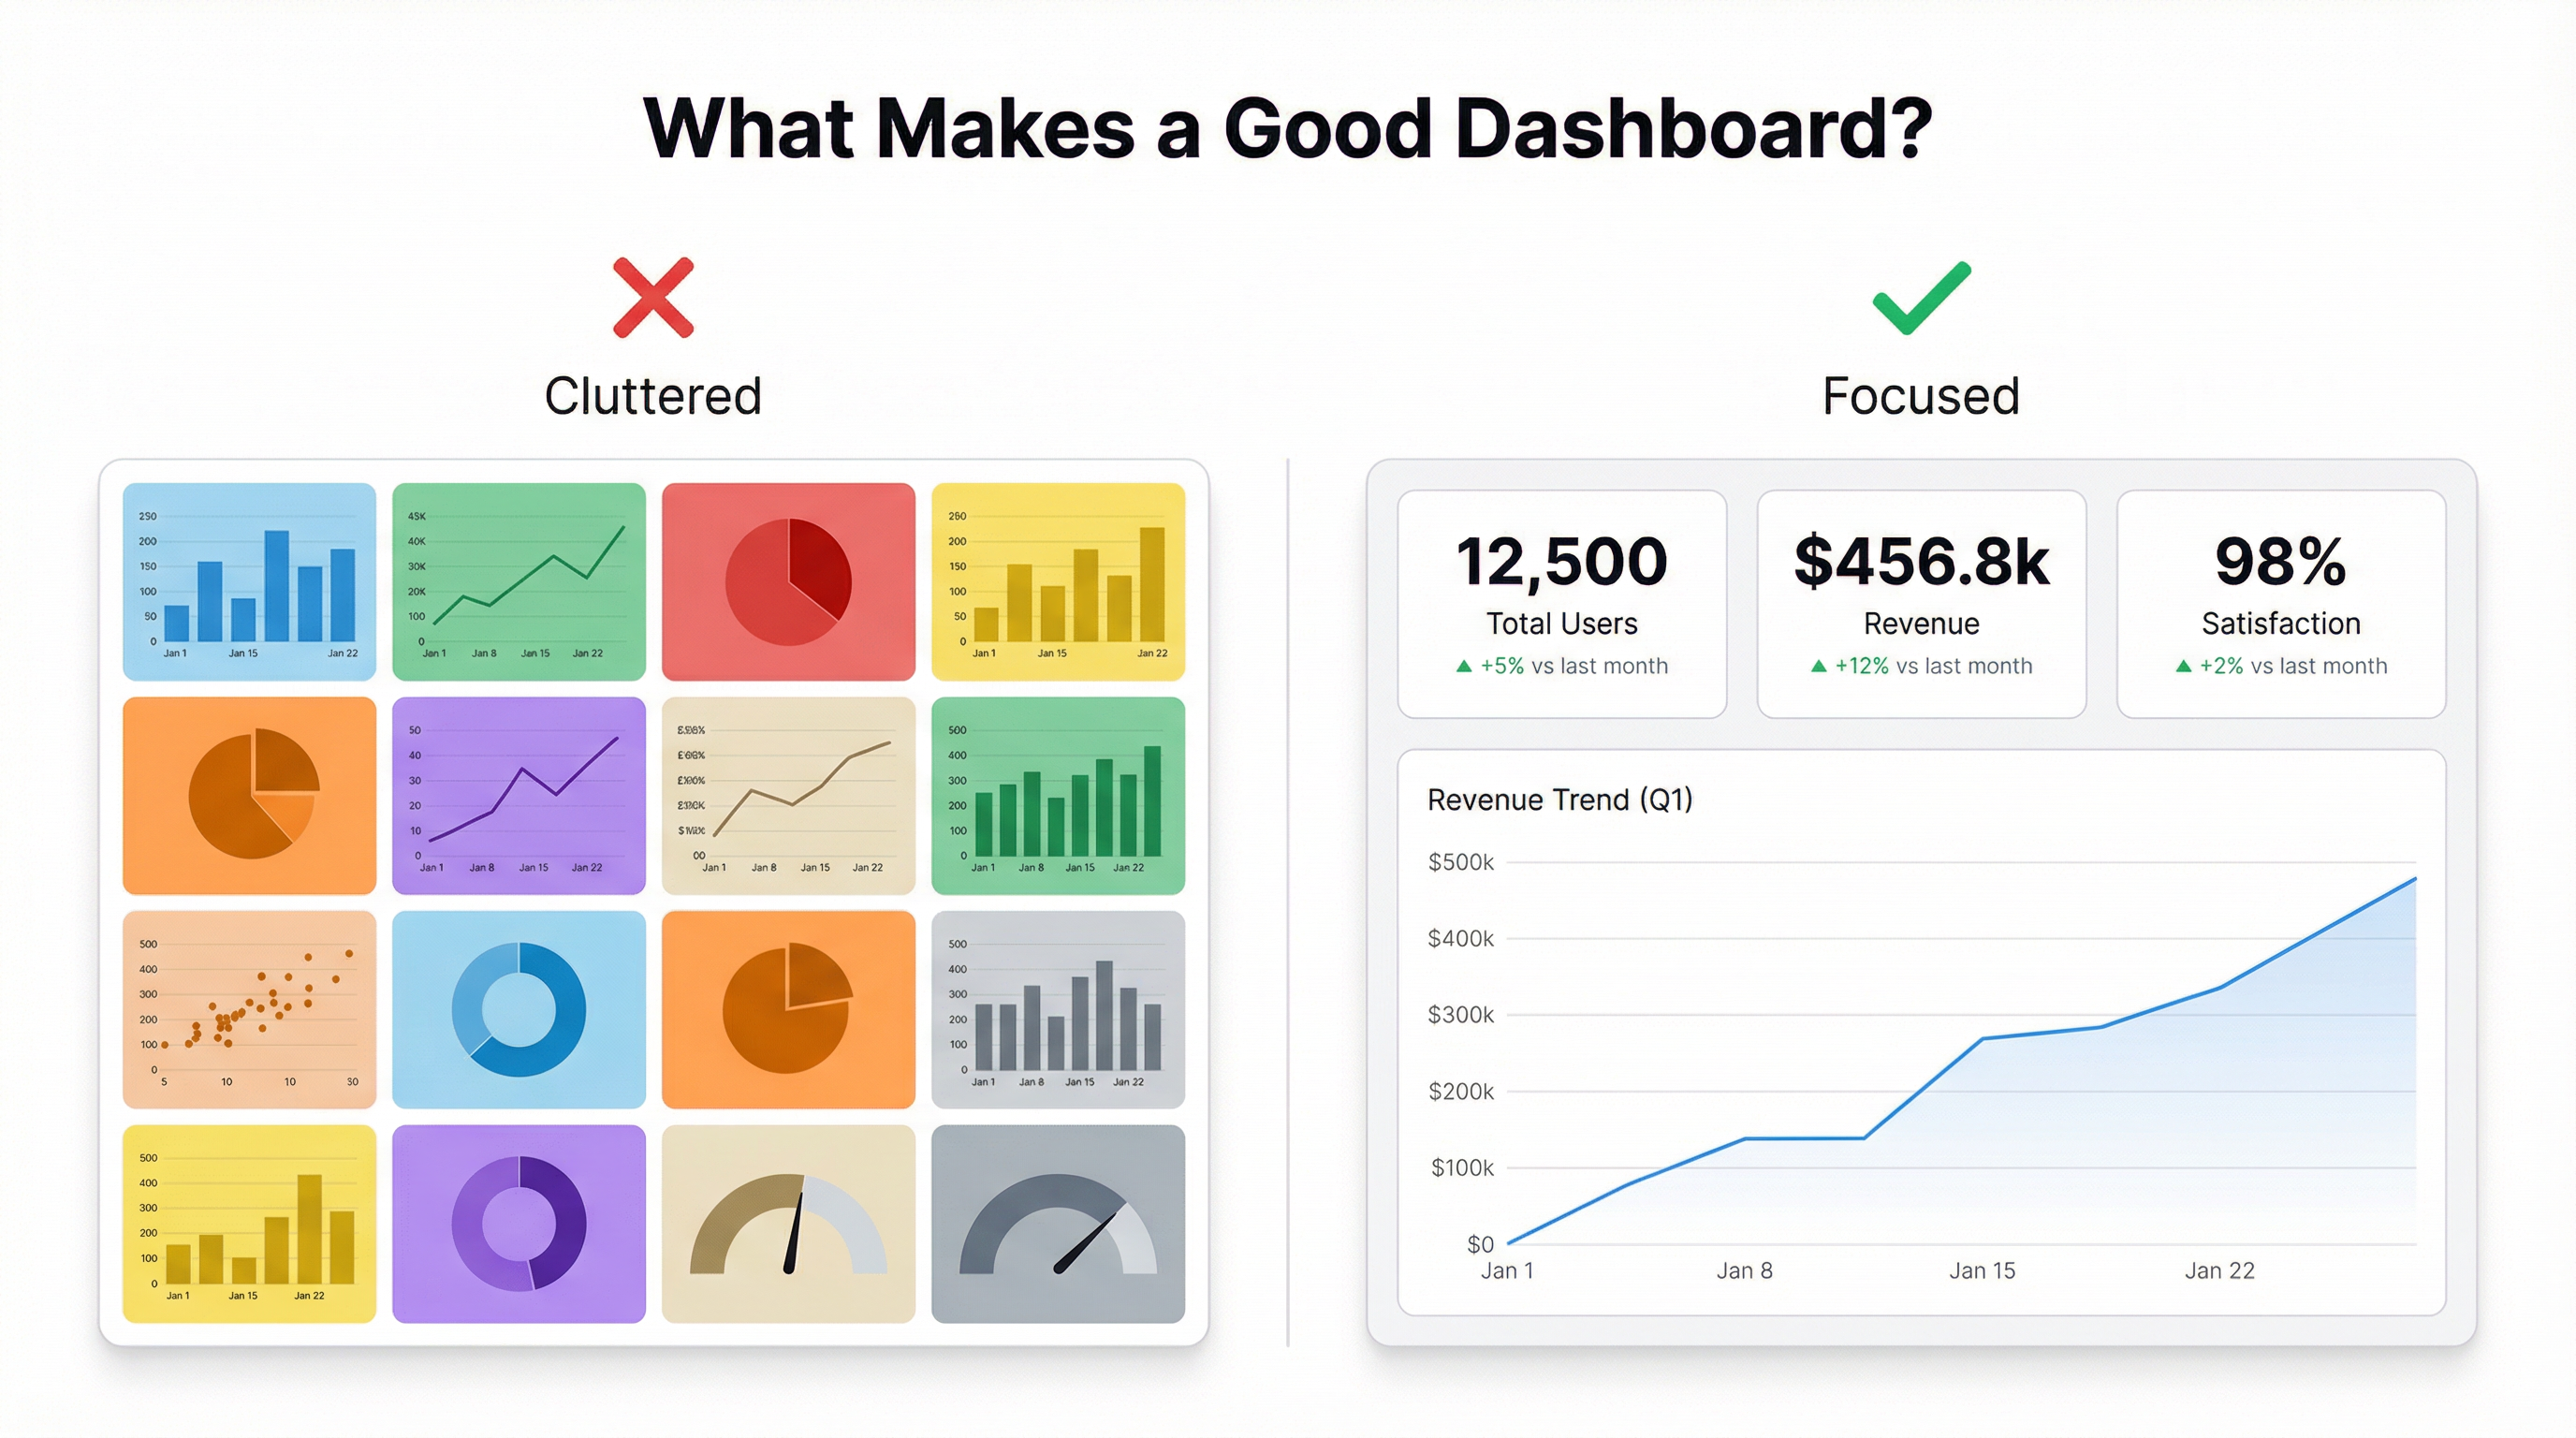
What Makes a Good Dashboard? 7 Principles That Actually Work
General
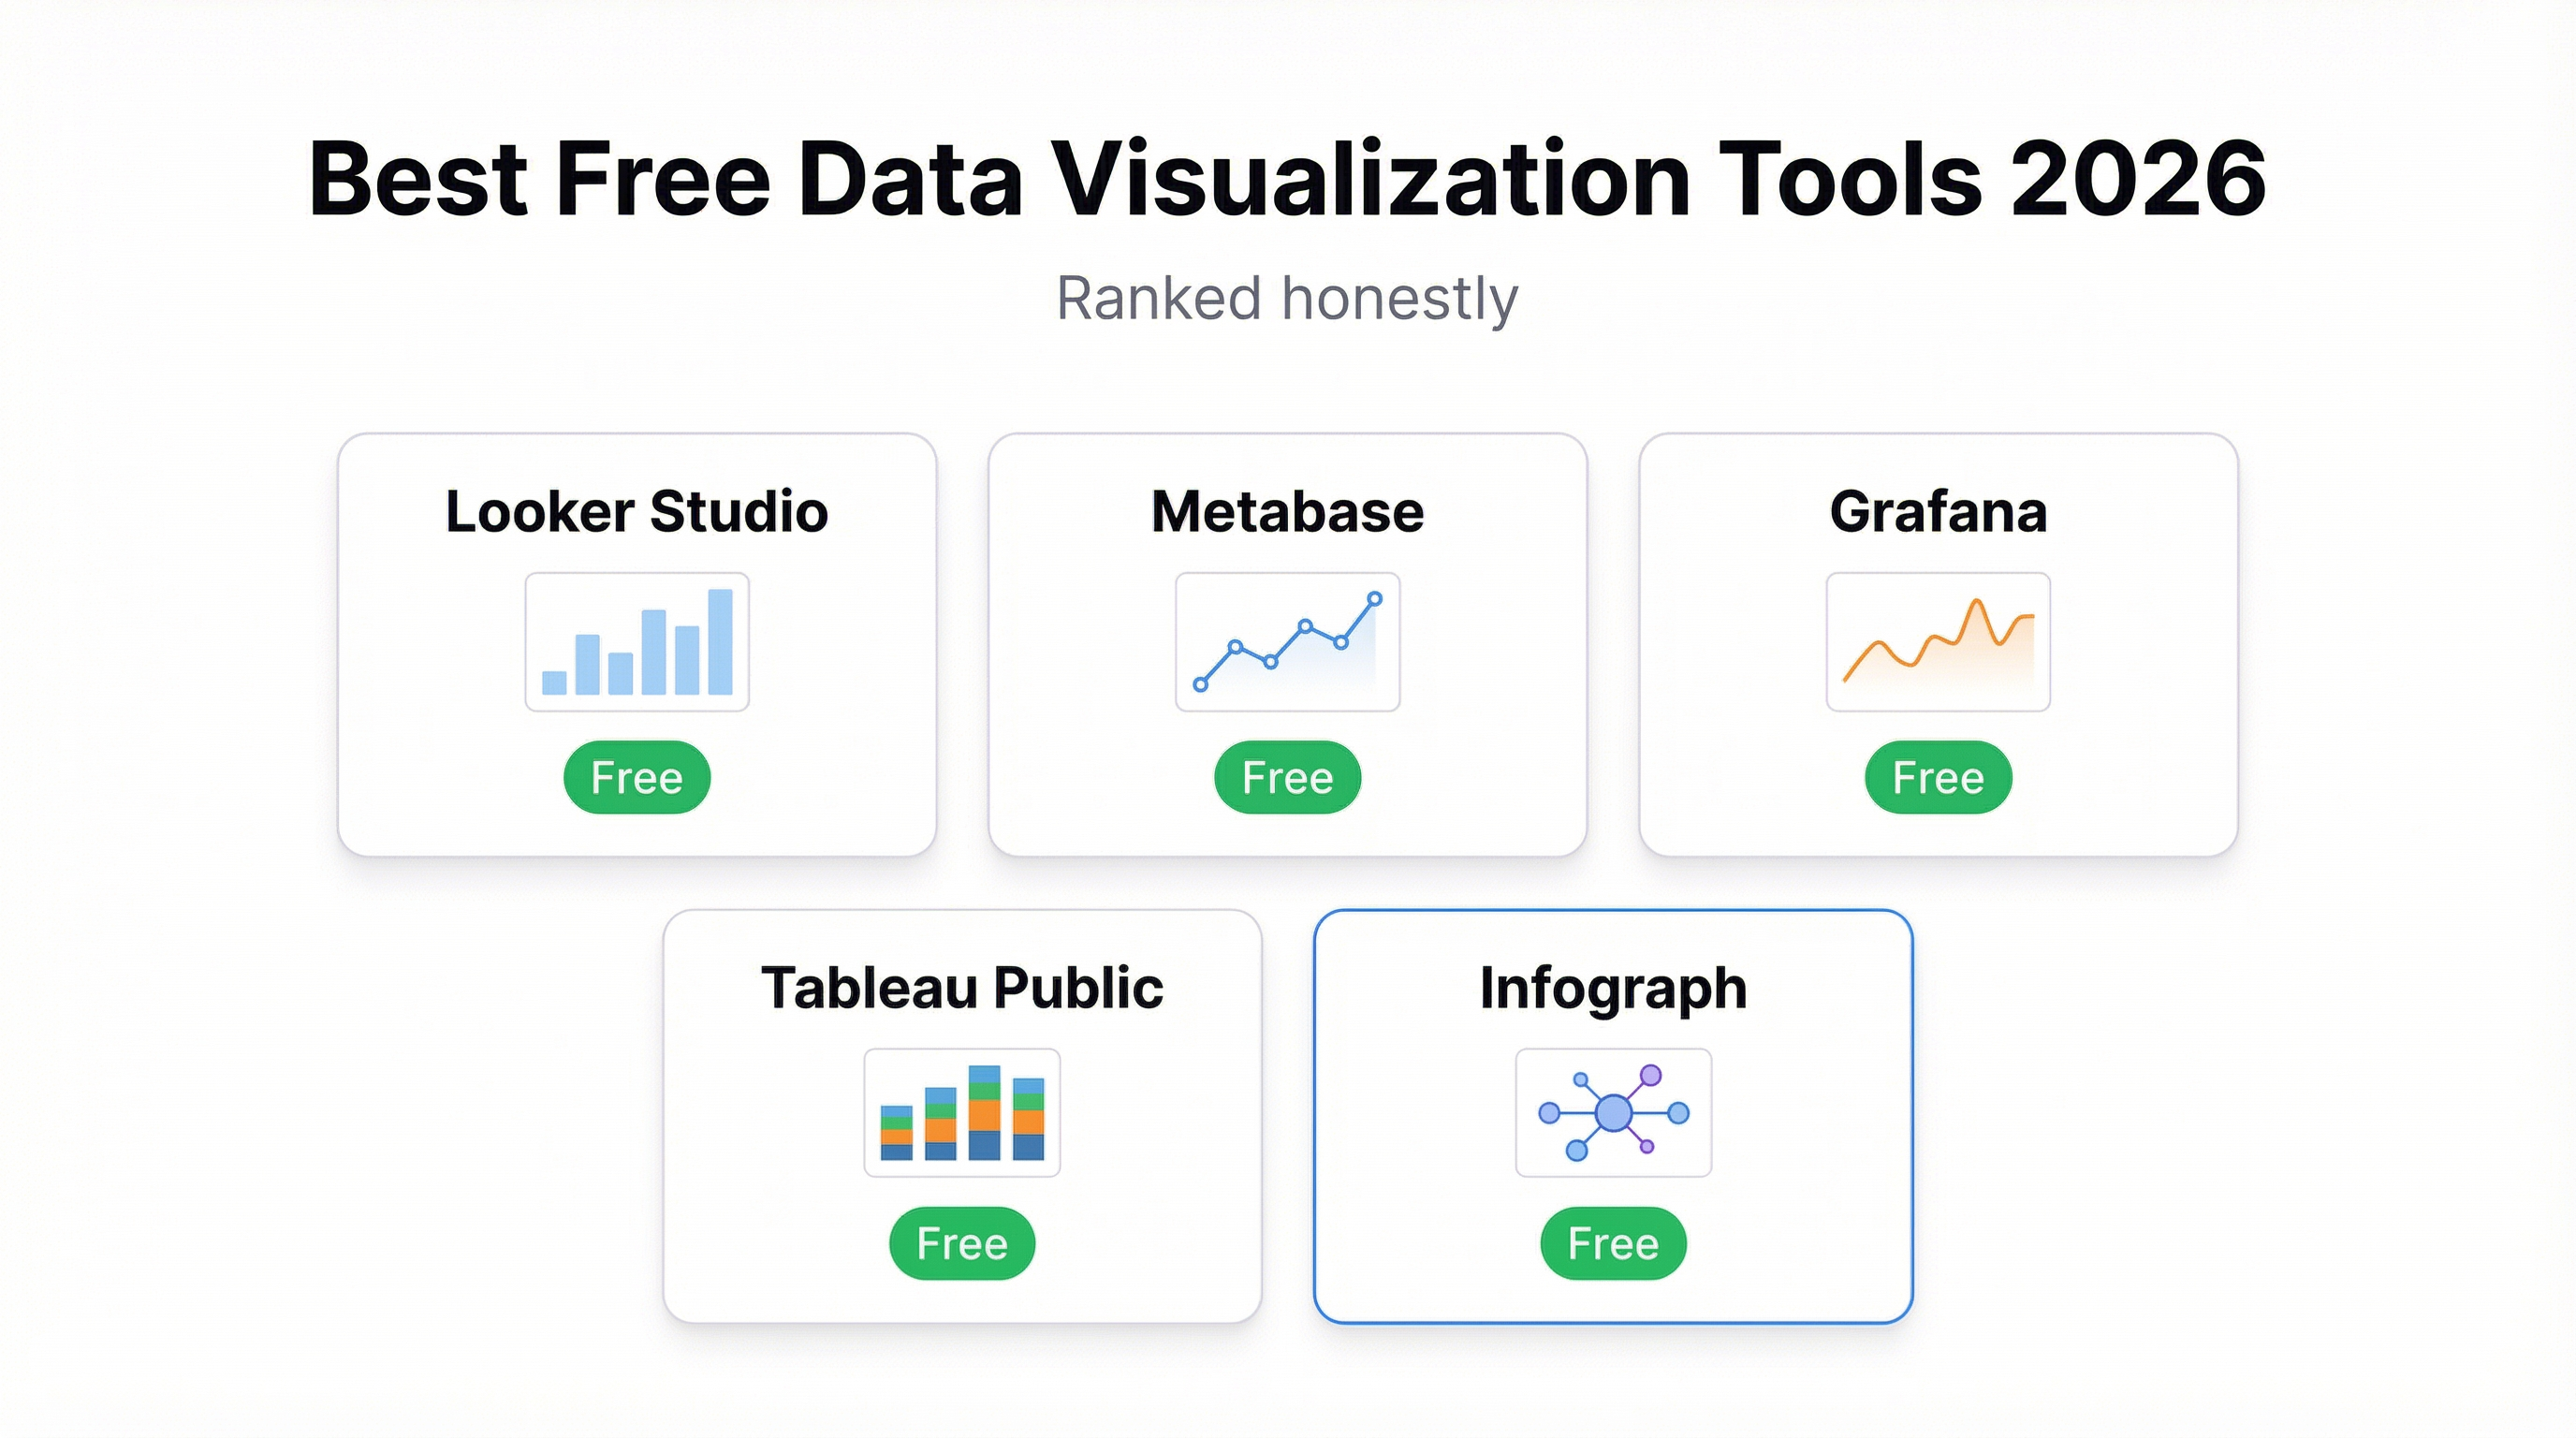
The Best Free Data Visualization Tools in 2026 (Ranked Honestly)
Guide
12 Data Dashboard Examples Worth Stealing
Guide
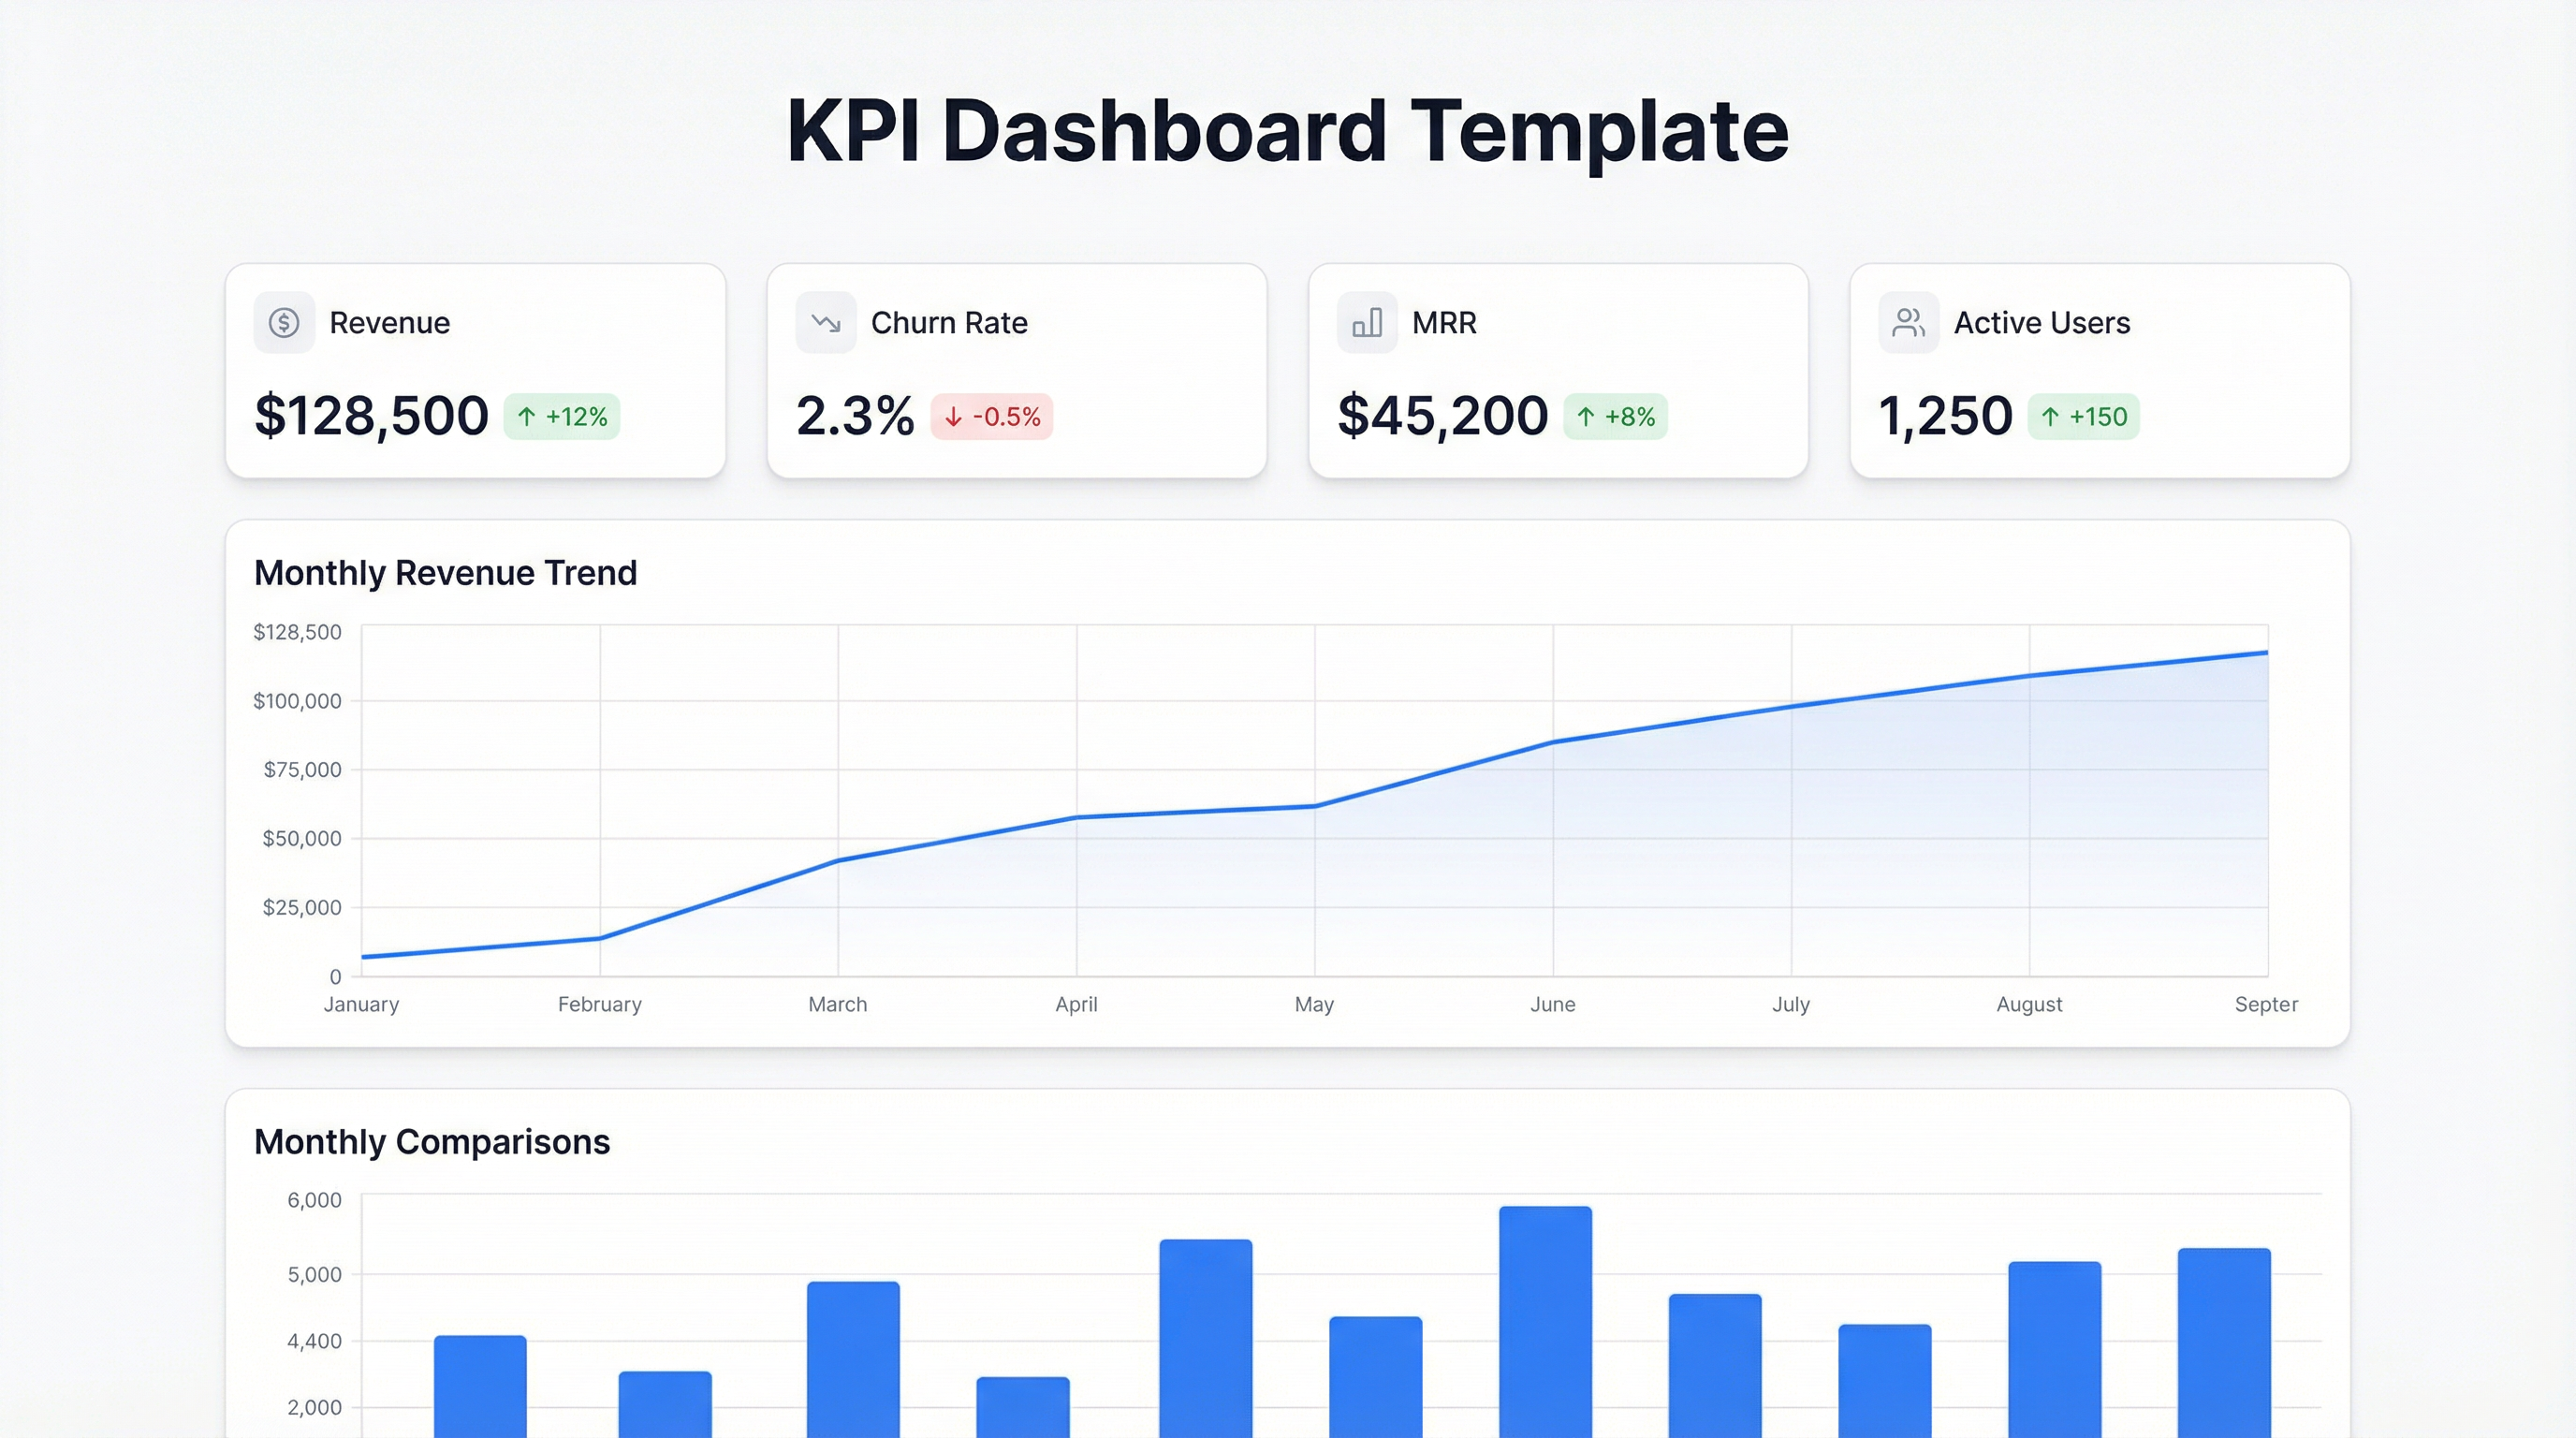
KPI Dashboard Template: Free Templates for Excel, Google Sheets & Beyond
Guide
The Executive Dashboard: What It Should Show and How to Build One Fast
Guide
HR Dashboard Examples — and How to Build Yours in Minutes
Guide
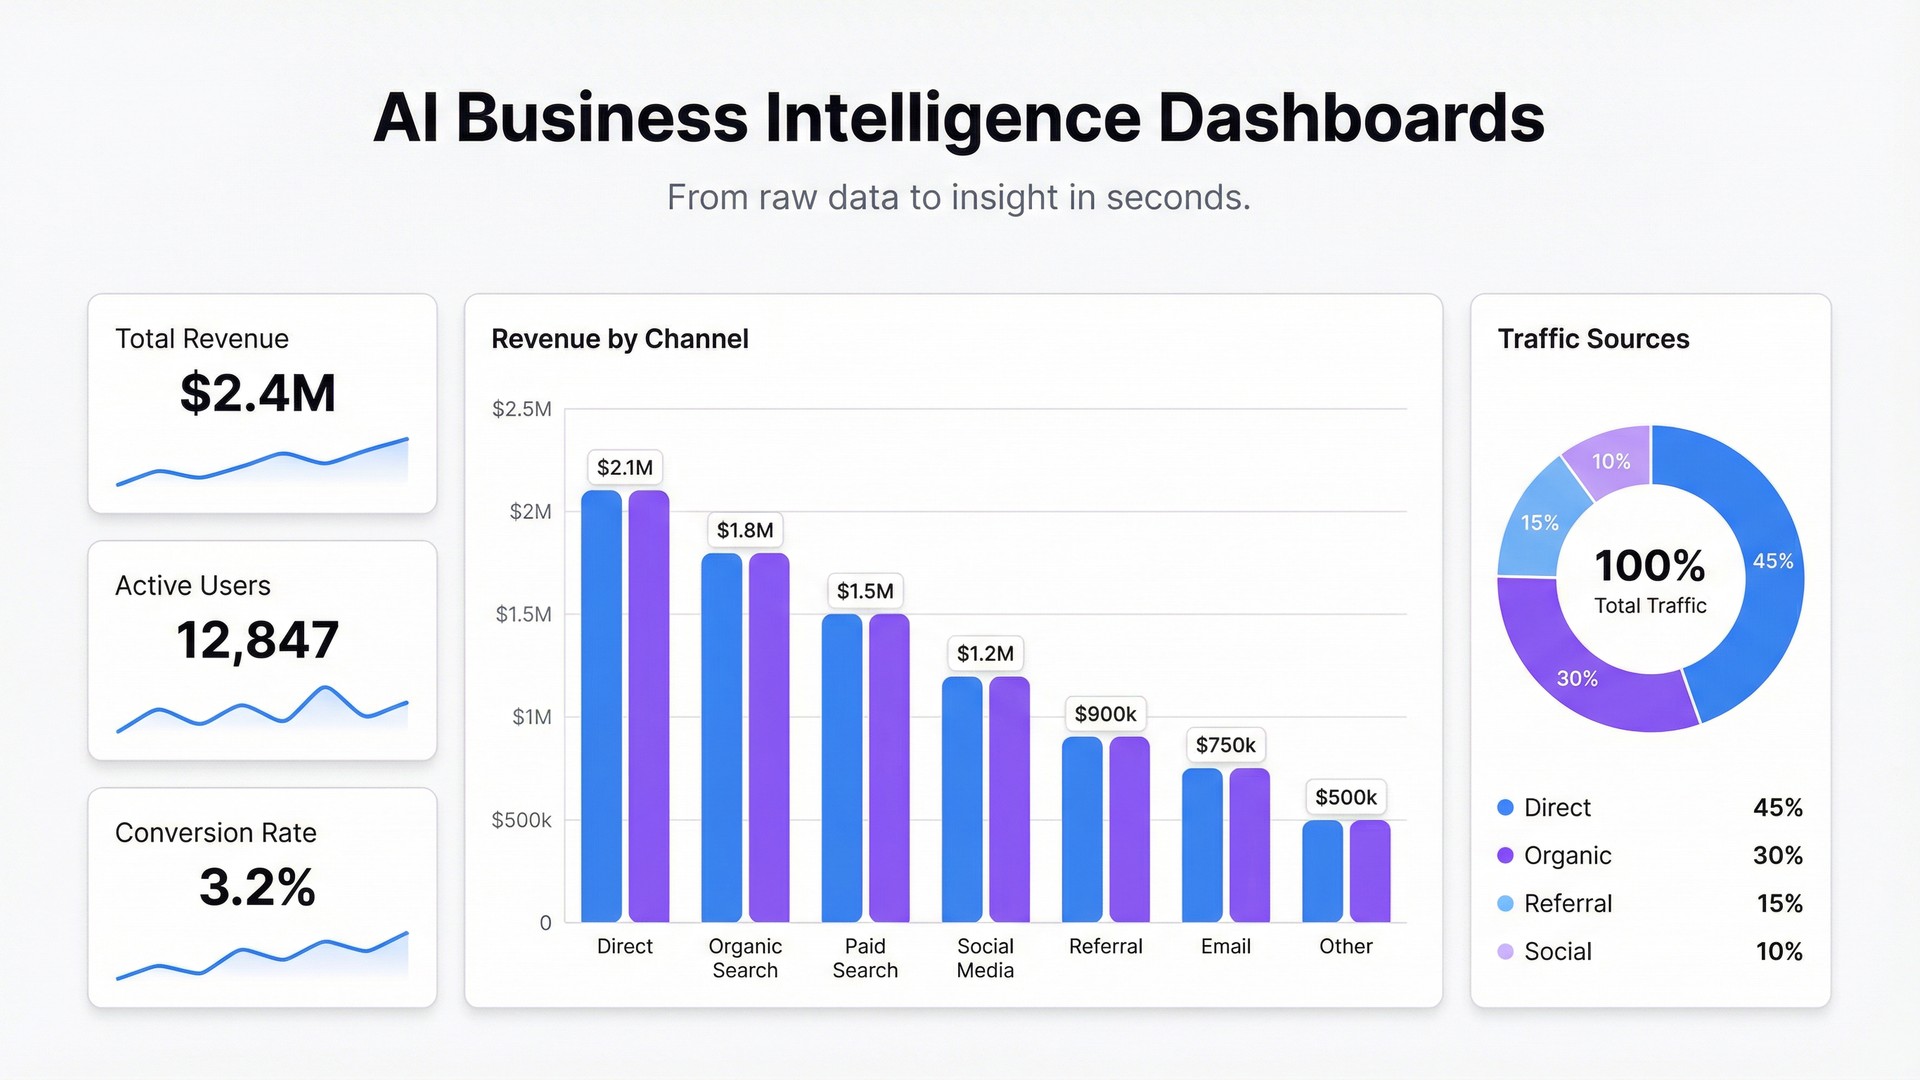
AI Business Intelligence Dashboards: What's Changed and What to Use
Guide
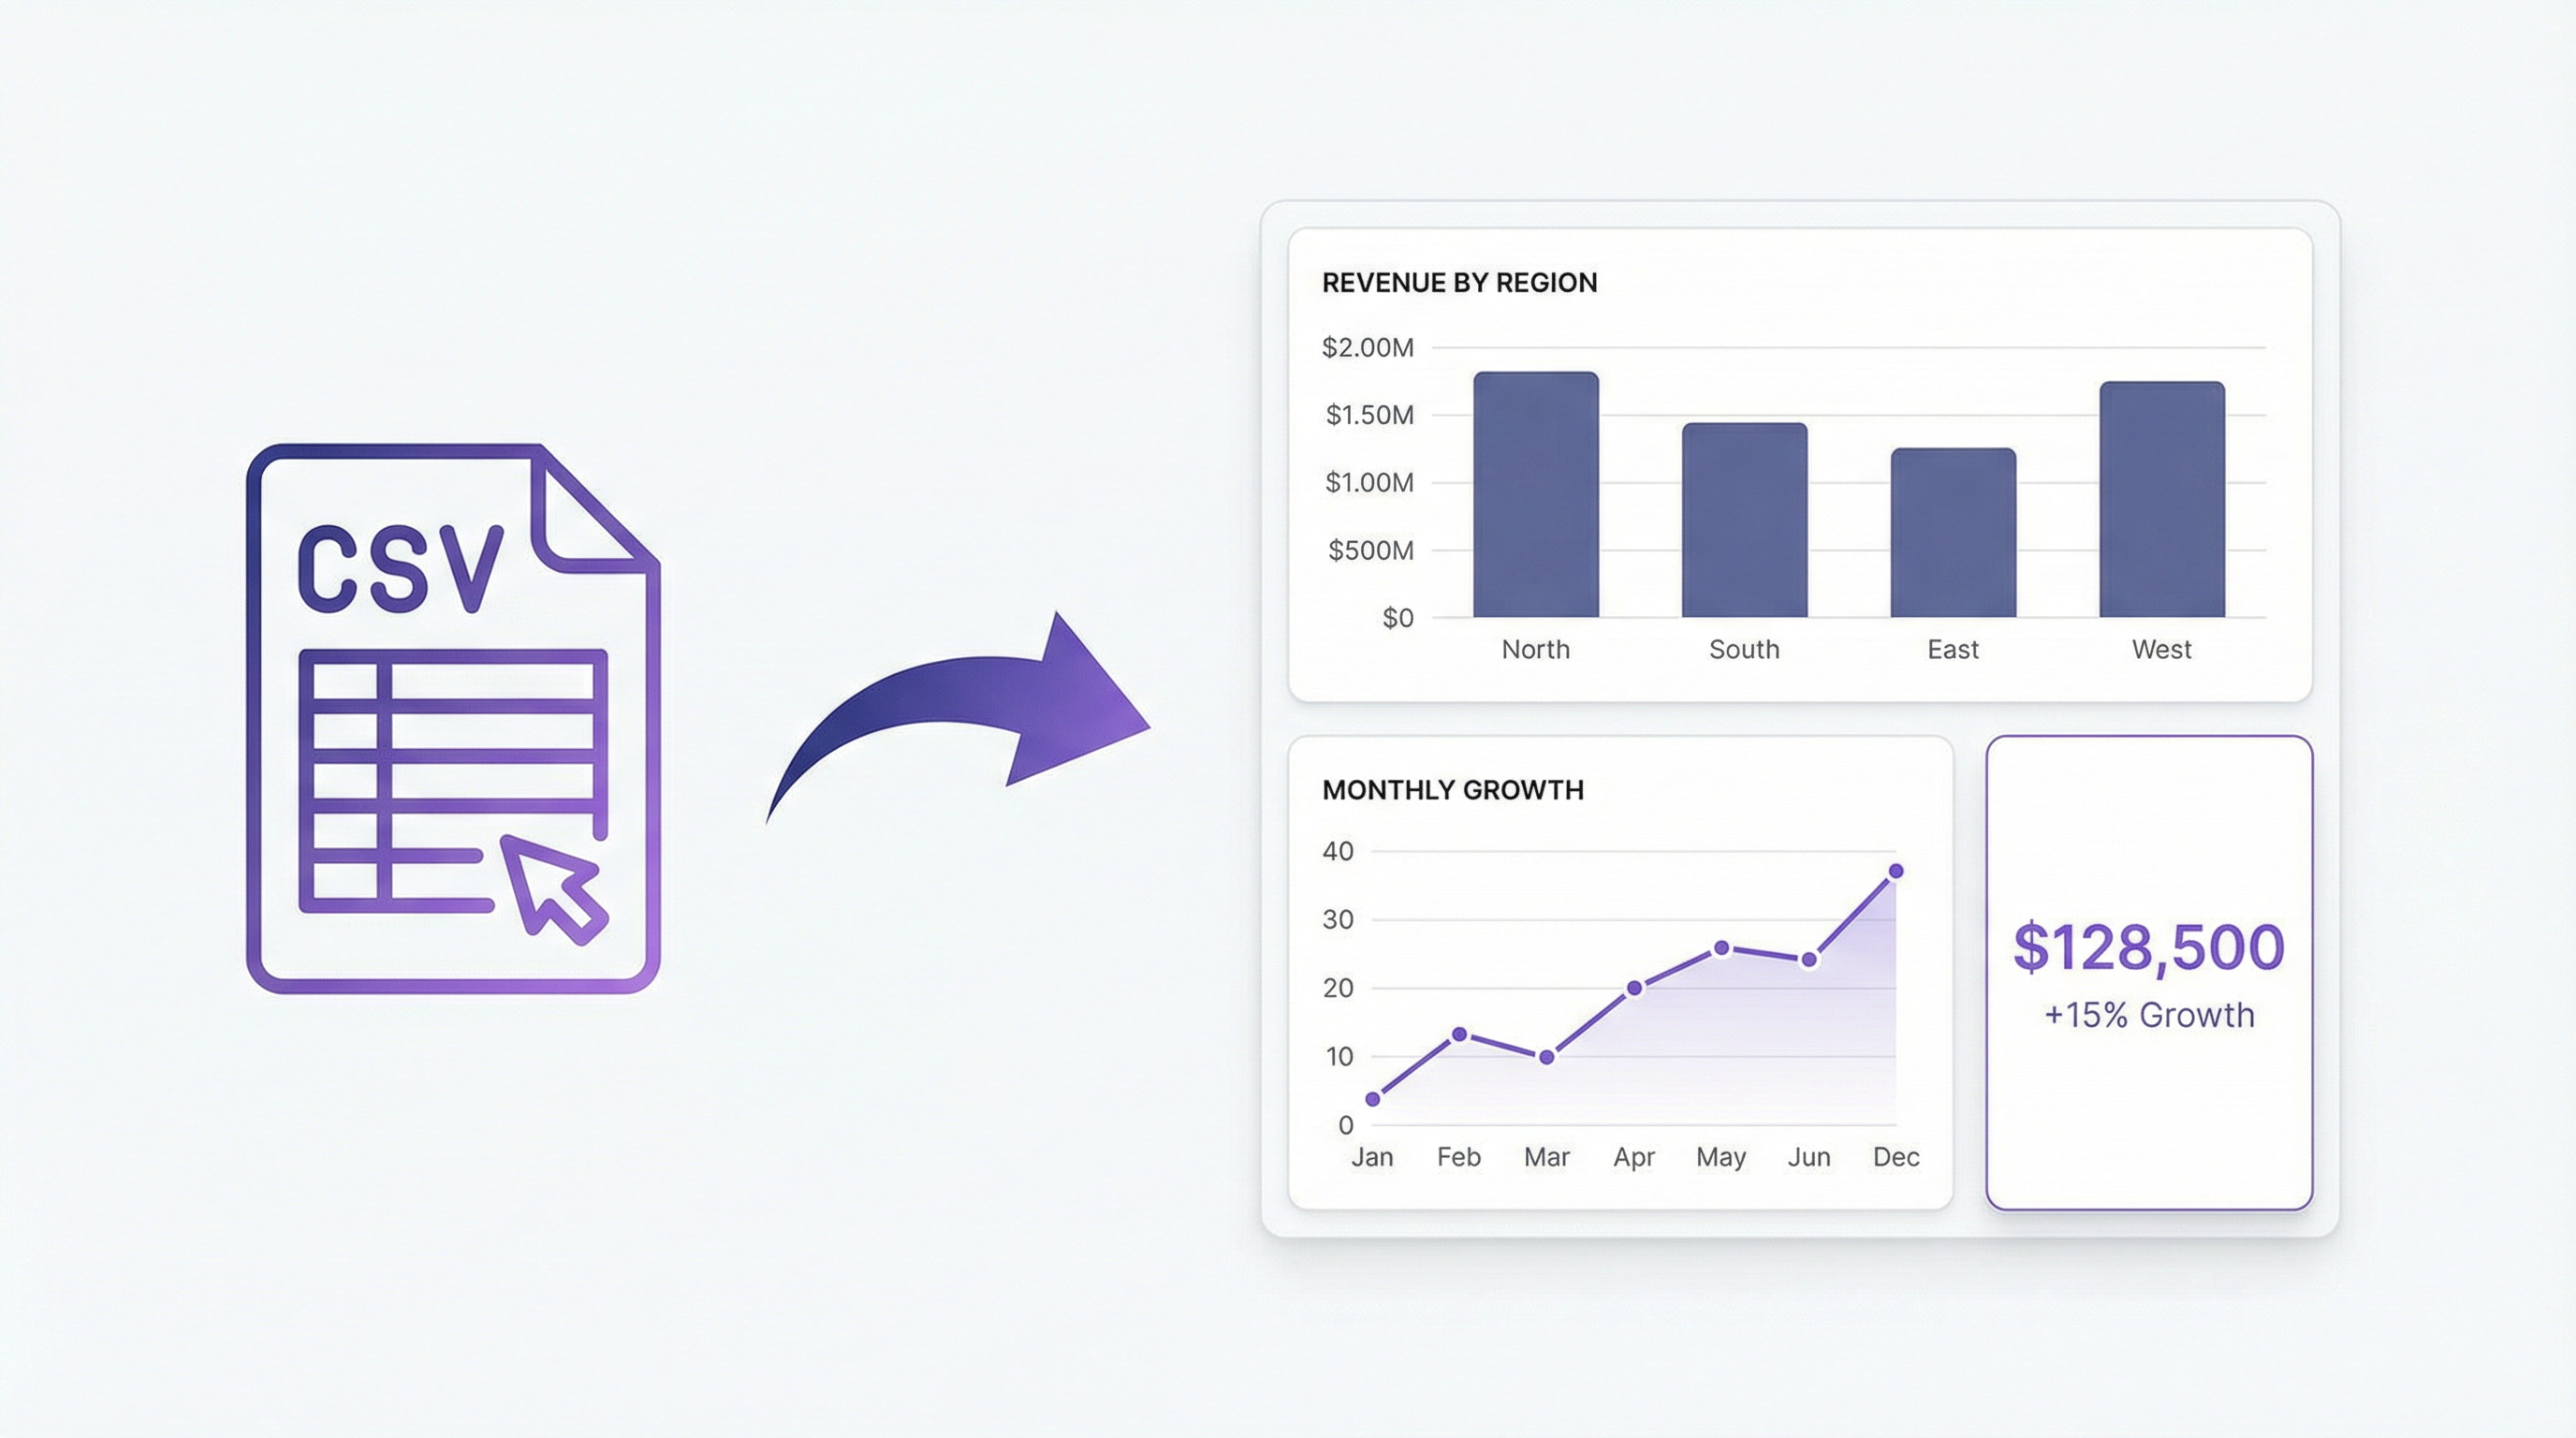
CSV to Dashboard: Visualise Any Data File in Seconds
Guide
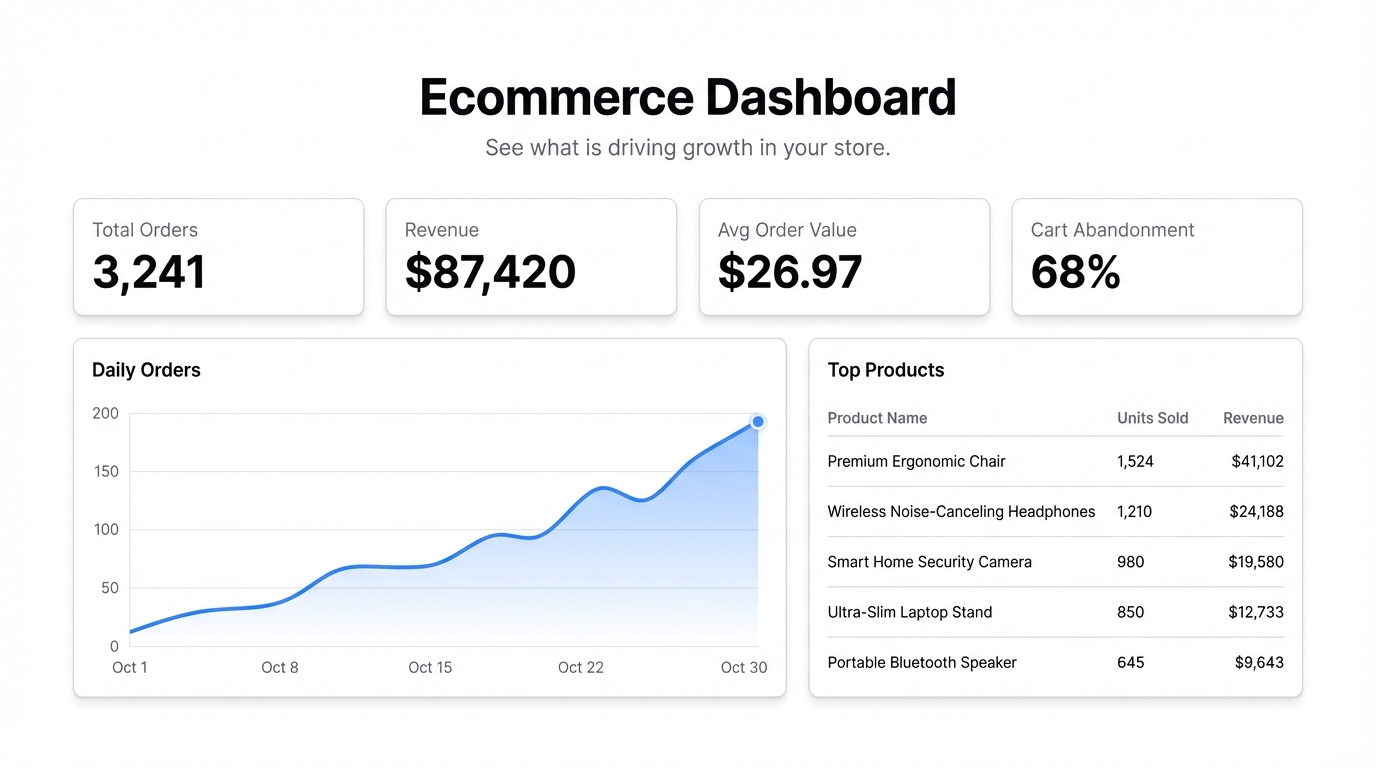
How to Build an Ecommerce Dashboard from Your Store Data
Guide
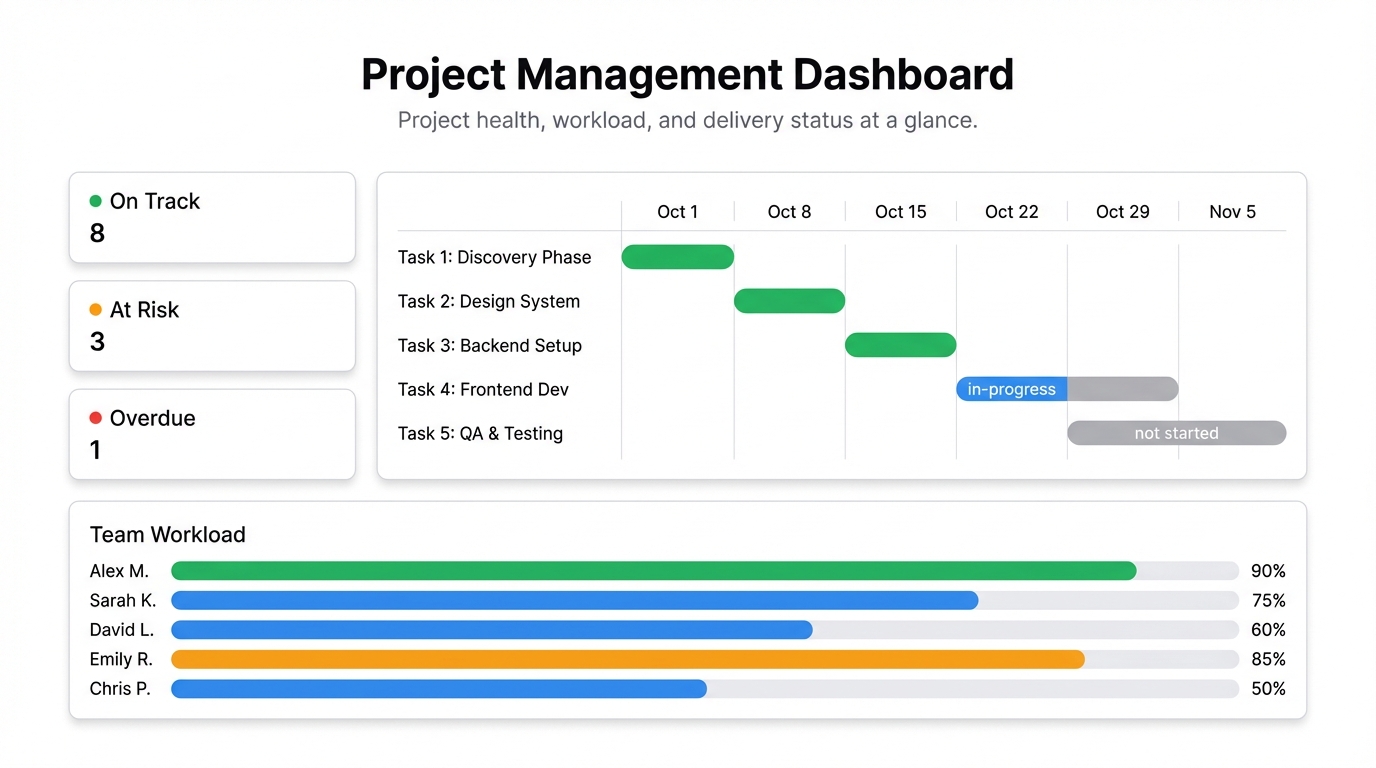
Build a Project Management Dashboard Without the Setup Hell
Guide
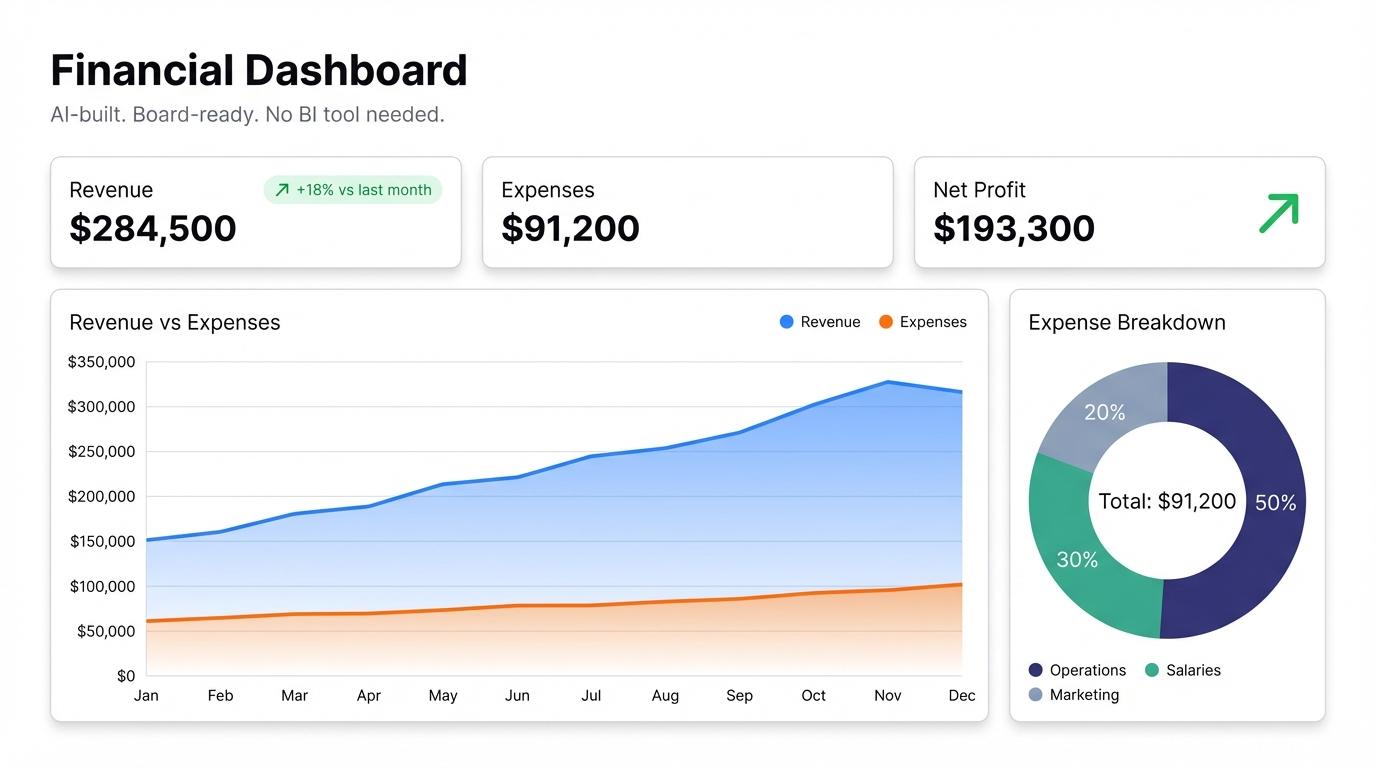
Build a Financial Dashboard with AI — No BI Tool Required
Guide
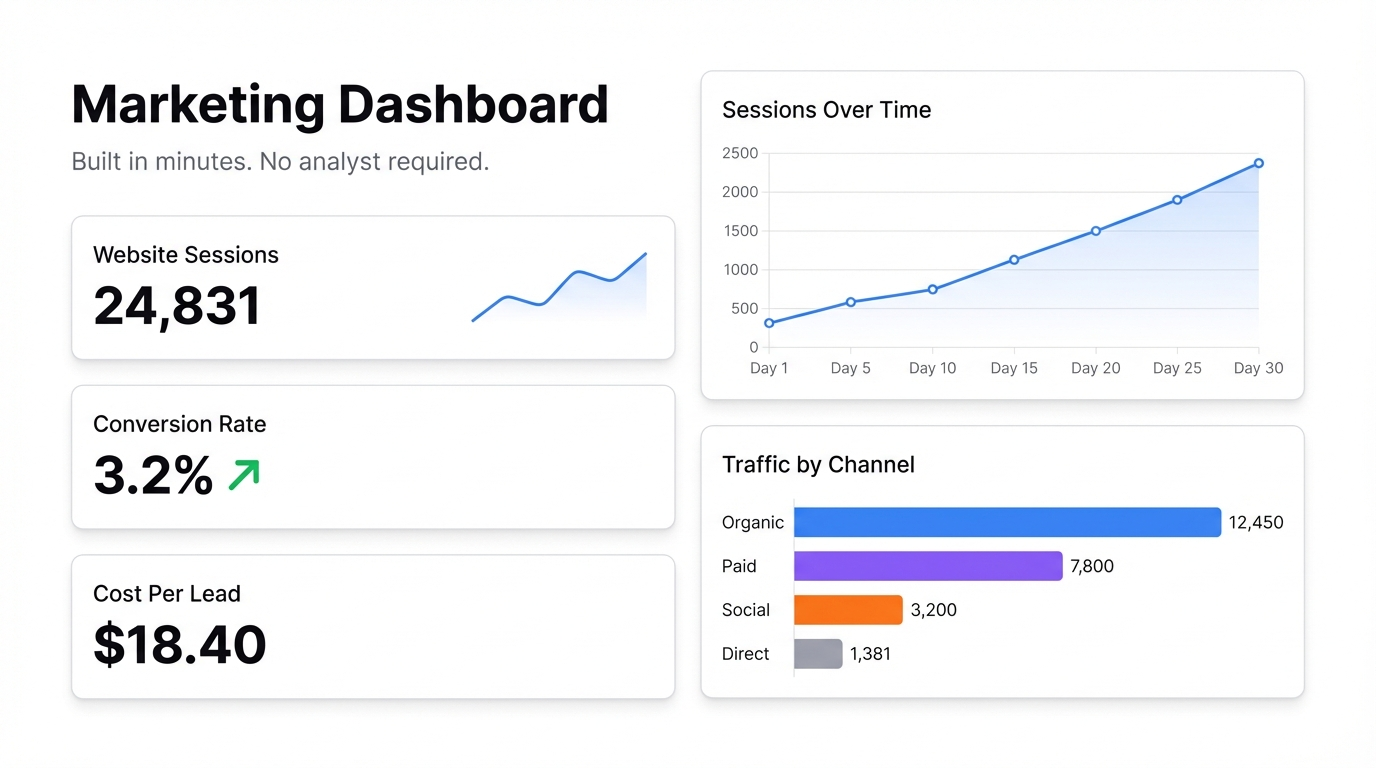
How to Build a Marketing Dashboard That Actually Shows What Matters
Guide
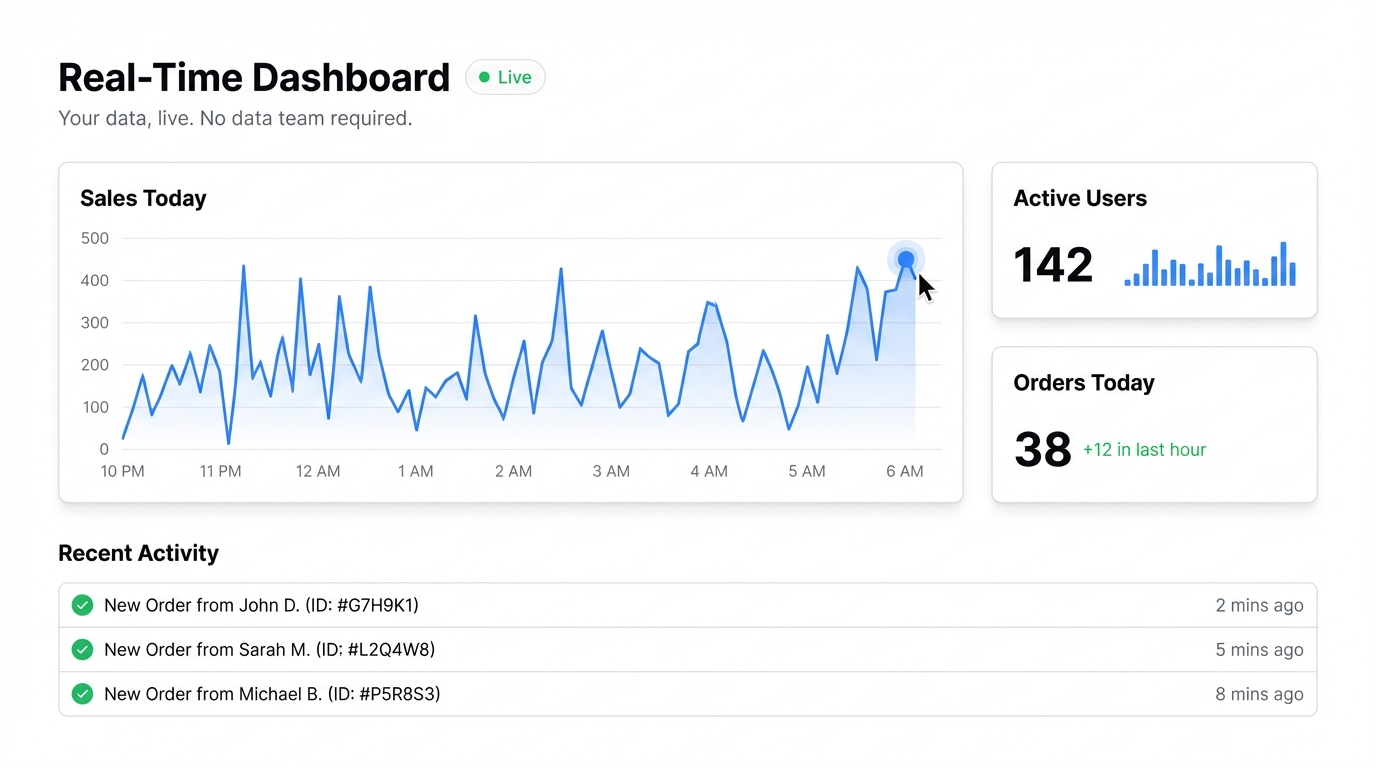
The Best Real-Time Dashboard Builder for Teams Who Don't Have a Data Team
Reports
Why Your Data Reports Are Being Ignored (And How to Fix It)
Feature
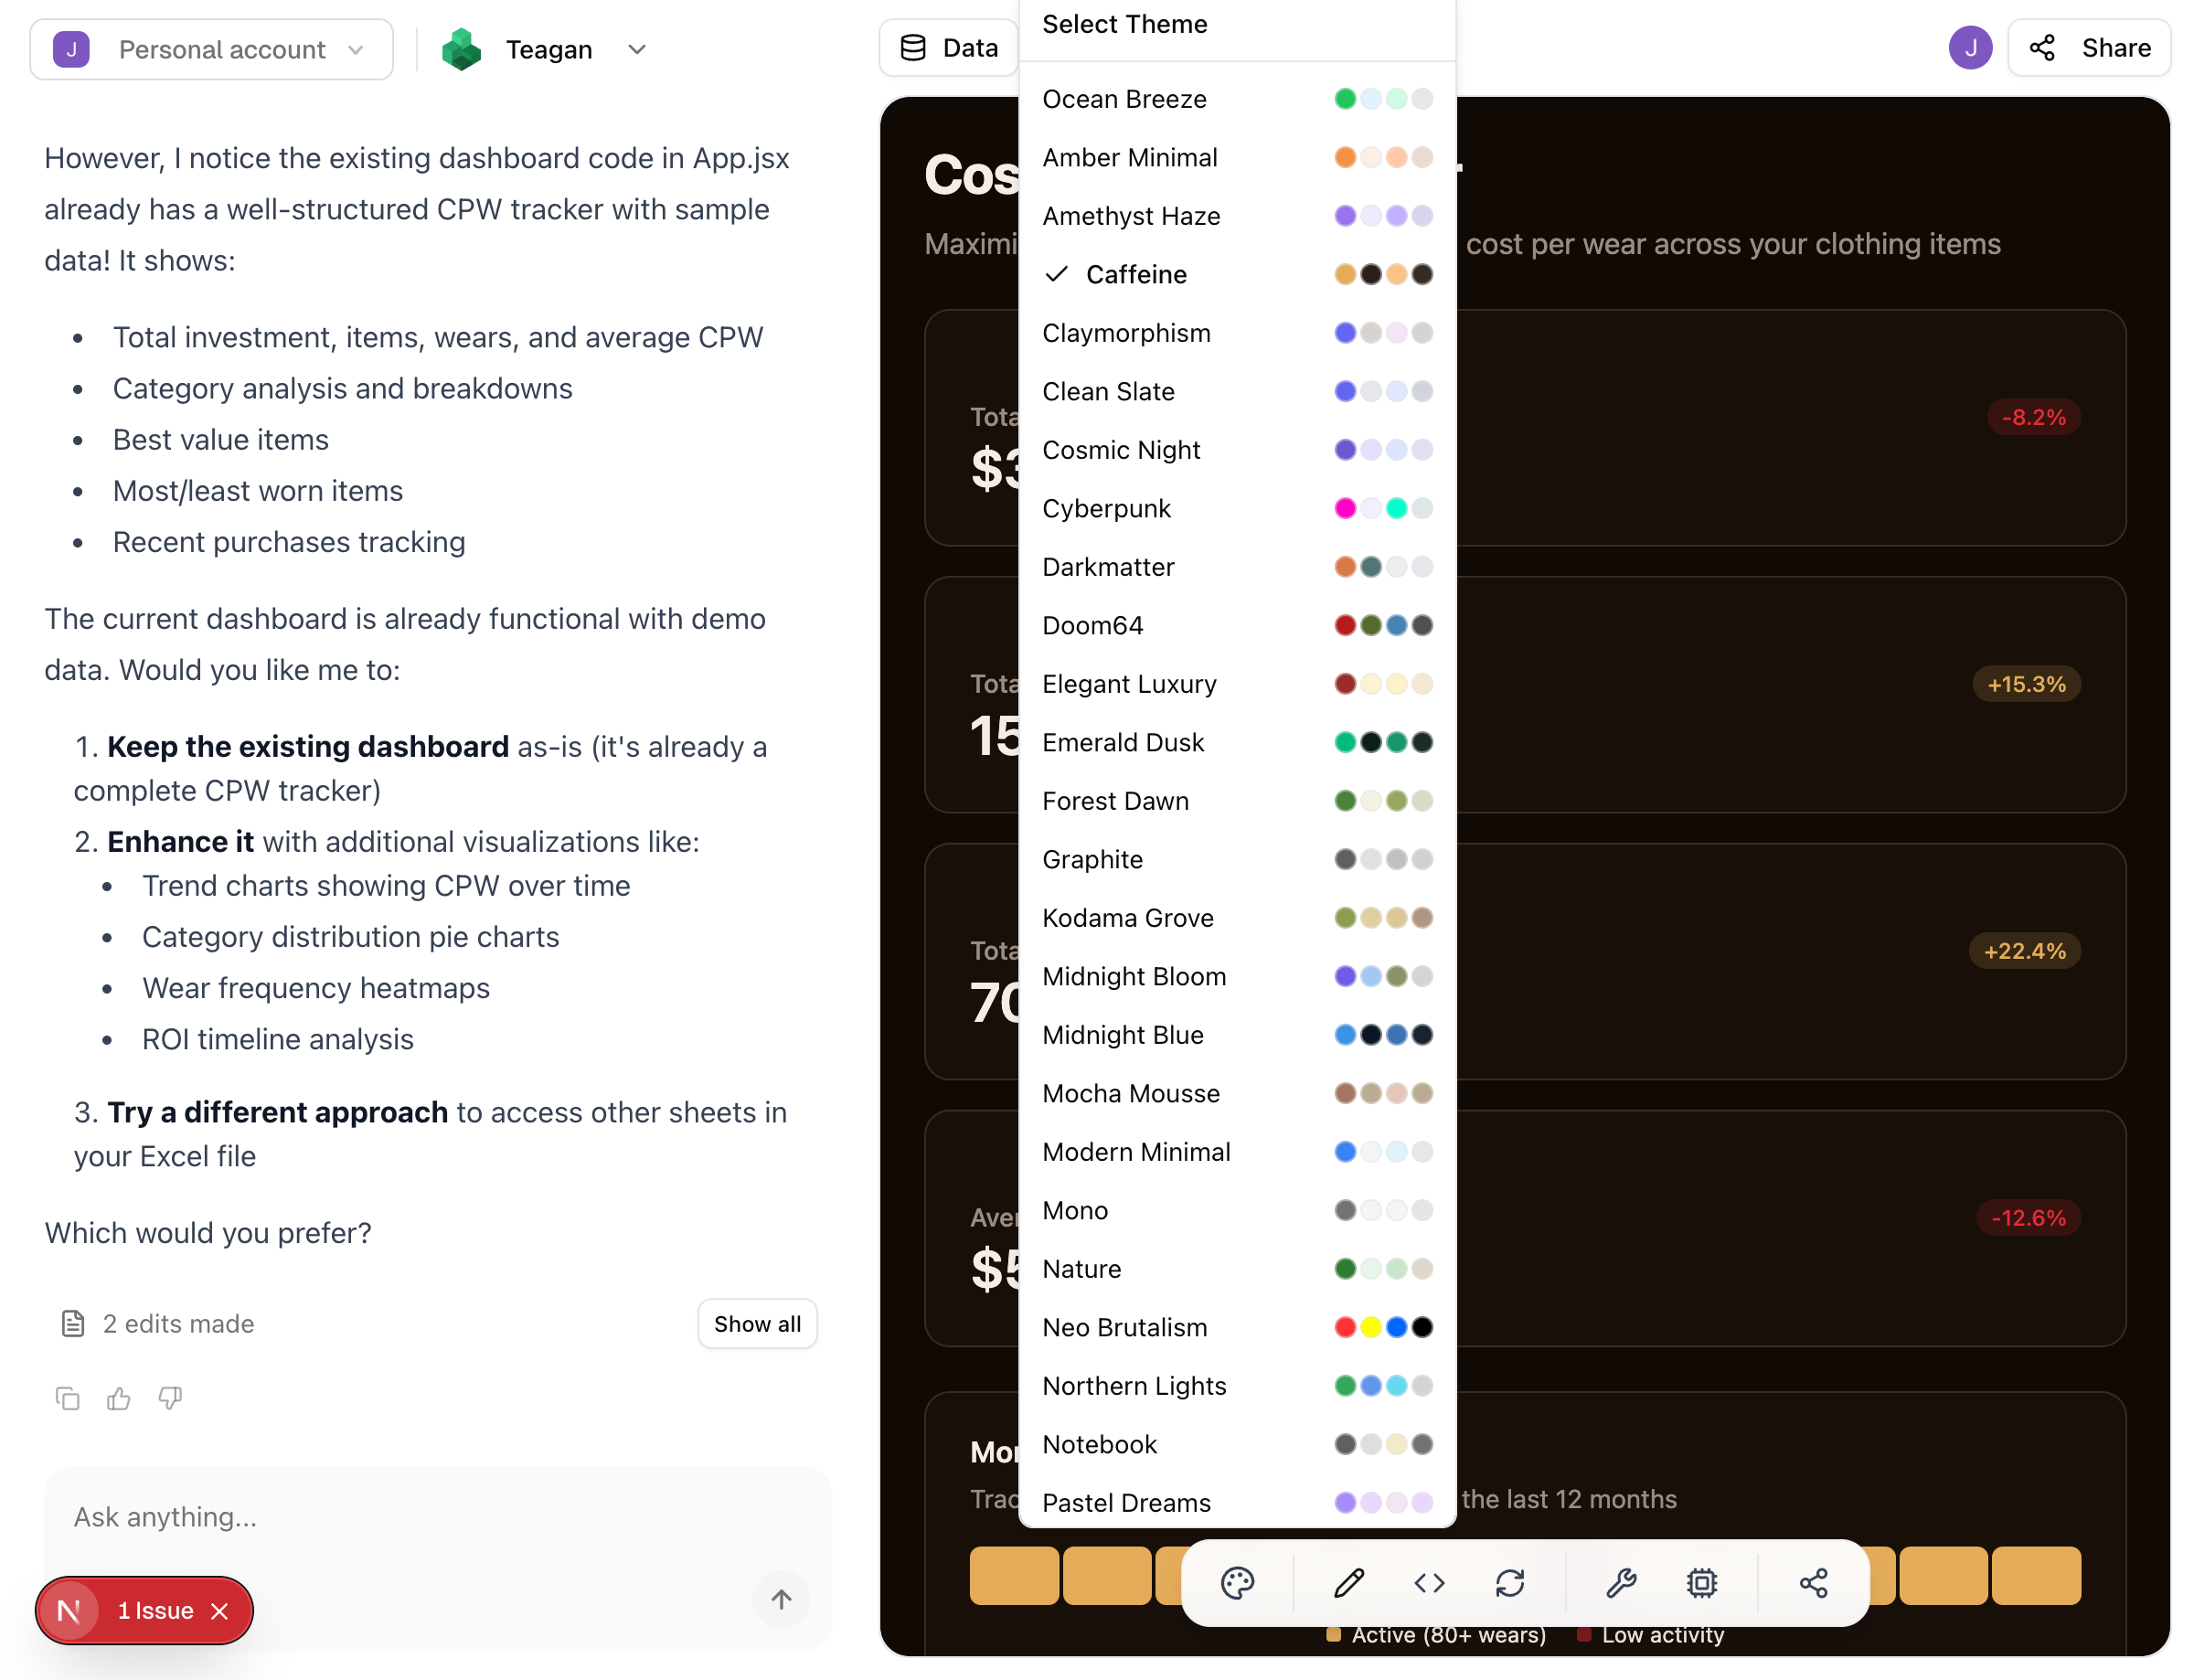
New: 43 Dashboard Themes You Can Switch in One Click
Dashboards
How to Turn Any Spreadsheet into a Live Dashboard
Design
5 Dashboard Design Principles That Actually Matter
Google Sheets