You know which numbers matter. Revenue, churn, conversion rate, active users. The problem isn’t knowing your KPIs — it’s turning them into something you can actually look at every day.
Traditional dashboard tools make this harder than it should be. Drag columns into chart builders. Pick chart types. Format axes. Choose colors. Connect your data source and hope it doesn’t break when your schema changes. Then do it again for every metric.
There’s a faster way.
What a KPI Dashboard Actually Needs to Do
A KPI dashboard has one job: show you whether things are going up or down, and why. That’s it.
The best ones have three characteristics:
Live data. A dashboard showing yesterday’s numbers that you manually exported this morning is not a dashboard — it’s a screenshot. Real KPI dashboards pull from your actual data source and update automatically.
The right level of detail. Top-line numbers at a glance. Drill-down available when something looks wrong. Not everything at once.
Easy to share. If you’re the only person who can read the dashboard, it’s not doing its job. Your team, your investors, your clients — they should be able to see it without a tutorial.
Building a KPI Dashboard with AI
Here’s how to build a proper KPI dashboard using Infograph. The whole thing takes less time than a standup meeting.
1. Connect Your Data
Infograph connects directly to Google Sheets and Excel Online. If you track your KPIs in a spreadsheet — most teams do — you link it once and the dashboard stays live. No re-uploading when numbers change.
If your data lives in a CSV file, upload it directly. Sales exports, analytics reports, CRM downloads all work.
2. Describe Your Dashboard
Instead of selecting chart types and dragging fields, describe what you want:
“Show me monthly recurring revenue, broken down by plan. Add a line chart for growth over the last 12 months. Include a summary card for total active customers.”
That’s not pseudocode. That’s the actual prompt. Infograph reads your data structure, maps which columns correspond to which metrics, and builds the dashboard.
3. Iterate in Plain English
Once the initial dashboard is built, keep prompting. “Make the revenue chart compare this month to last month.” “Add a churn rate card.” “Break down active users by country.”
Every prompt refines what you see. You’re not fighting a chart builder — you’re having a conversation with your data.
4. Share It
When the dashboard looks right, hit publish. Share publicly, lock behind a password, or restrict to people inside your team account.
The share link is always live. When the underlying data changes, the dashboard updates. Your team sees the same numbers you do — no re-exporting, no re-sending.
What Good KPI Dashboards Look Like
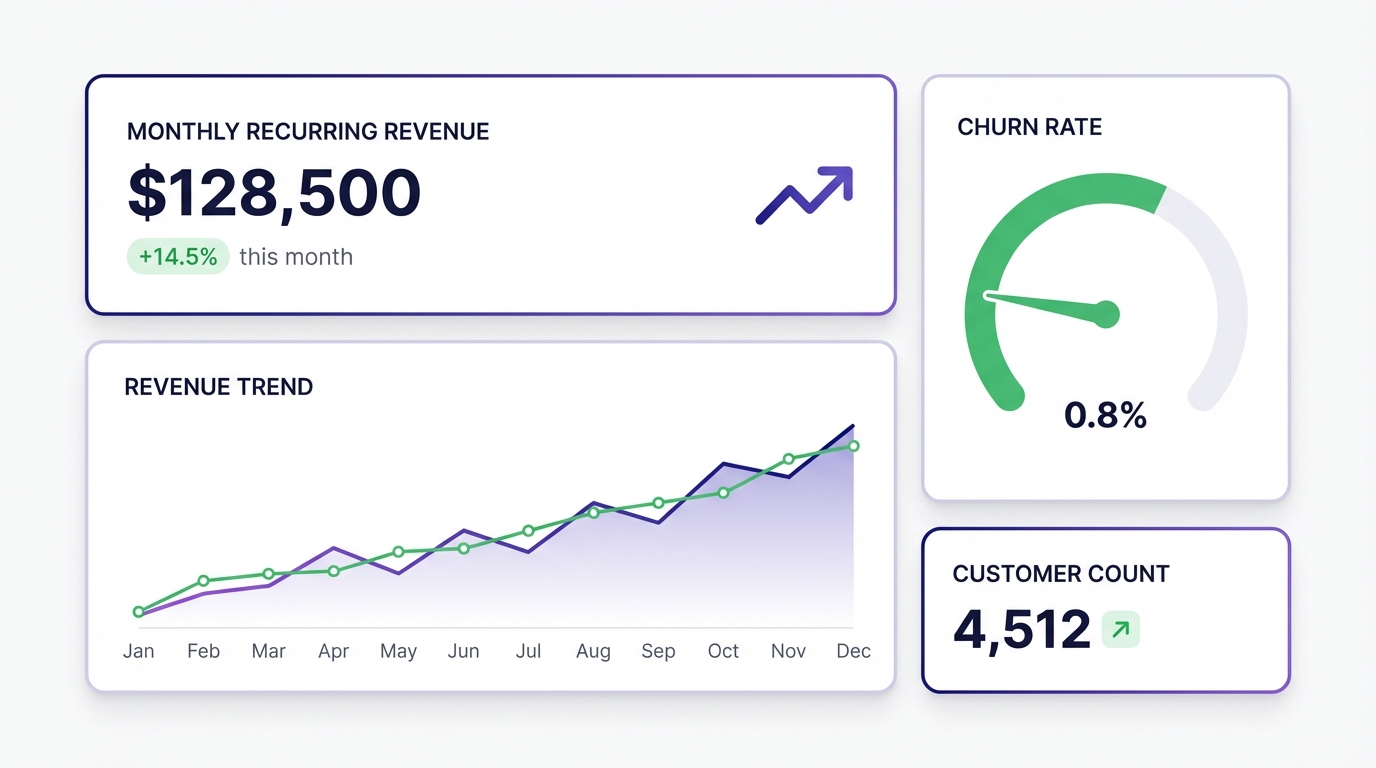
SaaS metrics dashboard: MRR, ARR, churn rate, new signups, active users — pulled from a Google Sheet the billing system exports to automatically. Updates daily.
Marketing performance dashboard: Impressions, clicks, conversion rate, cost per acquisition — uploaded from a platform export once a week. Shared with clients as a live link instead of a PDF.
Operations dashboard: Fulfilment rate, support ticket volume, average resolution time — built from a spreadsheet the ops team already maintains. No new processes, just a better view of existing data.
The common thread: all of them start with data that already exists somewhere. The dashboard is the view on top.
The Free Tier
You can build one KPI dashboard on Infograph’s free plan without a credit card. That’s enough to connect a data source, build a dashboard, and see whether it solves your problem before paying anything.
If it works, the Pro plan gives you five dashboards and live data connections for $19.99/month.


