Every sales team tracks the same things: pipeline, revenue, quota attainment, average deal size, win rate. Most teams track them in a CRM. The problem is that getting those numbers into a shareable, always-current dashboard usually involves a data analyst, a BI tool license, and a two-week wait.
There’s a version of this that takes twenty minutes.
What a Good Sales Dashboard Tracks
Before you build anything, get clear on which metrics actually matter. Most sales dashboards try to show everything and end up communicating nothing.
The metrics worth tracking:
Pipeline health. Total value in pipeline, broken down by stage. This tells you whether you have enough in the hopper to hit next quarter’s target — before it’s too late to do anything about it.
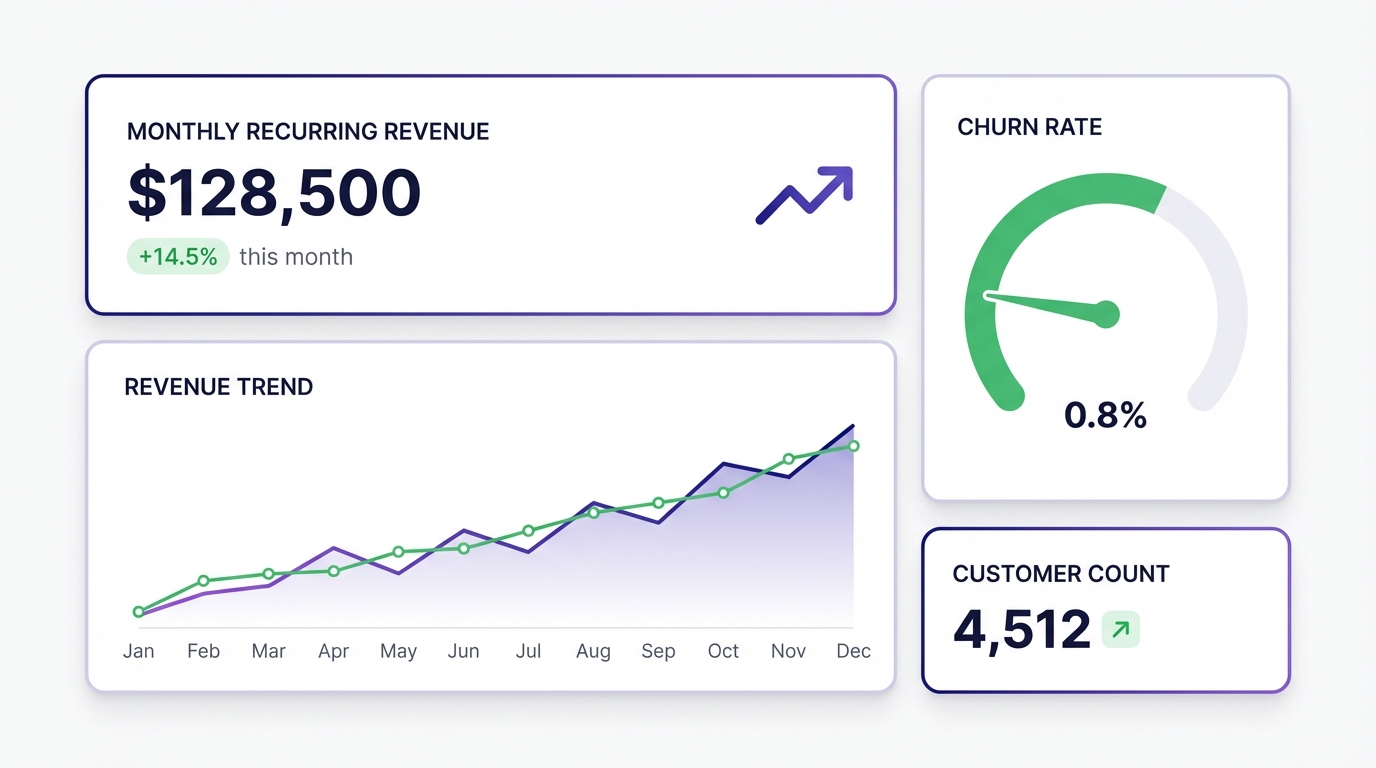
Revenue performance. Monthly or weekly revenue against target. The most basic chart, and often the most important.
Quota attainment. How each rep is performing against their individual target. This one drives behaviour — reps who can see their own number tend to pay more attention to it.
Win rate. Deals closed divided by deals worked. Flat win rates with growing pipeline is a good problem. Falling win rates with flat pipeline is a bad one.
Average deal size and sales cycle length. If these are moving, something upstream has changed — either in the market or in your sales motion.
You don’t need all of these on day one. Start with three or four that your team actually makes decisions from.
Building a Sales Dashboard with Infograph
Most sales teams already have their data in a spreadsheet — either a CRM export or a manually maintained tracker. That’s all you need to get started.
Step 1: Get Your Data Out
Export your sales data as a CSV from your CRM, or use your existing Google Sheet or Excel tracker. Infograph works with both.
If you’re using a Google Sheet, you can connect it directly — changes to the sheet will update the dashboard automatically, which matters for something you’re checking daily.
Step 2: Connect to Infograph
Upload your CSV or connect your spreadsheet. Infograph reads the columns and understands the data structure — you don’t need to map fields or configure anything.
Step 3: Describe What You Want
Type what you want to see:
“Show total pipeline value by stage as a funnel chart. Add a line chart for monthly revenue over the last 6 months. Include rep quota attainment as a bar chart.”
Infograph builds those charts from your data. If a column name doesn’t match what you described, it figures out the closest match and builds it anyway.
Step 4: Refine and Add
Keep prompting to add or change what you see. “Group the pipeline by rep instead of stage.” “Add a win rate card for this quarter.” “Change the revenue chart to show weekly instead of monthly.”
Step 5: Share It
Hit publish. Your sales dashboard is now a live link you can share with your team, your management, or embed in a Notion page. When the underlying data updates, the dashboard updates.
Sales Dashboard Examples
A few common configurations:
Weekly sales standup dashboard. Pipeline by stage, new deals this week, revenue to target, top 5 deals by value. Shared on the TV in the sales office. Updates from the team’s shared Google Sheet every morning.
Rep performance review. Individual quota attainment, deals by stage, average deal size, deals closed this month. Built for monthly one-on-ones — each rep has their own version.
Quarterly business review. Revenue vs target for the quarter, pipeline forecast, win rate trend, average sales cycle. Built from a CRM export and shared with leadership.
All of these start with data that already exists. The dashboard is the layer on top that makes it readable.
The Free Tier
Build your first sales dashboard on Infograph’s free plan — no credit card required. One dashboard, live connection, full sharing capabilities.
If it works, Pro gives you five dashboards and live Google Sheets and Excel connections for $19.99/month.