Operations teams run on spreadsheets. Fulfillment rates in one tab, support ticket volume in another, inventory levels in a third. Every morning someone manually copies numbers into a slide deck or email, and by the time it’s read, the data is already stale.
An operations dashboard fixes that. One screen, live data, no more morning copy-paste routines.
Here’s how to build one without a data engineer or a BI tool license.
What an Operations Dashboard Should Show
The goal is operational visibility — knowing when something is off before it becomes a problem. That means tracking leading indicators, not just outcomes.
The metrics worth including:
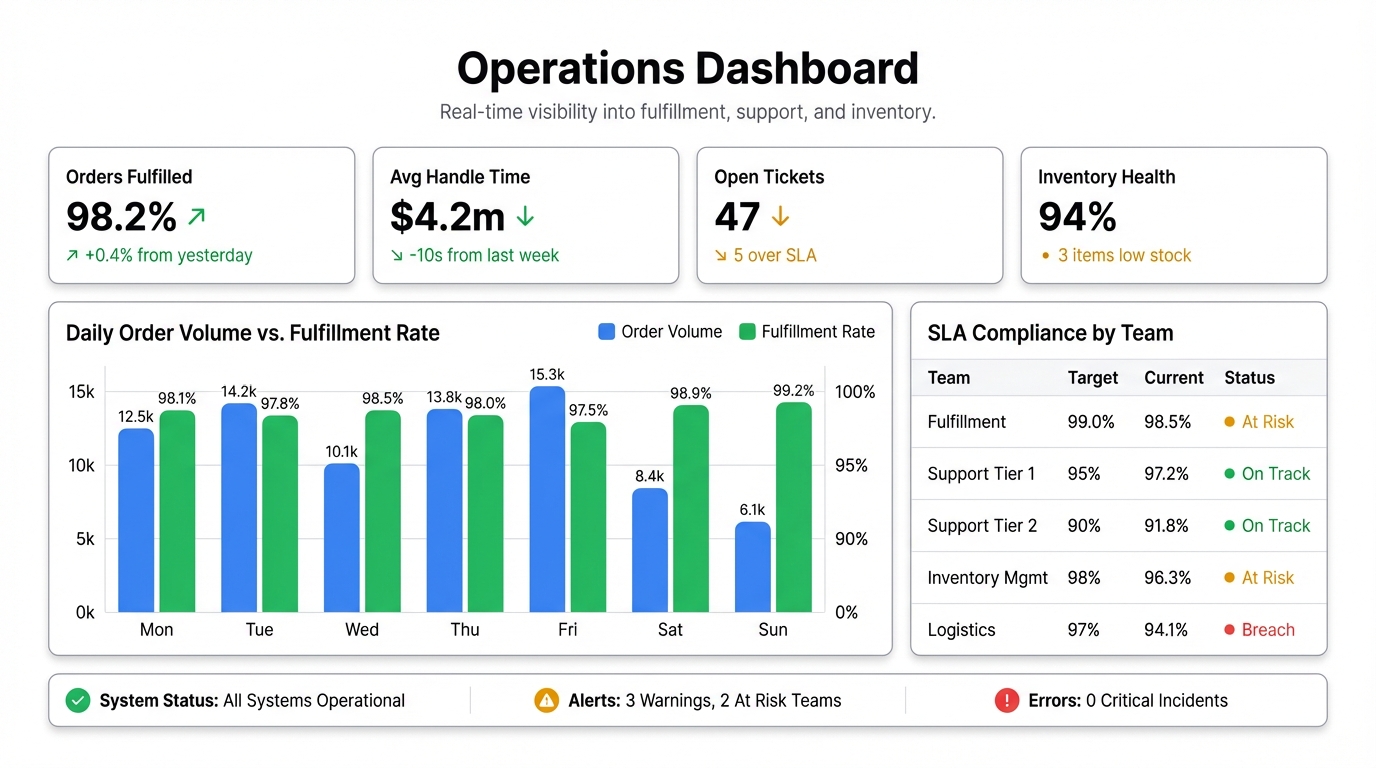
Fulfillment and delivery. On-time delivery rate, order fulfillment cycle time, backlog volume. These tell you whether your operations are keeping up with demand or falling behind.
Support and service. Ticket volume, first response time, resolution time, SLA compliance rate. If support is degrading, customers feel it before finance does.
Inventory. Stock levels by SKU or category, days of supply, stockout frequency. For physical operations, this is the heartbeat metric.
Team and capacity. Active tasks, completion rate, overdue items. Useful if you’re managing a team where workload visibility matters.
You don’t need all of these on day one. Pick the three or four that your team actually makes decisions from, and build around those.
The Problem with Spreadsheet-Based Operations Reporting
Most ops reports are built in Excel or Google Sheets by someone who exports data from five different systems, pastes it together, and emails a PDF. The process takes an hour. The report is obsolete by the time it lands.
The deeper problem: when the report is manual, it only happens weekly. That means you’re making daily decisions without daily data. Issues that should be caught on Tuesday get spotted on Friday.
A live operations dashboard changes the cadence. When your team can see the numbers in real time, problems surface immediately.
Building Your Operations Dashboard with Infograph
If your operations data lives in spreadsheets — and most does — you can build a live dashboard without writing a single line of code.
Step 1: Consolidate Your Data
Identify where each metric lives. The most common sources for operations data:
- Google Sheets or Excel Online — manual trackers your team already maintains
- CRM or helpdesk exports — CSV downloads from Zendesk, HubSpot, Salesforce
- WMS or ERP exports — most warehouse and inventory systems can export to CSV
If you have a Google Sheet that multiple team members update, you can connect it directly to Infograph. The dashboard will reflect changes as soon as they’re made.
If your data is in separate files, combine the key metrics into a single spreadsheet first. This takes 20 minutes and makes the dashboard cleaner.
Step 2: Connect to Infograph
Upload your CSV or connect your Google Sheet or Excel file. Infograph reads the structure of your data automatically — column names, data types, relationships between fields. You don’t need to configure anything.
Step 3: Describe What You Want
Tell Infograph what to build in plain English:
“Show daily fulfillment rate as a line chart over the last 30 days. Add a summary card for total orders this week. Include a bar chart for support ticket volume by category.”
The AI maps your column names to the request and builds the charts. If a column name is ambiguous, it makes a reasonable interpretation — you can adjust it with a follow-up prompt.
Step 4: Add Context and Refine
Once the initial dashboard is built, keep going. “Add an SLA compliance percentage for this month.” “Break the fulfillment chart down by region.” “Highlight any days where the on-time rate dropped below 95%.”
Each prompt refines what you see. You’re iterating toward the dashboard your team actually needs, not the one that was easiest to configure.
Step 5: Share It
Publish the dashboard and share the link with your team. If you used a live Google Sheets connection, the numbers update automatically when the sheet changes. No re-exporting, no resending, no stale data in email.
For ops reviews and leadership meetings, this replaces the manually compiled slide deck entirely.
The Free Tier
You can build one operations dashboard on Infograph’s free plan — no credit card required. Connect a data source, build the dashboard, share it with your team. If it works, the Pro plan gives you five dashboards and live connections for $19.99/month.


