Every finance team has the same nightmare: it’s the 25th of the month, someone asks about Q3 marketing spend, and the answer involves opening three spreadsheets, cross-referencing two bank exports, and doing arithmetic in a separate tab. Fifteen minutes later you have a number that might be right.
That’s not a budget process. That’s an archaeology project.
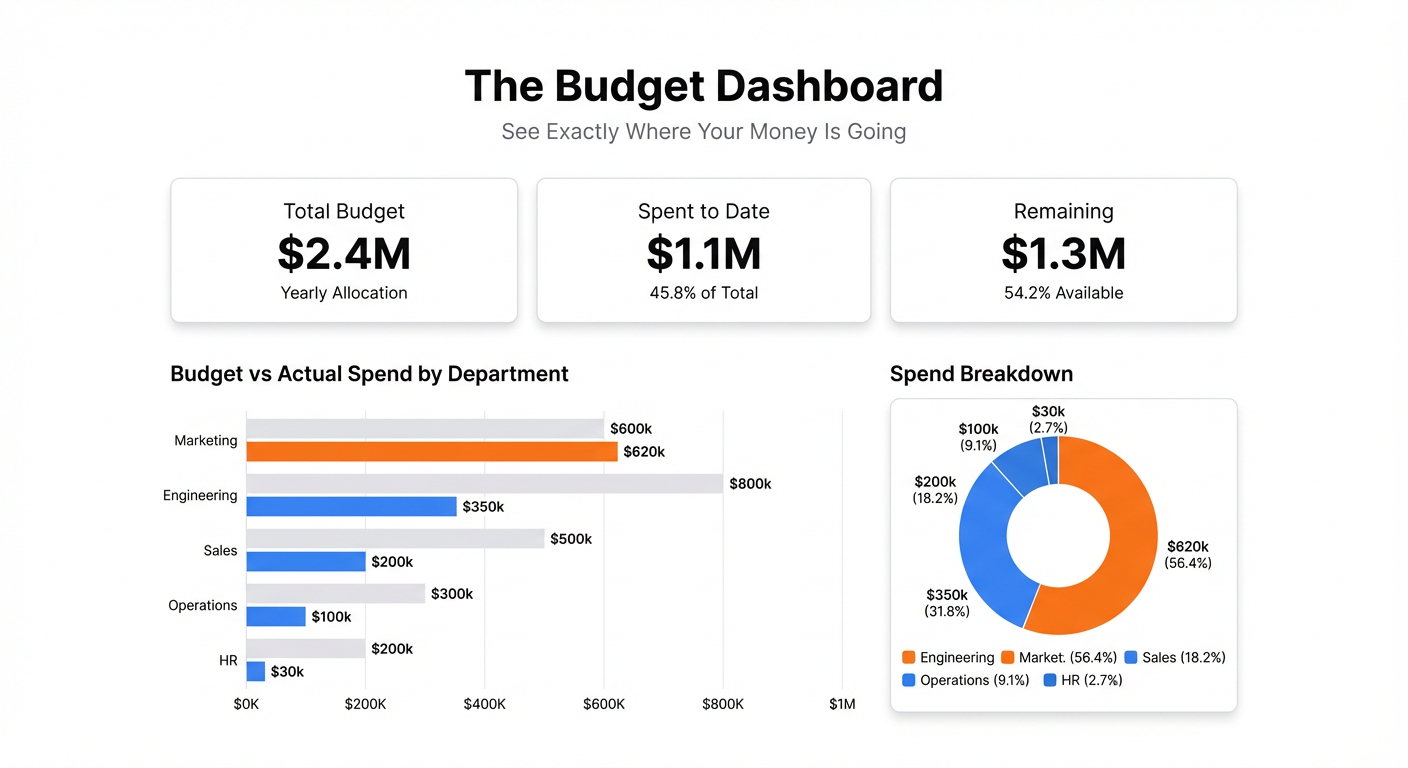
A budget dashboard replaces the archaeology with a single view: here’s what we planned to spend, here’s what we actually spent, here’s where we’re over, here’s where we have headroom. Updated as the numbers change. No detective work required.
What a Budget Dashboard Should Track
The core of any budget dashboard is the budget vs. actual comparison. Everything else builds on top of it.
Budget vs. actual by category. For each spending category — payroll, marketing, software, office, contractors — show the budgeted amount alongside actual spend to date. A simple visual gap makes overruns obvious without requiring anyone to calculate percentages.
Spend rate. Are you on track to end the month within budget? Actual spend at day 20 divided by budgeted monthly amount shows you whether you’re pacing fast or slow. This matters more than the cumulative total, because it tells you where you’ll land before the month ends.
Variance by category. Which categories are running over? By how much? Sorting by variance — largest overage at the top — lets you triage instantly instead of scanning through every line.
Cumulative spend vs. budget over time. A line chart showing actual spend and budget as two lines over the year. When actual spend stays below the budget line, you’re fine. When it crosses above, you have a problem.
Remaining budget. For each category: how much is left to spend this period. A simple card per category, updated as expenses are logged. This is the number your team actually wants to know.
Forecast to end of period. Extrapolating current spend rate to the end of the month or quarter shows whether you’re going to land over or under. This turns a budget dashboard from a historical record into a planning tool.
The Problem with Budget Spreadsheets
Budget spreadsheets work fine until they don’t. The typical breakdown:
- Actual spend lives in your accounting tool (QuickBooks, Xero, or a bank export)
- Budget lives in a separate spreadsheet that someone built in January and hasn’t been updated since
- Comparing the two requires manually pulling the actuals and pasting them in, which happens once a month if you’re lucky
- By the time you see an overrun, it’s already happened
The result is a budget process that’s always looking backward. You find out you overspent on contractors in March when you do the April reconciliation. At that point, the money is already gone.
A live budget dashboard solves this by making the comparison continuous instead of monthly.
Building Your Budget Dashboard with Infograph
Step 1: Get Your Data Into One Place
The simplest setup: a Google Sheet with two tabs. One for budget (category, monthly budget, annual budget). One for actuals (date, category, amount, description) — updated regularly from your accounting tool export or direct entry.
Most accounting tools can export a CSV of transactions. Import that into the actuals tab, clean up the category names so they match your budget categories, and you have the raw material for a dashboard.
Step 2: Connect to Infograph
Connect the Google Sheet to Infograph. Live connection means whenever you refresh your actuals from the accounting tool, the dashboard updates too. No rebuilding, no reformatting — just updated numbers.
CSV upload works if you want to start immediately and add the live connection later.
Step 3: Describe Your Dashboard
Type what you want:
“Show a budget vs. actual comparison table for each spending category this month. Add a variance column showing the difference and percentage over/under. Create a bar chart showing budget vs. actual spend by category. Add cards showing total budget, total spent, and remaining budget for the current month.”
Infograph maps your data to the right visuals. You don’t choose chart types or drag fields — you describe what you want and it builds it.
Step 4: Add Forecasting and Trends
Once the core comparison is running, add the forward-looking view:
“Add a line chart showing cumulative actual spend vs. cumulative budget over the year to date. Add a forecast card showing projected end-of-month spend based on current pace.”
These additions turn the dashboard from a rearview mirror into something you can actually plan with.
Step 5: Share It
Publish the dashboard and share it with your finance team, your department heads, your co-founder. When budget visibility is shared, conversations about spend happen before problems escalate rather than after.
For sensitive financial data, restrict access using Infograph’s team features — share only with specific team members, not publicly.
Budget Dashboards for Different Contexts
The same structure applies across different types of budgets, with minor variations:
Startup budget dashboard. Focus on burn rate and runway alongside the budget vs. actual. For founders, the question is always “how many months do we have?” — make sure that number is front and center.
Department budget dashboard. One view per department, showing that team’s categories and spend. Department heads see their own numbers without needing access to the full company budget.
Project budget dashboard. Track spend against a fixed project budget. As the project progresses, the dashboard shows percentage of budget consumed versus percentage of project complete — the key ratio for catching scope creep early.
Quarterly planning dashboard. Three months at a time, with monthly breakdowns. Useful for board reporting — shows Q3 actuals in context without overwhelming detail.
The Metrics That Actually Change Behavior
Raw spend numbers are informative. But the metrics that actually change how people make decisions are the forward-looking ones:
Days until budget exhausted. At current spend rate, when does the remaining budget hit zero? If the answer is “day 22 of 31,” someone needs to slow down now.
Categories trending over. Which spending lines are growing month-over-month in ways that weren’t planned? Growing software costs or contractor spend often signals something structural that needs addressing.
Last-month vs. this-month comparison. Are we spending more or less than the same period last month? Directional context matters as much as absolute numbers.
Add these to the core budget vs. actual view and the dashboard stops being a reporting tool. It becomes the instrument your team uses to actively manage spend.
Start Free
Build your first budget dashboard on Infograph’s free plan — no credit card required. Upload your budget and actuals data, describe the dashboard you want, and have a working view in minutes.
Pro plan adds live Google Sheets connections and multiple dashboards — the right fit when you’re tracking budgets across departments or projects.


