Nonprofit reporting pulls in three directions at once: donors want to see their impact, program managers need budget visibility, and leadership needs the full picture. A nonprofit dashboard brings all of that together without requiring three separate reports.
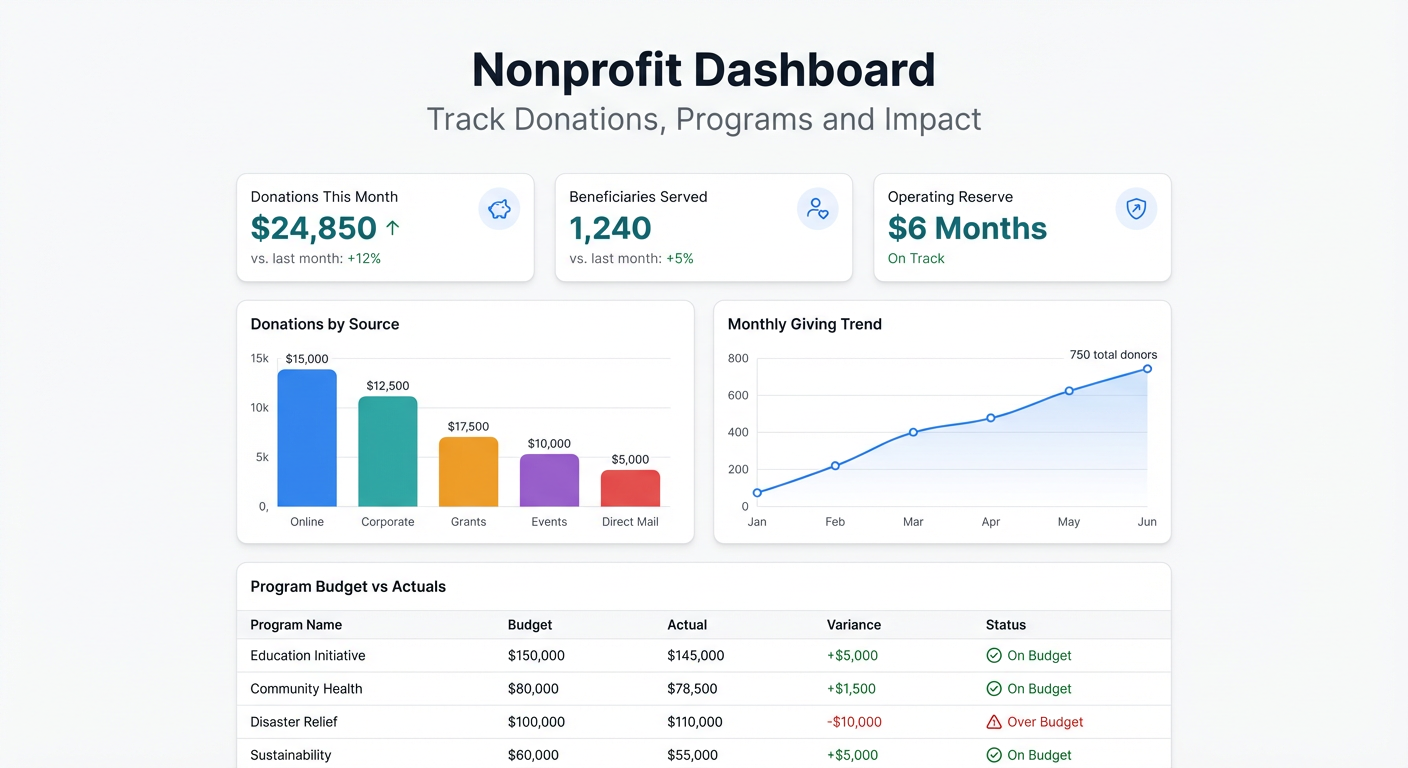
This is what a well-built nonprofit dashboard looks like, what to track, and how to build one from your existing data.
What Goes on a Nonprofit Dashboard
Fundraising Metrics
Donations are the oxygen. Track these on every nonprofit dashboard:
- Total donations this period vs prior period
- Donor count — new vs returning
- Average gift size — this tells you more about donor health than total raised
- Donation by source — events, direct mail, online, major gifts, grants
- Monthly recurring revenue — if you have a sustainer program, this is your baseline
If you run campaigns, add a campaign tracker: goal, raised to date, percentage complete, days remaining. A simple progress bar communicates urgency better than a number alone.
Program Metrics
Every program should have at least one outcome metric — something that tells you whether the work is actually working.
Track by program:
- Beneficiaries served (this period and cumulative)
- Budget allocated vs actual spend
- Program cost per beneficiary — essential for grant reporting
- Completion rate or milestone progress
A side-by-side comparison of all active programs immediately surfaces which ones are on track and which need attention.
Budget and Financial Health
Nonprofits run on thin margins. Your dashboard should show:
- Operating reserve — how many months of expenses are covered by unrestricted funds
- Revenue vs expenses by month — trending in the right direction?
- Restricted vs unrestricted funds balance
- Grant utilization rate — are restricted funds being spent within reporting windows?
If you’re burning through reserves faster than your fundraising pace, that’s a dashboard problem: leadership needs to see it before it becomes a crisis.
Board Reporting View
Boards typically need a simplified version — fewer numbers, more context. Consider a separate board summary view that shows:
- Year-to-date revenue vs budget
- Headcount and key program stats
- Any flagged risks (reserves below 3 months, major grant expiring)
Building Your Nonprofit Dashboard
Most nonprofits keep their data in a combination of spreadsheets, donor CRMs (DonorPerfect, Bloomerang, Salesforce NPSP), and accounting software (QuickBooks, Xero). Getting this into a single dashboard has traditionally required either heavy IT work or accepting that the dashboard is always slightly out of date.
Option 1: Build in Google Sheets
If all your data is in spreadsheets, Google Sheets can work as a dashboard layer. Export monthly data, run SUMIF and pivot tables, build charts manually. It works but needs regular maintenance — someone has to own the data update cycle.
Option 2: Use Infograph
If your data lives in Google Sheets or Excel Online, Infograph connects directly and builds the dashboard from a prompt.
Connect your spreadsheet, describe what you want: “Show monthly donations by source, beneficiaries served by program, budget vs actuals by category, and operating reserve in months.” The dashboard builds automatically and updates when your data updates.
For nonprofits with small teams and no dedicated data staff, this changes what’s possible. Instead of spending a day building a board deck, you share a link.
Example: What a Nonprofit Dashboard Prompt Looks Like
Here’s the kind of prompt that builds a solid nonprofit dashboard in Infograph:
“Show total donations this month vs last month, donor count new vs returning, top 5 donation sources as a bar chart, program spend vs budget for each program, beneficiaries served by month as a line chart, and current operating reserve in months.”
That single prompt produces a dashboard that would take most analysts a full day to build in Excel.
Sharing Your Dashboard
A nonprofit dashboard is only useful if people actually see it. Build-in sharing options matter:
- Board link — read-only, no login required, auto-updates
- Staff view — program managers see their own program data
- Donor impact report — a stripped-down public version showing program outcomes
With Infograph, all three are possible from a single dashboard. Set visibility to public, password-protected, or team-only depending on the audience.
The Data Story Your Dashboard Tells
The most powerful thing a nonprofit dashboard does is make the impact visible — not just to funders, but to your own team. When program staff can see in real time that they’ve served 847 families this quarter and that the food pantry program is at 94% of its annual goal, they feel the momentum differently than if they’re waiting for a quarterly report.
Numbers in context change behavior. That’s the point.
Build your nonprofit dashboard and share the impact that’s already happening. Start at app.infograph.ai.