A hospital in the UK ran out of beds on a Tuesday afternoon and didn’t know until the ER charge nurse walked the floor. The data was there — in the EMR, in the scheduling system, in three separate spreadsheets that hadn’t been updated since Monday. The problem wasn’t data. It was visibility.
That’s the healthcare data problem in one sentence: everything is tracked, nothing is connected, and by the time it reaches someone who can act on it, it’s already too late.
A healthcare dashboard fixes that. Not a static report emailed on Fridays. A live view of what’s happening right now — bed occupancy, patient wait times, staff-to-patient ratios, billing status — pulled together in one place and updated as it changes.
What a Healthcare Dashboard Actually Tracks
Most hospitals already have the data. It’s scattered across an EMR, a workforce management system, a billing platform, and a handful of Excel files owned by different department heads. A dashboard doesn’t generate new data. It pulls it together and makes it readable.
The metrics worth tracking fall into four buckets:
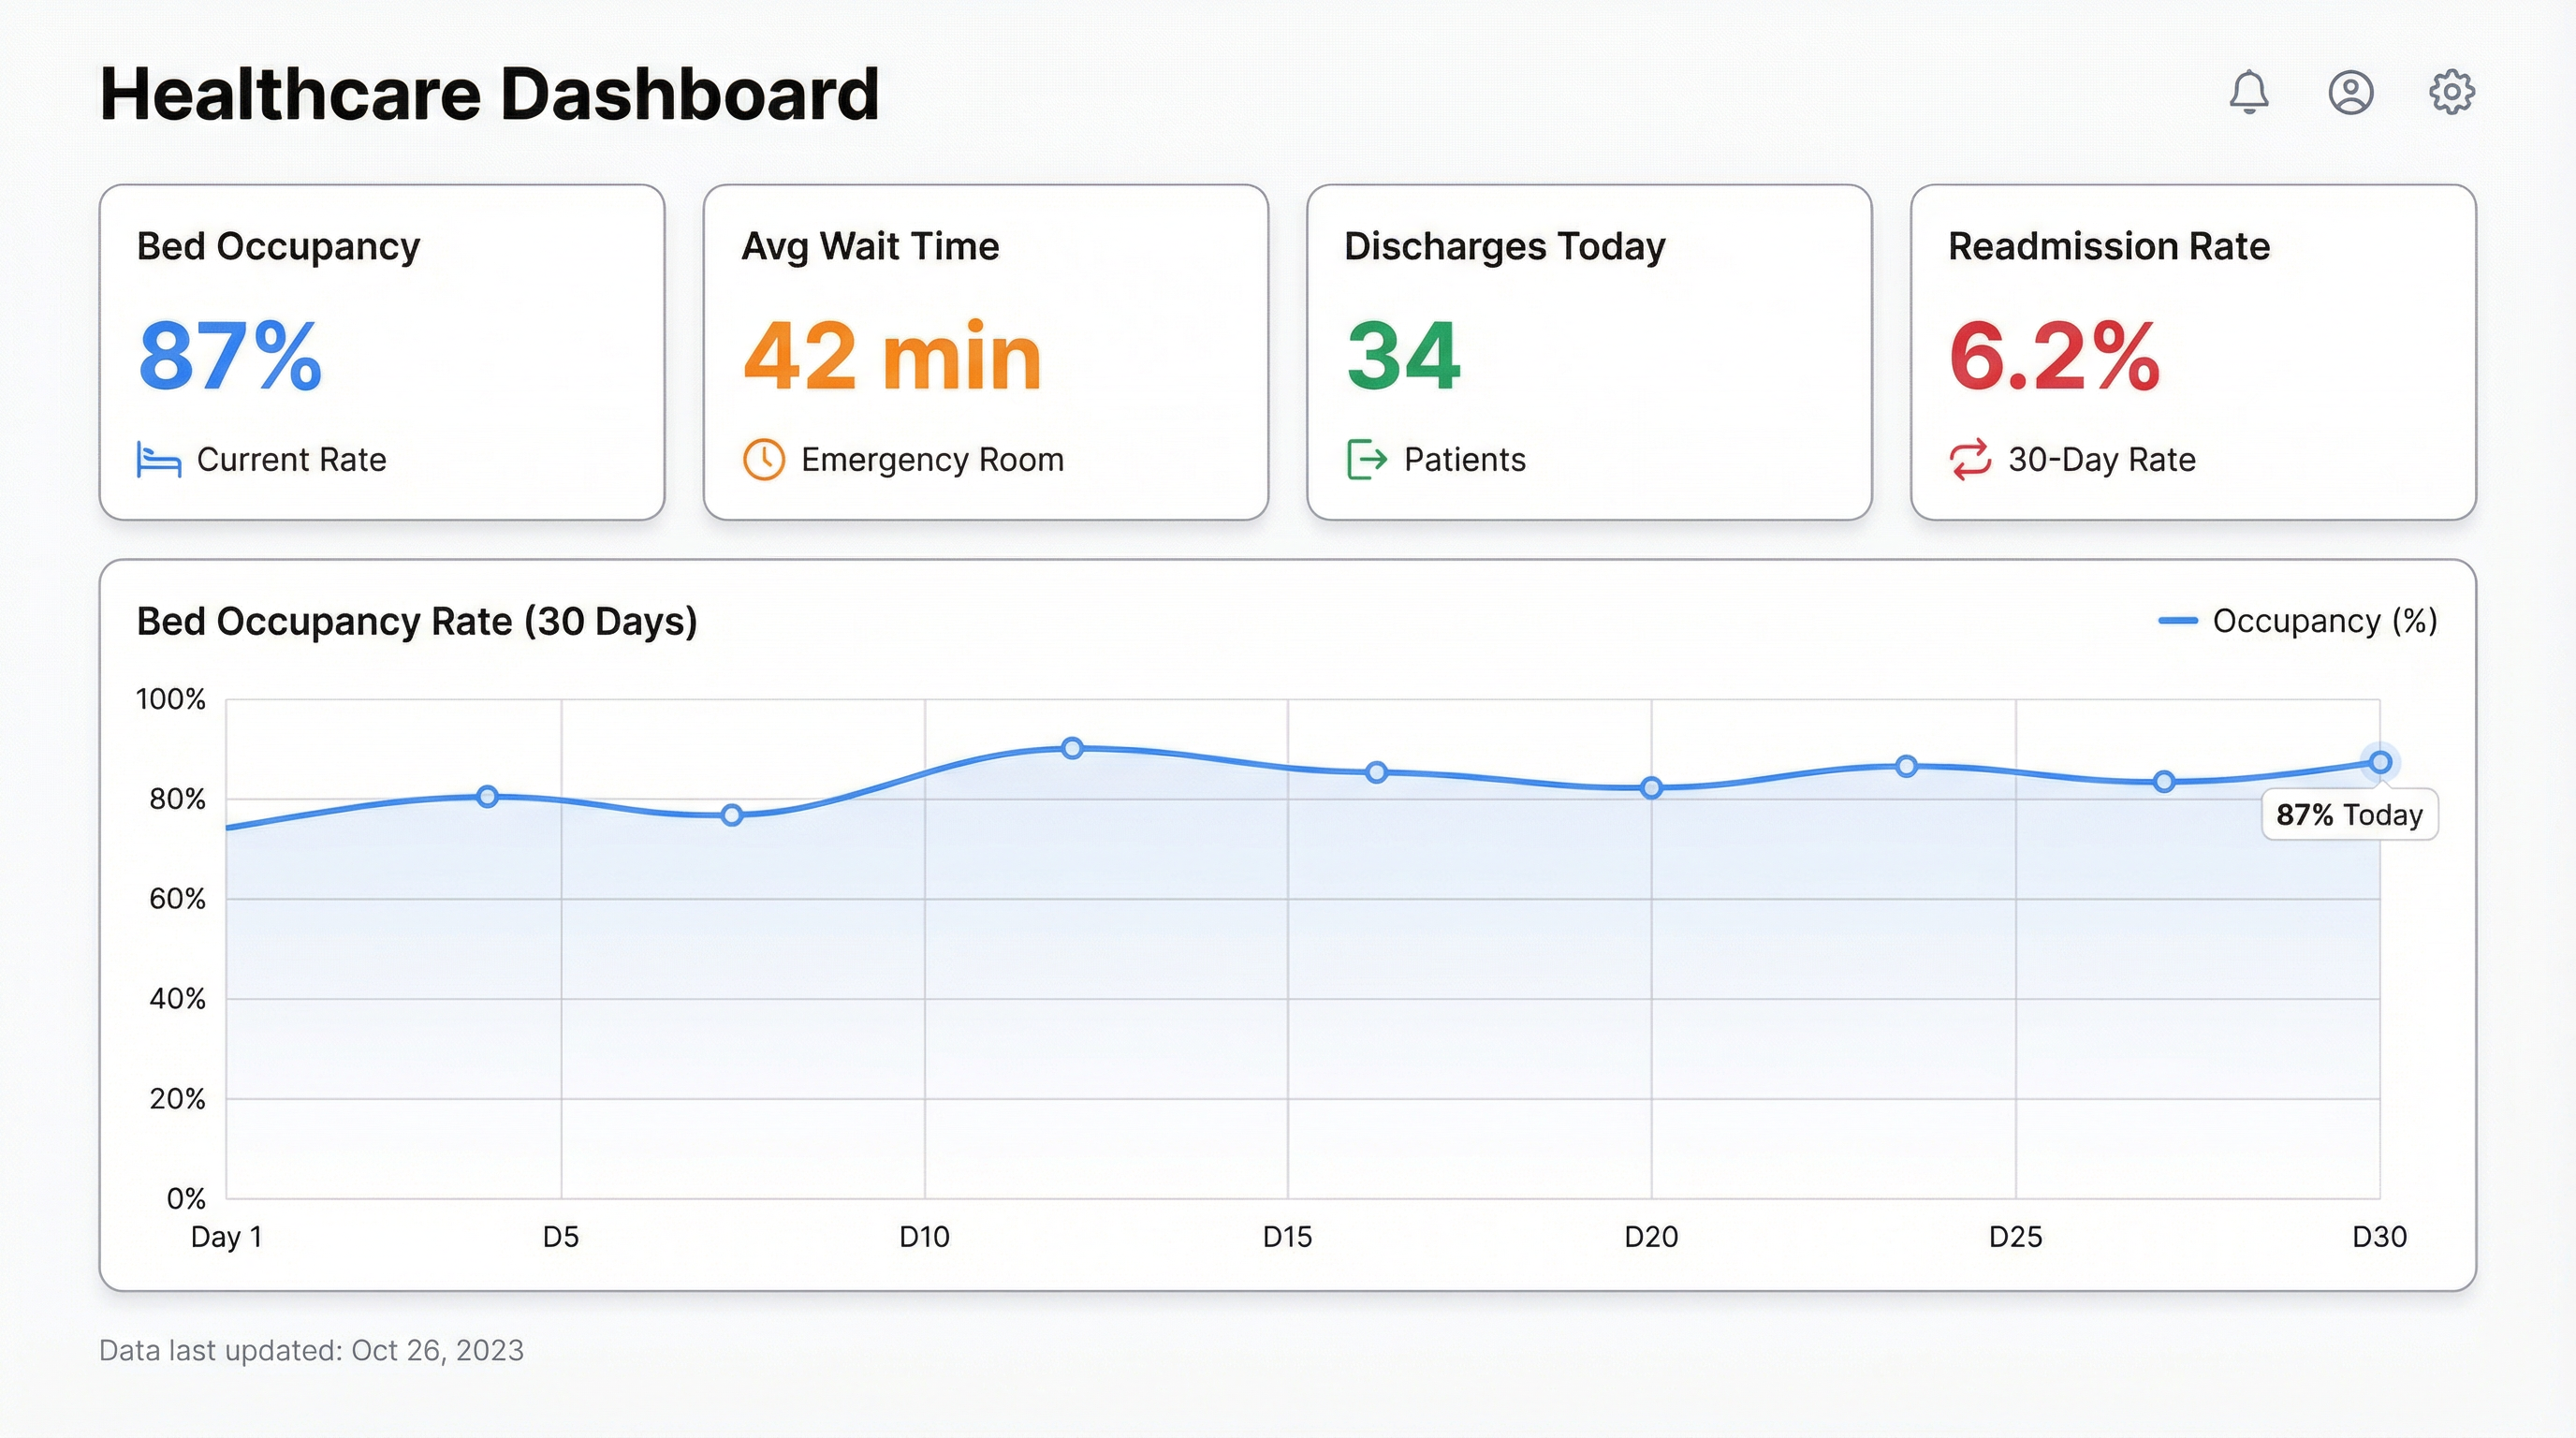
Patient flow is the operational heartbeat. Bed occupancy rate tells you how stretched your capacity is right now. Average length of stay shows whether patients are moving through the system efficiently. Admission and discharge rates reveal seasonal patterns and staffing pressure points. When bed occupancy hits 95%, most hospitals start feeling it. When it hits 100% and the charge nurse finds out by walking the floor, that’s a dashboard problem.
Clinical outcomes are where dashboards go from operational to strategic. Readmission rates within 30 days. Infection rates by ward. Patient satisfaction scores. Mortality rates by procedure or department. These metrics are reported quarterly in most hospitals — which means by the time a trend appears in a report, it’s been running for months. A dashboard surfaces it in days.
Staff performance is politically sensitive but operationally critical. Nurse-to-patient ratios. Agency staff usage. Overtime hours. Sick day patterns. When a ward is running at 130% nurse capacity three weeks in a row, that’s not a staffing anomaly — it’s a burnout signal. The data is almost always there. The visibility isn’t.
Revenue and billing is where most hospital finance teams live in spreadsheets they’ve built and maintained for years. Claims submitted, claims denied, days in accounts receivable, payer mix by department. A hospital with a billing denial rate above 8% is leaving significant money on the table — and most don’t know their number off the top of their head because it’s buried in a report they get once a month.
The Hospital Dashboard Most Teams Are Actually Building
When we talk to healthcare teams — operations managers, CMOs, finance directors — they’re almost never asking for enterprise BI. They don’t want a six-month implementation. They want something they can share with the leadership team on Monday.
The most common starting point is an operational command centre: bed occupancy by ward, current ER wait time, discharges scheduled today, and a flag for any department running above 90% capacity. That’s it. Four numbers, one screen, updated every few minutes. Small teams can build that in an afternoon if the data is accessible.
From there, it expands. A medical director adds clinical outcome metrics. Finance adds billing and denial rates. HR adds staff rostering. Within a few months, what started as four numbers becomes the single source of truth that the whole leadership team looks at before the morning stand-up.
The pattern is consistent: start with the thing that’s causing the most pain right now, get that visible, and the rest follows naturally.
Why BI Tools Keep Failing Healthcare Teams
The default path for building a healthcare dashboard in a large hospital involves a BI tool — Tableau, Power BI, Qlik — a data engineering team, a six-month project plan, and a budget approval process that takes longer than the project itself.
Three things go wrong, reliably.
First, the data is messier than anyone admitted in the project kickoff. The EMR exports in a format that needs transformation. The billing system uses different patient IDs than the clinical system. The staffing database has fields that were deprecated in 2018 but are still populated because no one turned them off.
Second, the people who need the dashboard aren’t the people building it. The CMO knows which metrics matter. The data engineer knows how to build the query. Getting those two people aligned, iterating quickly, and producing something useful inside six months is genuinely hard.
Third, by the time the dashboard ships, the operational priorities have shifted. The metric that mattered in January is now a compliance checkbox. The new urgent question isn’t answered by anything in the dashboard. The team patches it, the technical debt accumulates, and eventually the dashboard becomes something people look at once a week out of habit rather than genuine need.
AI changes the build cycle. Not the data quality problems — those are still real — but the iteration speed.
Building a Healthcare Dashboard with AI
The practical constraint in healthcare is usually data access, not tooling. EMRs don’t export cleanly. Billing systems have APIs that require a procurement process. But most healthcare teams have something they can start with: a weekly export from the EMR, a billing report in Excel, a Google Sheet someone maintains manually.
That’s enough to start.
Connect your data source to Infograph, describe what you want to see, and the AI builds the dashboard. “Show me bed occupancy by ward with a 30-day trend” produces a working chart. “Flag any department where the nurse-to-patient ratio is above 1:8” produces a table with conditional formatting. The AI interprets your prompt and translates it into the right query against your data — and the speed of iteration is completely different from a traditional BI build.
The workflow looks like this in practice:
Upload your data — a CSV export from your EMR, a billing report, a staffing spreadsheet. Connect a Google Sheet if you have live data there. Then describe the dashboard in plain language. “I need to track bed occupancy rate, average ER wait time, and discharge volume for the last 30 days, broken out by ward.” The dashboard builds in seconds.
From there, you iterate. Add a metric. Change the date range. Drill down to a specific department. Because you’re describing changes in plain language rather than editing SQL queries, the iteration cycle is hours instead of weeks.
When the dashboard is ready to share with the leadership team, publish it. Set it to update automatically from your data source. Send the link. Done.
Real Use Cases
A regional hospital group used this workflow to build a discharge planning dashboard that flagged patients likely to overstay their predicted length of stay, based on admission data and historical patterns. The operations team reviewed it every morning. Discharge delays dropped 18% in the first quarter.
A community health clinic built a billing denial dashboard that tracked claims by payer, denial reason, and department. Before they had it, the finance manager spent two days a month pulling this data manually. After: 20 minutes to review, with clear visibility on which denial reasons were trending up.
An NHS trust’s workforce team built a staff rostering dashboard that tracked agency spend by ward and flagged when overtime costs were trending above budget. Not a sophisticated model — just a clean view of data that had always existed but never been visible in one place.
The common thread: the data already existed. The problem was always visibility.
What to Build First
If you’re starting from scratch, build the thing that’s causing the most operational pain right now. Not the comprehensive command centre — just the one metric that someone is manually pulling every week and presenting in a meeting.
For most hospital operations teams, that’s bed occupancy. For finance teams, it’s billing denials. For clinical leadership, it’s readmissions.
Pick one. Get it visible. Then expand.
The dashboards that actually get used in healthcare are the ones that solve a specific, painful problem for a specific person who opens them every morning. Build for that person first. The comprehensive hospital dashboard grows from there.
Build your healthcare dashboard with Infograph — free to start, no credit card required.