Schools are drowning in data. Gradebooks, attendance logs, standardized test results, enrollment records — it’s all there, sitting in spreadsheets that nobody has time to turn into something useful. Most districts don’t have a data team. Most principals don’t have a BI analyst on speed dial.
That’s exactly the problem an education dashboard solves.
Build one and you go from “I think attendance is down this semester” to “Attendance dropped 6% in Grade 7 starting October, correlated with the schedule change.” One is a hunch. The other is a decision.
What an Education Dashboard Actually Tracks
Education dashboards aren’t one thing. They vary by who’s using them — a classroom teacher needs different views than a superintendent. But most effective dashboards share a core set of metrics.
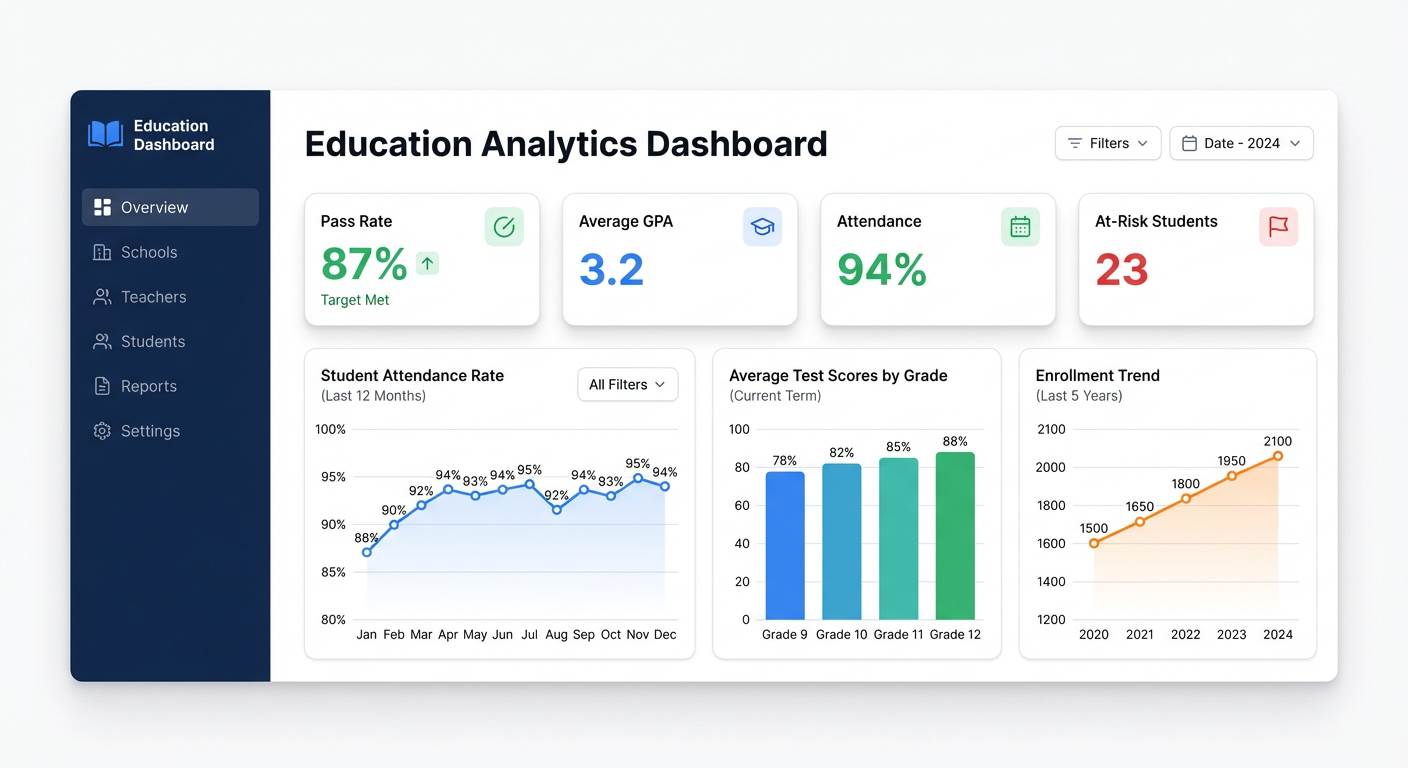
Student outcomes are the heart of it. Pass rates by subject, GPA distributions, grade-level proficiency scores. You want to see these at a glance and drill into cohorts — by grade, teacher, or demographic group.
Attendance rates are often the earliest warning signal. A student whose attendance drops below 85% is statistically far more likely to fall behind. Tracking this at the individual and cohort level, week over week, lets you catch problems before they become crises.
At-risk student flags pull together several signals — attendance, grades, behavioral incidents — into a single view. Who needs intervention? Who’s trending in the wrong direction? A good dashboard surfaces this automatically.
Test scores and academic progress include standardized assessments, benchmark exams, and semester grades. Trends matter more than snapshots. Is Grade 8 math proficiency improving year-over-year? Is the gap between high and low performers narrowing?
Enrollment trends matter for planning. Are you growing? Shrinking? Which grade levels are shifting? Schools that track enrollment over time can anticipate resource needs instead of reacting to them.
School finance metrics complete the picture for administrators: per-pupil spending, budget vs. actuals, cost per program. Connect this data to outcomes and you get real accountability.
Types of Education Dashboards
Student Performance Dashboard
The most common type. Built for teachers, counselors, and department heads. Shows individual student performance, class averages, assessment scores, and grade distributions. Best used at the classroom or grade level.
Key metrics: average GPA, pass/fail rates, assessment scores by standard, performance trends over time.
Teacher Effectiveness Dashboard
Used by department heads and principals. Tracks outcomes by teacher — class performance, assessment results, attendance in their classes. Done carefully (with appropriate context), this supports coaching conversations and professional development.
Key metrics: class average scores, grade distributions by teacher, year-over-year cohort comparison.
District-Level Dashboard
The executive view. Built for superintendents, school board members, and district administrators who need to see the whole system. Less granular, more strategic — enrollment trends across schools, district-wide attendance, aggregate outcomes, comparative school performance.
Key metrics: district enrollment, overall graduation rates, school-by-school performance summary, budget overview.
School Finance Dashboard
Often overlooked. Tracks budget allocations, actual spend, per-pupil costs, and program ROI. Useful for principals and business administrators managing tight budgets. Connect it to outcome data and you can start asking whether spending is going where it has the most impact.
Key metrics: budget vs. actuals, per-pupil expenditure, cost by program, fund balances.
How to Build an Education Dashboard with Infograph
Most schools already have the data. The problem is it’s locked inside spreadsheets — gradebooks, attendance exports, SIS reports. Getting it into a dashboard used to mean hiring someone who knows SQL or buying expensive software with a six-month implementation.
Infograph takes a different approach. Upload your data, describe what you want to see, and the AI builds the dashboard. No SQL. No configuration. No data team required.
Here’s what the process looks like in practice.
Step 1: Get Your Data Ready
Start with whatever you have. A CSV export from your student information system. A gradebook spreadsheet. An attendance report from the last semester. Infograph works with CSV, Excel, JSON, and NDJSON files — and you can connect Google Sheets or Excel Online directly if you want a live dashboard that updates automatically.
Don’t worry about formatting it perfectly. The AI handles column interpretation. Just make sure your headers are descriptive — “Student ID”, “Grade Level”, “Attendance Rate”, “Math Score” will work better than “Col_A”, “Col_B”.
Step 2: Upload and Connect
Go to app.infograph.ai, create a new dashboard, and upload your file. If you’re using Google Sheets, connect your Google account and select the sheet directly. Live connections mean your dashboard reflects changes in the spreadsheet automatically — no re-uploading every week.
Step 3: Prompt the Dashboard
This is where Infograph is different. Instead of dragging charts onto a canvas and configuring axes, you just describe what you want.
Try prompts like:
- “Show me attendance rate by grade level as a line chart over the last 12 months”
- “Create a bar chart of average test scores by subject for the current semester”
- “Show a KPI card for overall pass rate, average GPA, and total enrollment”
- “Flag students with attendance below 85% in a table sorted by attendance rate”
The AI interprets your data and builds the visuals. You can refine by prompting again: “Break that down by teacher” or “Add a trend line” or “Compare this year vs last year.”
Step 4: Share the Dashboard
When it’s ready, publish it. Share with specific team members, restrict to your organization’s accounts, or publish publicly for school board meetings. You control access. You can also snapshot a dashboard — freeze it at a point in time for reporting purposes — or keep it live so it reflects the latest data.
A Real Example: Student Outcomes Dashboard in 10 Minutes
Here’s a concrete walkthrough. You have a spreadsheet from your SIS with these columns: Student ID, Grade, Teacher, Math Score, English Score, Science Score, Attendance Rate, Status (Pass/Fail).
- Upload the file to Infograph
- Prompt: “Build a student performance dashboard with KPI cards for overall pass rate, average GPA, and average attendance. Show a bar chart of average scores by subject and a table of students with attendance below 85%.”
- Watch the dashboard appear. It’ll create the KPI cards, build the bar chart, and generate the at-risk student table automatically.
- Refine: “Break the score chart down by grade level” → updated chart
- Prompt: “Add a pie chart showing pass vs fail distribution” → done
- Share with your leadership team
Total time: under 10 minutes. No formulas. No pivot tables. No waiting for IT.
What to Put on Your Education Dashboard
Not everything needs to be on one screen. The most effective dashboards are focused. Here’s a practical starting template:
For a classroom teacher:
- Class average by assessment
- Individual student score trends
- Attendance rate table with flags for below-threshold students
- Pass/fail rate this semester vs. last
For a principal:
- School-wide attendance rate (trend)
- Grade-level GPA averages
- At-risk student count by grade
- Enrollment total (current vs. last year)
- Teacher comparison summary
For a superintendent or district administrator:
- District enrollment trend (multi-year)
- School-by-school attendance rate
- Graduation rate trend
- Per-pupil spending vs. district average
- Key outcome metrics across schools
Why Spreadsheets Aren’t Enough
Spreadsheets are where education data lives. They’re not where it should be presented.
A spreadsheet with 400 rows of student data tells you nothing at a glance. It doesn’t surface the student who went from 92% attendance in September to 71% in November. It doesn’t show that science scores in Grade 6 dropped 8 points this semester. It doesn’t flag the three teachers whose classes have significantly higher pass rates — and might have something to teach the rest of the department.
Dashboards make patterns visible. And visible patterns get acted on.
The barrier used to be technical. Building a real dashboard meant knowing Tableau, Power BI, or writing SQL against a database. Most schools don’t have that capacity.
Infograph removes that barrier. Upload a spreadsheet. Describe the dashboard. Get the dashboard. Share it with whoever needs to see it.
Education data deserves better than pivot tables. If you have the spreadsheets — and you almost certainly do — you’re closer to a real analytics dashboard than you think.