Board decks are a ritual. Every month or quarter, someone spends two days pulling numbers from Stripe, from QuickBooks, from your CRM, from five different spreadsheets. They paste them into slides. They format the charts. They send it out — and it’s already out of date by the time the first investor opens it.
There’s a better format. A board reporting dashboard gives investors a live view of your key metrics, always current, accessible via a link. The monthly deck can still happen. But the numbers are never stale, and “what’s the current MRR?” stops being a question anyone has to ask.
What Goes in a Board Dashboard
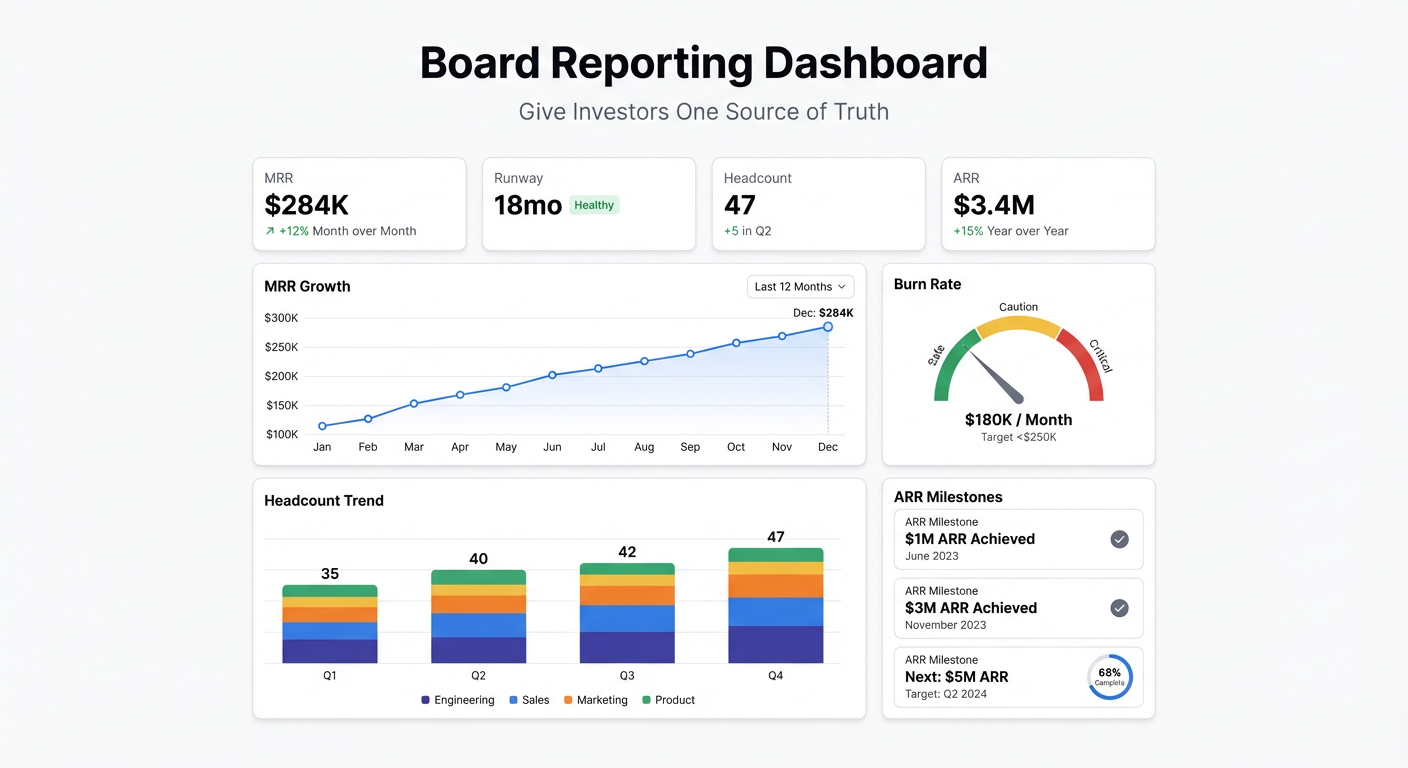
Every startup is different, but investor dashboards tend to converge on the same core metrics. If you’re not sure where to start, these are the ones your board will ask about:
- MRR and ARR — with trend over the past 12 months
- MRR movements — new MRR, expansion, contraction, churn broken out separately
- Burn rate and runway — monthly cash burn and months of runway remaining
- Growth rate — month-over-month and year-over-year
- Customer count — total active customers, net new this month, churn count
- CAC and LTV — ideally with CAC payback period
- Key funnel metrics — whatever your business model makes important (signups, trials, activations)
That’s the standard package. Your board may want more or less depending on your stage and sector — but if you have these visible and live, you’ll go into most board conversations well-prepared.
Building the Dashboard
The data for a startup board dashboard typically lives in three places: your payment processor (Stripe, Paddle), your accounting software (QuickBooks, Xero), and a spreadsheet where someone is already tracking the metrics manually.
The manual spreadsheet is usually the fastest starting point.
Step 1: Centralise Your Metrics in a Google Sheet
If you’re already maintaining a metrics tracker, you’re halfway there. Export your key numbers into a Google Sheet — or build one that pulls from Stripe directly using the Stripe Sheets integration.
A clean structure: one row per month, columns for each metric. MRR, ARR, new customers, churned customers, net new MRR, gross margin, burn, runway. That’s a dashboard-ready data source.
If you want to go deeper, add a second tab for MRR movements (new, expansion, contraction, churn by month) and a third for funnel metrics. Three tabs, all connected to the same dashboard.
Step 2: Connect to Infograph
Sign in to Infograph, create a new dashboard, and connect your Google Sheet. Then describe what your investors need to see:
“Show MRR as a line chart for the past 18 months. Add a stacked bar chart breaking down MRR movements by type: new, expansion, contraction, churn. Include summary cards for current MRR, monthly growth rate, and runway.”
The AI reads your column headers and builds it. If your columns are named “Monthly Recurring Revenue,” “New MRR,” “Churn MRR” — it maps them correctly without you specifying.
For burn and runway:
“Show monthly cash burn as a bar chart with a line for cumulative spend. Add a single metric card showing months of runway at current burn rate.”
For the customer funnel:
“Show a funnel: website signups → activated users → paid conversions. Display the conversion rate at each step.”
Each prompt takes about 10 seconds. The whole dashboard takes under 30 minutes.
Step 3: Share It With Your Board
Publish the dashboard and send the link to your investors. You control who can see it — keep it behind a password, restrict access to specific team members, or set it to view-only for external stakeholders.
When your Google Sheet updates (which happens automatically if you’ve connected it to Stripe or update it monthly), the dashboard updates. Your investors always see current numbers. No one needs to ask for the latest deck.
Why This Works Better Than Slides
Board slides show one moment in time. An investor dashboard is a standing resource — something a board member can check before a call, during due diligence, or just because they’re curious about how the month is tracking.
The format also forces clarity. When you’re building a dashboard rather than a slide, you can’t bury a bad number behind a well-designed chart. The data is what it is. Founders who get comfortable with this — who give their board real-time visibility rather than curated snapshots — tend to have better relationships with their investors. It signals confidence.
A secondary benefit: the dashboard is also useful internally. Your leadership team can check the same view, which means everyone is working from the same numbers. The CFO and the CEO see the same runway figure. No reconciliation required.
The Free Tier
You can build a complete board reporting dashboard on Infograph’s free plan — one dashboard, no credit card required. That’s enough for early-stage founders who want to send investors a live link instead of a monthly PDF.
Pro ($19.99/month) adds live Google Sheets connections, five dashboards, and team-level access controls. Worth it once you’re giving multiple investors access to the same view.