Finance teams are drowning in spreadsheets. The monthly close produces a dozen files, each one the source of truth for something different. Someone has to open all of them, copy-paste into a summary sheet, format it, and send it around — usually the night before the board meeting.
That’s not analysis. That’s data wrangling. And it’s eating the hours that should go toward actually understanding the business.
Here’s how to build a financial dashboard that does the assembly work for you.
What belongs on a financial dashboard
The answer depends on your audience. A CFO wants different things than a department head. Get this wrong and the dashboard is useless — either too detailed to read or too abstract to act on.
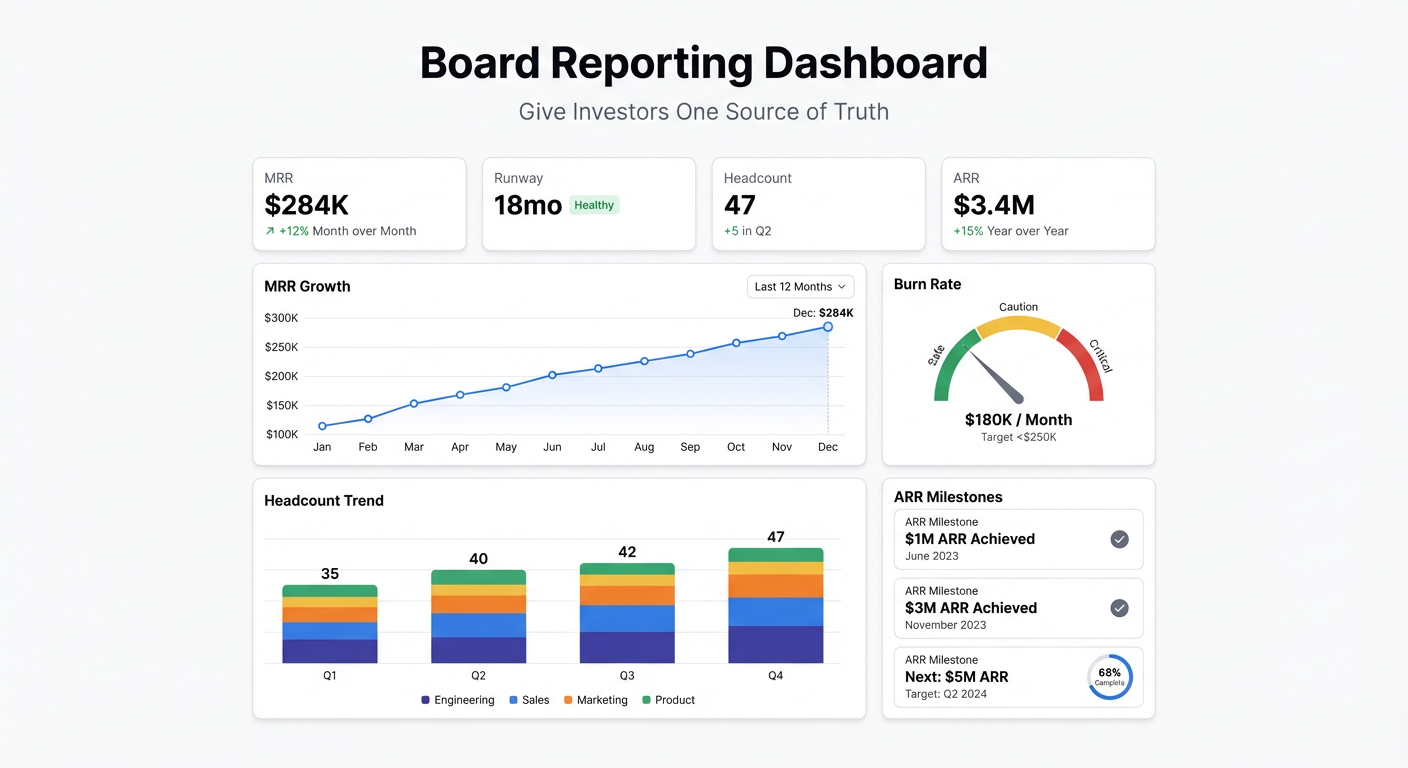
For executives and board-level reporting:
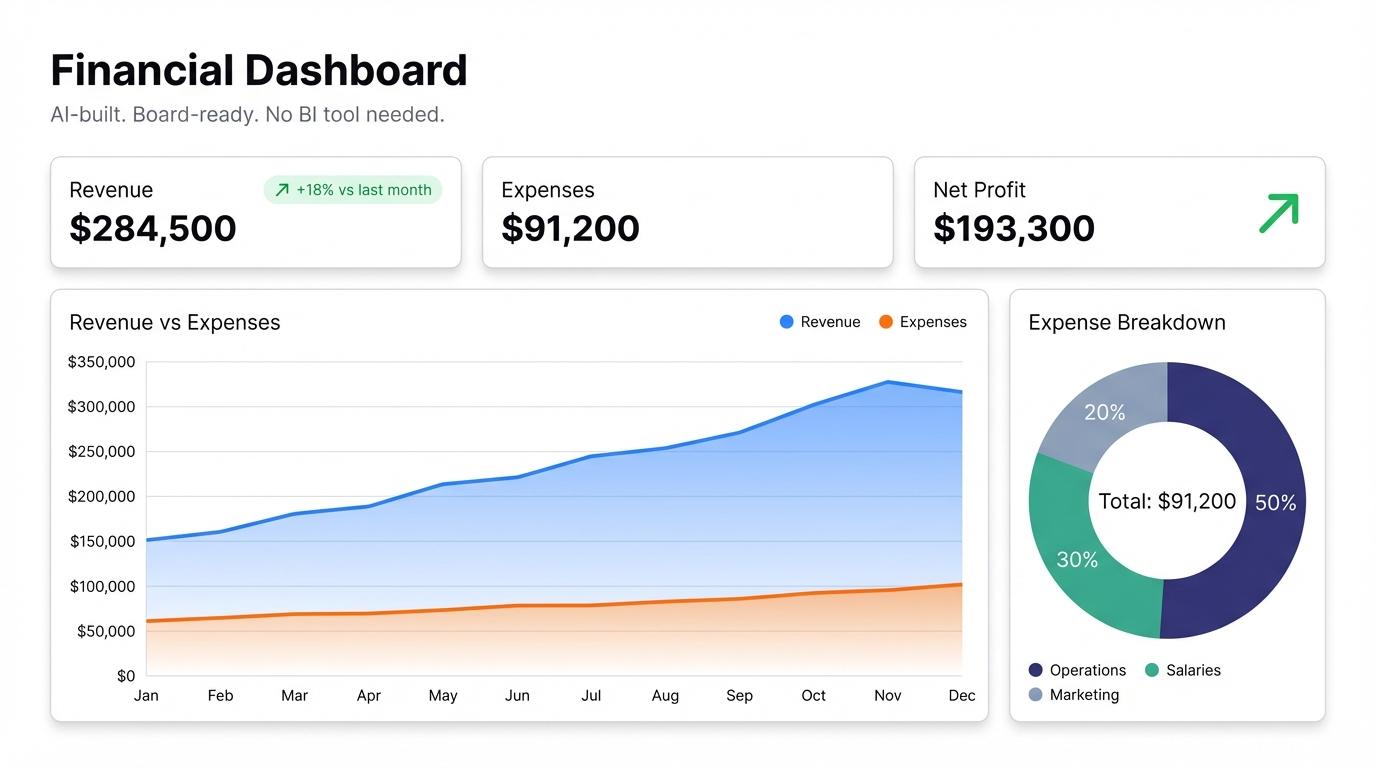
- Revenue vs budget (and vs last year)
- Gross margin trend
- Operating expenses by category
- Cash position and burn rate
- EBITDA
For operations and department heads:
- Budget vs actuals by department
- Headcount costs
- Variable vs fixed cost breakdown
- Spend trend by category
For FP&A teams:
- Forecast accuracy (actual vs modeled)
- Variance analysis by line item
- Rolling 12-month projections
- Revenue by segment or product
You don’t need all of these on one dashboard. Pick the audience, pick the questions, build for that.
The BI tool trap
For a long time, the standard advice was: buy a BI tool, hire a data analyst, connect your ERP, and wait. Tools like Tableau, Looker, and Power BI are powerful. They’re also expensive, complex to set up, and require someone technical to maintain them.
Most growing companies don’t have that person yet. And even when they do, getting a new dashboard built takes weeks — requirements gathering, data modeling, design, testing. By the time it ships, the business question has changed.
AI changes the math on this.
Building a financial dashboard with AI
Here’s the workflow that actually works:
Step 1: Export your data. Pull your P&L, balance sheet, or cost data from your accounting software as a CSV or Excel file. QuickBooks, Xero, NetSuite — they all export. If your finance team lives in Google Sheets or Excel Online, even better.
Step 2: Upload or connect. In Infograph, upload the file directly or connect your Google Sheet live. Live connections mean the dashboard updates automatically when the underlying data changes. No re-upload every month.
Step 3: Describe what you want. Type something like: “Show me revenue vs budget by month, gross margin trend, and top 5 expense categories.” The AI builds the dashboard from that description. In seconds.
Step 4: Share it. Send a link to your team, lock it behind a password for board use, or make it available to specific people in your organization. No one needs to install anything.
That’s it. No SQL, no data modeling, no waiting for IT.
The sharing piece matters more than you think
Financial data is sensitive. You want different people to see different things — and you don’t want to email spreadsheets around.
With a proper dashboard tool, you can share a link that requires a password. The recipient never sees the underlying data. They see charts. If the data updates, the charts update. When the month closes and you upload the new actuals, the dashboard reflects it automatically.
This is how you stop emailing spreadsheets that are immediately out of date.
A real example
Say you’re running a $5M ARR SaaS company. You export last month’s P&L from QuickBooks, upload it to Infograph, and describe: “Revenue by month vs prior year, gross margin percentage, OpEx breakdown by category, headcount cost trend, and net income waterfall.”
You get a dashboard in under a minute. Share it with the board via a password-protected link before the meeting. They see live data, not a static PDF that someone emailed three days ago.
If your data lives in Google Sheets — which it probably does for a lot of the supporting analysis — connect it directly. The dashboard stays current without anyone touching it.
What to avoid
Showing too much. A 40-line P&L crammed into a dashboard doesn’t help anyone. Summarize. Roll up the detail. Link to the spreadsheet if people want to drill down.
Mixing time periods. If one chart shows monthly data and another shows quarterly, your audience will spend the whole meeting reconciling, not discussing. Keep it consistent.
No comparison. Showing $1.2M revenue is meaningless without context. Show it vs budget, vs last month, vs last year. The delta is what drives the conversation.
Get started
Finance shouldn’t require a data team to get a clear picture of the business. Build your first financial dashboard free at Infograph — upload your export, describe what you want to see, and have it running before your next meeting.