Every project management tool promises visibility. Jira, Asana, Monday, ClickUp — they all have dashboards of some kind. And yet somehow, no one can tell you whether the project is on track without a 30-minute status meeting.
The problem isn’t that the data doesn’t exist. The problem is that the built-in dashboards in PM tools are designed to show activity, not status. You can see how many tickets moved this week. What you can’t see, at a glance, is whether you’re going to ship on time.
Here’s how to build a project management dashboard that actually tells you what’s happening.
What a good project dashboard shows
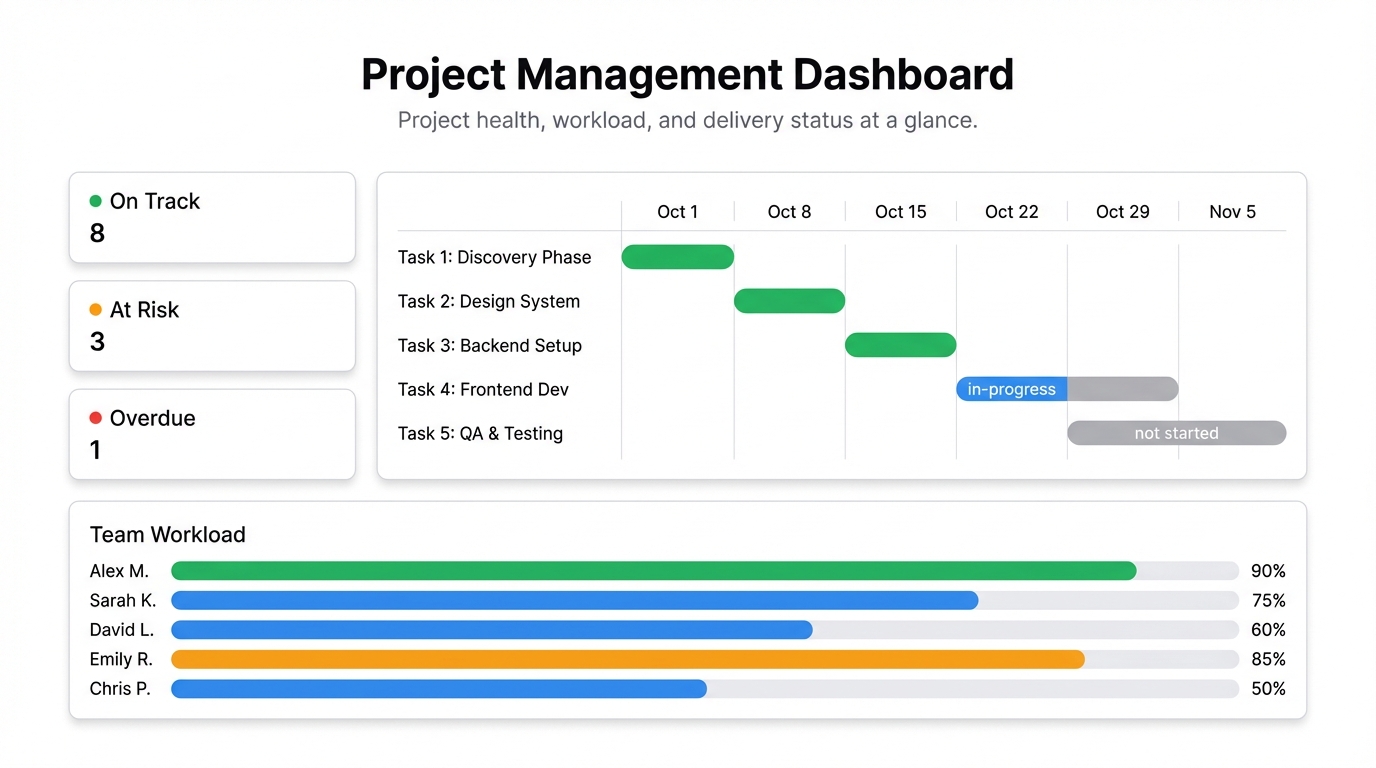
A project dashboard should answer three questions instantly:
- Are we on track? Planned vs actual progress. How much is done vs how much should be done by now.
- Where are the problems? What’s blocked, overdue, or at risk.
- Who’s carrying too much? Team workload distribution. If one person is buried and another has space, that’s a resource allocation problem you can actually fix.
If your dashboard answers those three questions in under 30 seconds, it’s doing its job.
Metrics that belong on a project management dashboard
Progress vs plan — if the project is 60% through its timeline, is it 60% done? This is the single most important number. Plot it as a line showing planned completion rate vs actual, and you’ll see divergence before it becomes a crisis.
Open tasks by status — how many are in-progress, blocked, not started, and done. A simple stacked bar chart works well here.
Overdue tasks — how many, owned by whom, and by how many days. This is where slippage lives.
Blockers and dependencies — a list, not a chart. Keep it short — anything blocked needs a resolution path, and you should be reviewing it every week.
Team workload — tasks assigned per person. Even a simple count tells you when someone’s overloaded relative to the rest of the team.
Sprint velocity (if you’re agile) — points completed per sprint over the last 6-8 sprints. If velocity is dropping, something’s wrong. If it’s steady, you can actually predict delivery.
Milestone dates — a timeline view with the key milestones and their current projected dates. Are they still on the original date, or have they slipped?
Getting the data
Most PM tools let you export your project data. Here’s how to get it out:
Jira — export issues as CSV from the Issues list view. Include fields like status, assignee, due date, story points, created date.
Asana / Monday / ClickUp — all have CSV exports from their task views. Pull fields: task name, section/sprint, assignee, due date, status, completion date.
Custom tracking in Google Sheets — a lot of teams maintain their own tracker in a shared sheet. That works too, and it’s often the cleanest source of truth.
Once you have the data, upload it to Infograph or connect your Google Sheet directly as a live source. Then describe your dashboard: “Show tasks by status as a donut chart, overdue tasks by owner, progress vs plan as a line chart, and team workload by assignee.” The AI builds it in seconds.
The weekly refresh habit
The only thing that kills a project dashboard is stale data. If you’re not updating it, your team stops trusting it, and it becomes one more thing everyone ignores.
If your data lives in Google Sheets, this is solved automatically — connect the sheet live and it stays current whenever someone updates it. If you’re pulling exports from a PM tool, make the weekly export a calendar event. 15 minutes on Monday morning, upload, done.
What to avoid
Too many projects on one dashboard. If you’re managing multiple projects, build one dashboard per project and a separate executive view that shows status across all of them. Cramming everything together just creates noise.
Vanity metrics. Total tasks created, comments posted, files uploaded — these track activity, not progress. Cut them.
Percent complete without context. “50% complete” means nothing without knowing whether you’re 50% through the time. Always show progress relative to timeline.
Sharing with stakeholders
The other thing project dashboards need to do is inform people who aren’t in the day-to-day. Stakeholders, clients, executives — they want a clear status, not a ticket board.
A shared dashboard link gives them exactly that. They open it, see project health at a glance, and can ask informed questions. No one has to prepare a status deck. No one has to export and email a PDF.
If it’s client-facing, set a password. If it’s internal, lock it to your team. If the data is public by design — community projects, open source work — make it public.
Build it once, use it every week
The setup investment for a project management dashboard is maybe 30 minutes. After that, updating it takes minutes. The return is fewer status meetings, faster problem identification, and a team that spends less time reporting and more time building.
That’s worth 30 minutes.
Get started free at Infograph — upload your project export, describe what you want to see, and have your dashboard running before your next team meeting.


