Zoho Analytics gets recommended a lot. And the pitch makes sense on paper: a reasonably capable BI tool that’s affordable when you’re already paying for the Zoho suite, with connectors to Zoho CRM, Zoho Books, and a decent set of visualisation options.
In practice, it’s a different story. The report builder is clunky. The UI feels like it hasn’t been meaningfully redesigned since 2016. Getting data from outside the Zoho ecosystem requires more clicks than it should. And if you want to share a dashboard with someone who doesn’t have a Zoho account, prepare for some pain.
If you’ve been using Zoho Analytics and something finally broke your patience — this is the guide for you.
What Zoho Analytics Actually Gets Right
Before writing it off: Zoho Analytics is genuinely capable at a few things.
The pricing is real value compared to Tableau or Qlik. The Zoho-to-Zoho connectors are tight — if you’re pulling data from Zoho CRM into a sales dashboard, it works reliably. And it does have a reasonable set of chart types: bar, line, pie, scatter, heatmaps, pivot tables.
The SQL query builder is also more powerful than the visual interface suggests. If you’re comfortable writing queries, you can get a lot done.
Where It Falls Apart
The drag-and-drop report builder has a known learning curve that doesn’t get better with time — it just gets familiar. But “familiar frustration” is still frustration. Creating anything beyond a basic table-and-bar-chart layout requires wrestling with the interface.
The sharing experience is the real dealbreaker for most teams. Embedding dashboards or sharing with external stakeholders is either complex, expensive (you pay per viewer seat beyond your plan’s included count), or requires workarounds that feel wrong.
And the AI features they’ve recently bolted on — Zia, their AI assistant — feel underpowered compared to what newer tools are doing from scratch.
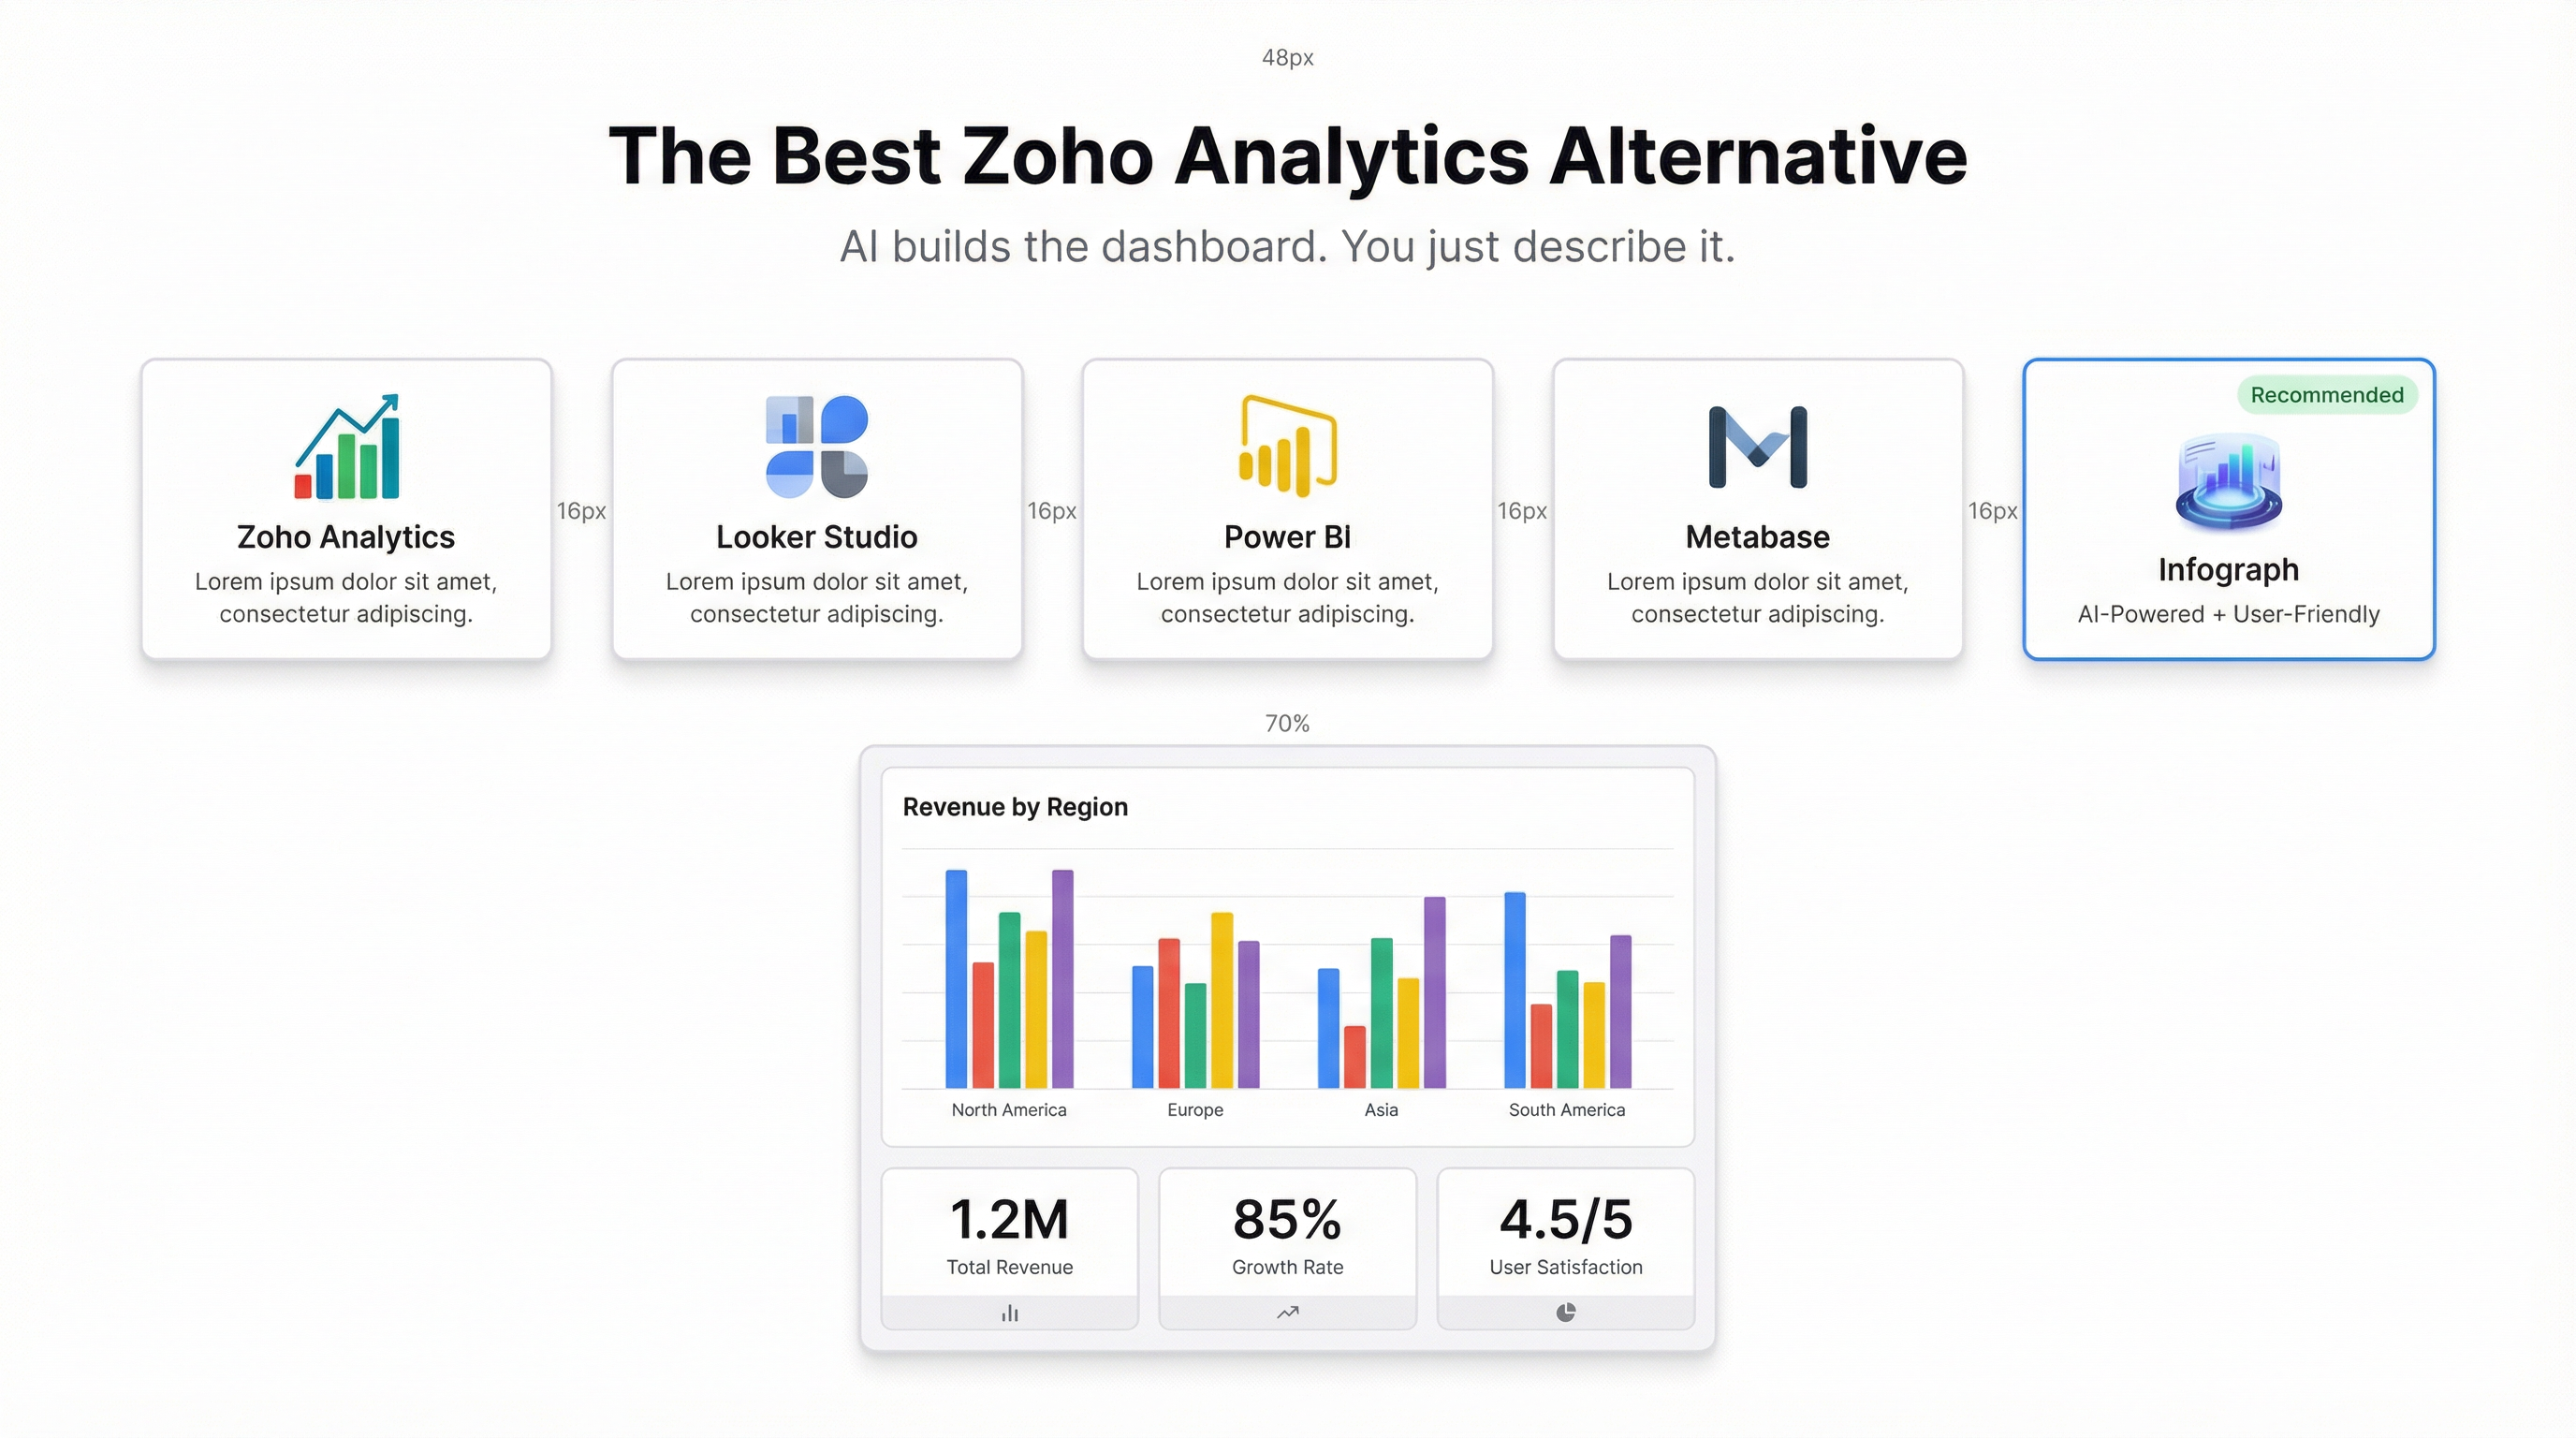
The Best Zoho Analytics Alternatives
Infograph — AI Builds the Dashboard for You
The core difference with Infograph is how you build dashboards. You don’t drag and drop. You connect your data source and describe what you want to see. The AI builds it.
Upload a CSV, connect a Google Sheet or Excel Online file, and type something like “show me monthly revenue by region with a trend line and highlight months below target.” Thirty seconds later, you have a dashboard. Edit it in plain language from there.
Where Zoho Analytics requires you to learn its interface, Infograph requires you to know what question you’re trying to answer. That’s a much more comfortable skill.
Sharing is built properly too. Publish a dashboard with a link. Lock it behind a password. Restrict it to your team only. Or make it public. The sharing controls are front-and-centre, not buried.
Pricing: Free plan available. Pro at $19.99/month for individuals; Teams at $49.99/month for collaborative use.
Best for: Teams who want dashboards fast and don’t want to become BI specialists.
Google Looker Studio — Free, But You’ll Feel It
Looker Studio (formerly Data Studio) is free, which makes it genuinely hard to argue against for budget-constrained teams. The Google connectors are excellent — Sheets, Analytics, Ads — and it handles collaborative editing reasonably well.
The tradeoff: it’s slow. Reports take time to load. The builder can feel unresponsive. And building a polished, complex dashboard takes far longer than you’d expect for a Google product.
If your data lives in Google’s ecosystem and speed doesn’t matter much, Looker Studio is a credible free option. Outside that context, the friction adds up.
Best for: Teams fully invested in Google Workspace who want zero licensing cost.
Microsoft Power BI — Powerful, But Demanding
Power BI is probably the most capable BI tool in this price range. The data model is sophisticated, DAX gives you real calculated field power, and the visualisation library is extensive.
But the same warnings apply here as to Tableau: this is a tool that rewards investment. Learning Power BI properly takes time. The desktop app is Windows-only (the web editor is limited). And while the base licence is cheap, Power BI Premium — needed for wider sharing and some enterprise features — costs significantly more.
If you have analysts who want a deep data modelling environment, Power BI earns its place. For the broader team who just needs to see a dashboard, it’s overkill.
Best for: Data-mature teams with Windows-based analysts.
Metabase — Good for Engineering-Led Teams
Metabase is open-source and well-regarded in the startup/engineering world. The visual query builder is clean, the embedding story is strong, and self-hosting keeps costs low if you have the infrastructure to run it.
Where it gets complicated: the hosted version (Metabase Cloud) is more expensive than it looks once you’re past the starter tier. And it’s fundamentally built around querying a database — if your data is in spreadsheets rather than a SQL database, the setup is more involved.
Best for: Engineering-led organisations with structured databases who want clean internal dashboards.
Sisense — Enterprise Tier, Enterprise Price
Sisense is for much larger teams. The machine learning capabilities and data compression technology are genuinely impressive, but you’re looking at pricing that starts in the thousands per month. Worth knowing it exists if your company grows into it.
Best for: Enterprise organisations with complex, multi-source data needs.
How to Choose
A quick framework:
- Your data is in spreadsheets and you want dashboards fast → Infograph
- Your data is in Google products and budget is zero → Looker Studio
- You have analysts and complex data models → Power BI
- You’re engineering-led with a real database → Metabase
- You’re enterprise with serious data infrastructure → Sisense
Zoho Analytics sits in an awkward middle — not cheap enough to justify the UX friction, not powerful enough to justify serious investment. Most teams using it are there because they’re already in Zoho, not because it’s the best tool for the job.
If you’re finally ready to try something built for how people actually work now — connect your data, describe your dashboard, ship it to your team — Infograph is worth 5 minutes of your time.


