You have the data in Excel. You know what you want to see. The gap between those two things used to take hours.
Manual chart-building. Pivot tables. Formatting. Sending the file to three people who all edit different versions. Then doing it all again next week because the numbers changed.
There’s a better path.
What AI Changes About Excel Dashboards
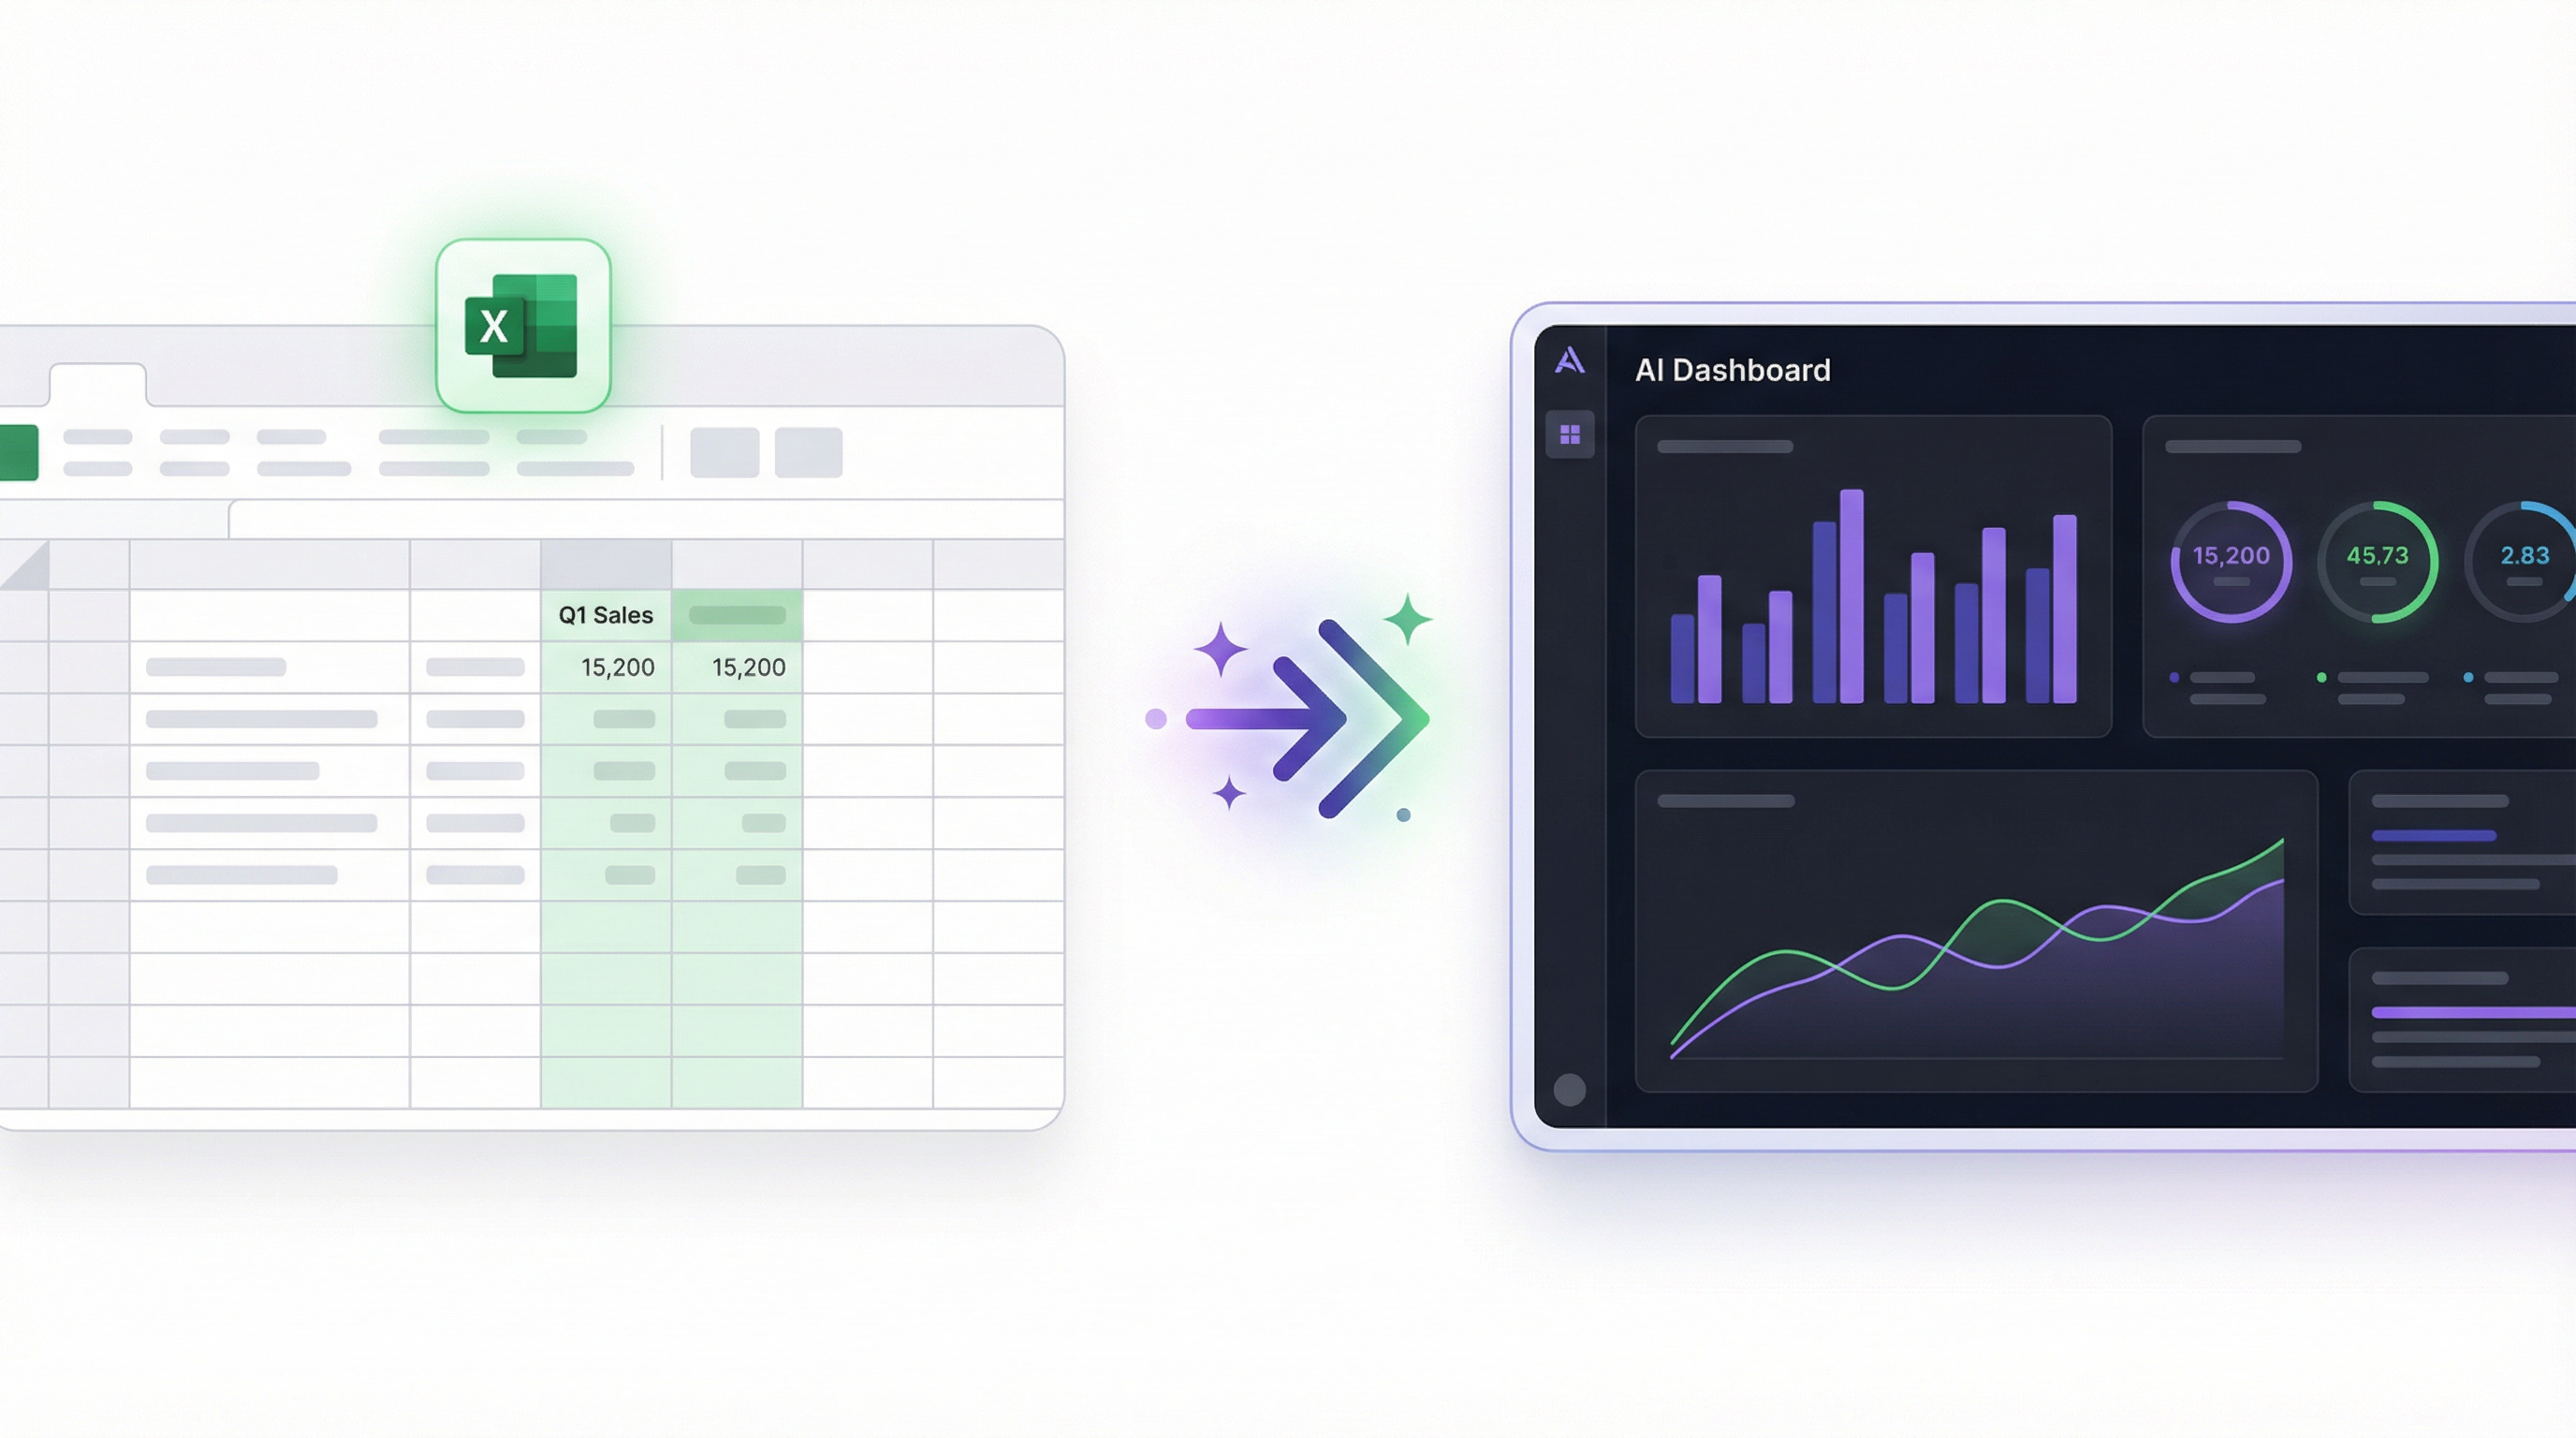
Traditional Excel dashboards are a collection of charts you build by hand. You choose the chart type, assign data ranges, configure axes, pick colors. It works, but it’s slow — and the dashboard is static. When your data changes, you rebuild.
AI dashboard generators flip this. Instead of configuring charts, you describe what you want. The AI reads your data structure, figures out which columns map to which metrics, and builds the dashboard for you. Change your data, the dashboard updates automatically.
The result isn’t just faster — it’s genuinely different. A prompt-driven dashboard means anyone on your team can iterate on what they see, not just whoever knows Excel best.
How to Build an Excel Dashboard with Infograph
Here’s the actual workflow from Excel file to live, shareable dashboard.
Step 1: Get Your Data Ready
You don’t need to clean or restructure your Excel file. Infograph handles .xlsx files directly, including multiple sheets, merged cells, and inconsistent formatting. If your data has a header row and consistent columns, you’re ready.
Two ways to connect your data:
Upload a file. Export your workbook or save it as .xlsx and upload it directly to Infograph. Best for static snapshots — you upload once and build the dashboard from that data.
Connect Excel Online. If your spreadsheet lives in OneDrive or SharePoint, you can connect it directly via your Microsoft account. This is the live option — when the Excel file updates, the dashboard updates automatically. No re-uploading required.
The live connection is the part worth paying attention to. Most teams update their trackers weekly or daily. With a live connection, the dashboard reflects those updates in real time. No maintenance required.
Step 2: Describe Your Dashboard
Sign in to Infograph, create a new dashboard, and connect your Excel data. Then describe what you want to see:
“Show monthly revenue broken down by product line as a bar chart. Add a line chart for cumulative revenue over the year. Include a summary card for total Q1 revenue.”
That’s the prompt. Infograph reads your column headers, maps them to what you described, and builds the charts.
If your columns don’t match exactly — say your file has “Product Category” instead of “product line” — it figures out the closest match. You don’t need to tell it which column to use.
Step 3: Refine With More Prompts
The first build is the starting point, not the final product. Keep going:
“Compare this year’s revenue to last year on the same chart.” “Add a table showing top 10 customers by total spend.” “Break down the bar chart by region instead of product line.”
Every prompt applies immediately. You’re not fighting chart configuration — you’re having a conversation about what you want to see.
Step 4: Share It
When the dashboard looks right, publish it. You get a shareable link. Your team, your manager, your clients — they can view the dashboard without needing an Infograph account.
Access controls are available on paid plans: lock the dashboard behind a password, restrict access to people inside your team account, or make it fully public. On the free plan, published dashboards are publicly accessible via the link.
What Good Excel Dashboards Look Like in Practice
Sales performance tracker. A shared Excel file where reps log deals. Connected to Infograph via Excel Online. Dashboard shows pipeline by stage, monthly bookings, and individual quota attainment. Updates automatically when reps add new rows. Displayed on the office TV during standups.
Financial reporting. Monthly P&L in Excel, uploaded to Infograph at the end of each month. Dashboard shows revenue vs expenses, gross margin trend, and budget vs actuals. Sent to investors as a link rather than a file attachment.
Marketing spend tracker. Ad spend by channel in a spreadsheet updated weekly. Connected live to a dashboard showing cost per acquisition, spend by campaign, and total monthly budget consumed. Accessible to the marketing team without anyone needing to run queries.
The common thread: the data already exists in Excel. Infograph is the layer that makes it readable.
What About Messy Spreadsheets?
Real spreadsheets are messy. Multiple tabs. Subtotal rows. Headers that span multiple columns. Dates formatted three different ways in the same column.
Infograph handles this better than you’d expect. It reads the sheet structure, identifies the data region, and ignores the formatting noise. For especially messy files, it’ll tell you which sheet or range it’s reading from, so you can verify it’s working with the right data.
It won’t perform miracles on data that’s fundamentally broken — if the same metric is spread across 15 columns with no consistent naming convention, a human will need to clean that up first. But for typical business spreadsheets, it works without preprocessing.
The Free Tier
You can build one dashboard from an Excel file on Infograph’s free plan — no credit card required. That’s enough to see whether this approach works for your data before committing to anything.
The Pro plan ($19.99/month) gives you live Excel Online connections, five dashboards, and access to the latest AI models.


