Most “free dashboard software” roundups list the same five tools and call it done. This one tells you what free actually means for each — because there’s a big difference between genuinely free and free-as-in-you-need-a-server.
Here’s what we’re covering: Infograph, Google Looker Studio, Metabase, Grafana, and Tableau Public. All five have a real free option. They’re not the same.
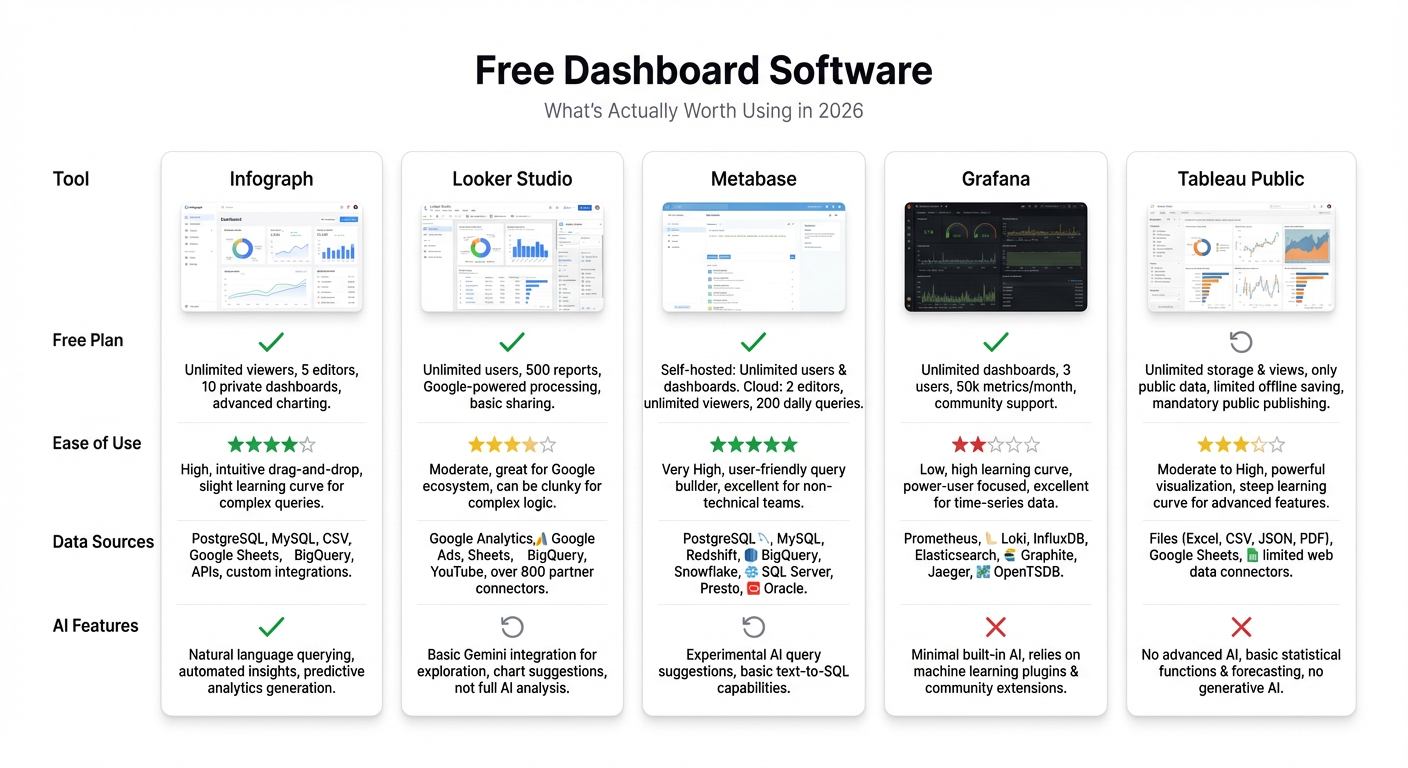
Quick Comparison
| Tool | Free Tier? | Setup Required | AI Generation | Best For |
|---|---|---|---|---|
| Infograph | Yes — 1 dashboard, no card | None | Yes | Quick dashboards from CSV, Sheets, Excel |
| Looker Studio | Yes — unlimited | None | No | Google Ads / GA4 reporting |
| Metabase | Open source (self-hosted) | Server + config | No | Technical teams with SQL databases |
| Grafana | Open source (self-hosted) | Server + config | No | DevOps and infrastructure monitoring |
| Tableau Public | Yes — but data is public | None | No | Portfolio work, public datasets |
Infograph
What free means: One dashboard. 500 AI credits. No credit card required. That’s it — you sign up, connect your data, and build.
Infograph is the newest tool on this list, and the only one that generates dashboards from a plain-English prompt. You describe what you want — “show me monthly revenue by region with a trend line” — and the AI builds it. Connect a Google Sheet, Excel Online file, or CSV, and you’re looking at a live dashboard in under a minute.
The free tier is genuinely free. Not a 14-day trial. Not a credit card that auto-charges. You get one dashboard and 500 AI credits (~$0.50 worth), which is enough to build and iterate on a solid dashboard without spending anything.
Best for: Anyone who wants a dashboard fast and doesn’t want to spend a day configuring connectors. Particularly strong for small teams, freelancers, or solo founders who just need their Google Sheet to look like a dashboard.
Honest caveat: One dashboard is limiting if you have multiple projects. The Pro plan is $19.99/month — reasonable, but it’s a real upgrade cliff if you need more than one.
Google Looker Studio
What free means: Genuinely free, unlimited dashboards, no credit card. Google owns it, it’ll stay free.
Looker Studio (formerly Data Studio) connects directly to Google Ads, Google Analytics 4, BigQuery, and Google Sheets with zero friction. If you live in the Google ecosystem, it’s hard to beat. You can build a solid GA4 report in 20 minutes with no prior experience.
Outside the Google ecosystem, it gets harder. Non-Google connectors exist but many require third-party paid tools (Supermetrics, etc.). The UI is functional but dated — you’re dragging and resizing boxes, not describing what you want. No AI generation.
Best for: Marketing teams running Google Ads and GA4 campaigns who need free reporting without any setup.
Honest caveat: Looker Studio is a Google product, which means the roadmap is Google’s call. The UI hasn’t changed much in years. If your data lives outside Google, you’ll hit walls quickly.
Metabase
What free means: Open source = you can run it for free, but you need a server. Metabase offers a cloud version with a 14-day trial — that’s not free. The free option is self-hosted.
Metabase is excellent if you have a SQL database and a technical person on your team. The interface is clean, non-technical users can query data without writing SQL, and the visual options are solid. It’s genuinely one of the best BI tools available.
But “self-hosted” isn’t nothing. You need a server (a $5/month DigitalOcean droplet works), you need to install it, configure it, and maintain it. For a small team that just wants to chart their spreadsheet, that’s way too much friction.
Best for: Engineering teams or technically capable startups who want a proper BI tool on their database and don’t want to pay SaaS prices.
Honest caveat: If “set up a server” is not something your team does, Metabase free isn’t for you.
Grafana
What free means: Same as Metabase — open source, self-hosted. Grafana Cloud has a free tier with limits (10k metrics, 50GB logs), but the full self-hosted version is free.
Grafana is the best tool on this list for what it does: monitoring infrastructure, application performance, and time-series metrics. If you’re tracking server latency, error rates, or Kubernetes cluster health, Grafana is unmatched.
For business dashboards — sales numbers, revenue charts, customer data — it’s the wrong tool. Grafana is built around metrics and time-series data. Pulling in a spreadsheet to show pipeline by rep is doable but awkward.
Best for: DevOps engineers, SREs, and infrastructure teams who need real-time monitoring dashboards.
Honest caveat: If you’re a business user looking at sales or marketing data, don’t start here. The learning curve exists and the tool isn’t designed for your use case.
Tableau Public
What free means: Free, browser-based, no credit card — but every dashboard you publish is publicly visible. Your data is public.
Tableau Public is the free version of Tableau, one of the most powerful BI platforms out there. The viz options are genuinely impressive, the community is huge, and you can build things in Tableau Public that you can’t easily replicate elsewhere.
The catch is the name: Public. Everything you build is published to Tableau’s public gallery and anyone can download your data. That’s fine for journalists, researchers, or students building portfolio pieces on public datasets. It’s a dealbreaker for any real business data.
Best for: Data journalists, students, and analysts building portfolio work with public datasets.
Honest caveat: Not for business data. Not negotiable.
The Verdict
These tools aren’t really competing — they serve different people.
- Use Infograph if you have a spreadsheet or CSV and want a dashboard now, without setup, without code, without a credit card.
- Use Looker Studio if all your data is in Google products and you need solid, free reporting.
- Use Metabase if you have a SQL database and an engineer willing to run a server.
- Use Grafana if you’re monitoring infrastructure.
- Use Tableau Public if you’re working with public data and want impressive visuals.
For most people reading this — small teams, freelancers, founders — the real choice is between Infograph and Looker Studio. If your data is in Google Sheets already and you’re reporting on Google Ads or GA4, Looker Studio is a natural fit. If you want something faster, smarter, and not locked to Google, try Infograph.
Try Infograph free — one dashboard, no credit card, built in seconds. Start here →


