JSONL files — also called NDJSON, newline-delimited JSON — are everywhere once you start building anything serious. API logs, LLM output streams, Kafka consumers, ML training pipelines. Every line is a valid JSON object. The format is efficient, append-friendly, and completely unreadable to anyone without a terminal.
That’s the problem. You have data. You can’t show it to anyone.
What Makes JSONL Different
A regular JSON file is one big object or array. JSONL is one JSON object per line, no enclosing array, no commas between records. That makes it trivially easy to stream and append — you just write a new line. It’s why every major log aggregator and data pipeline defaults to it.
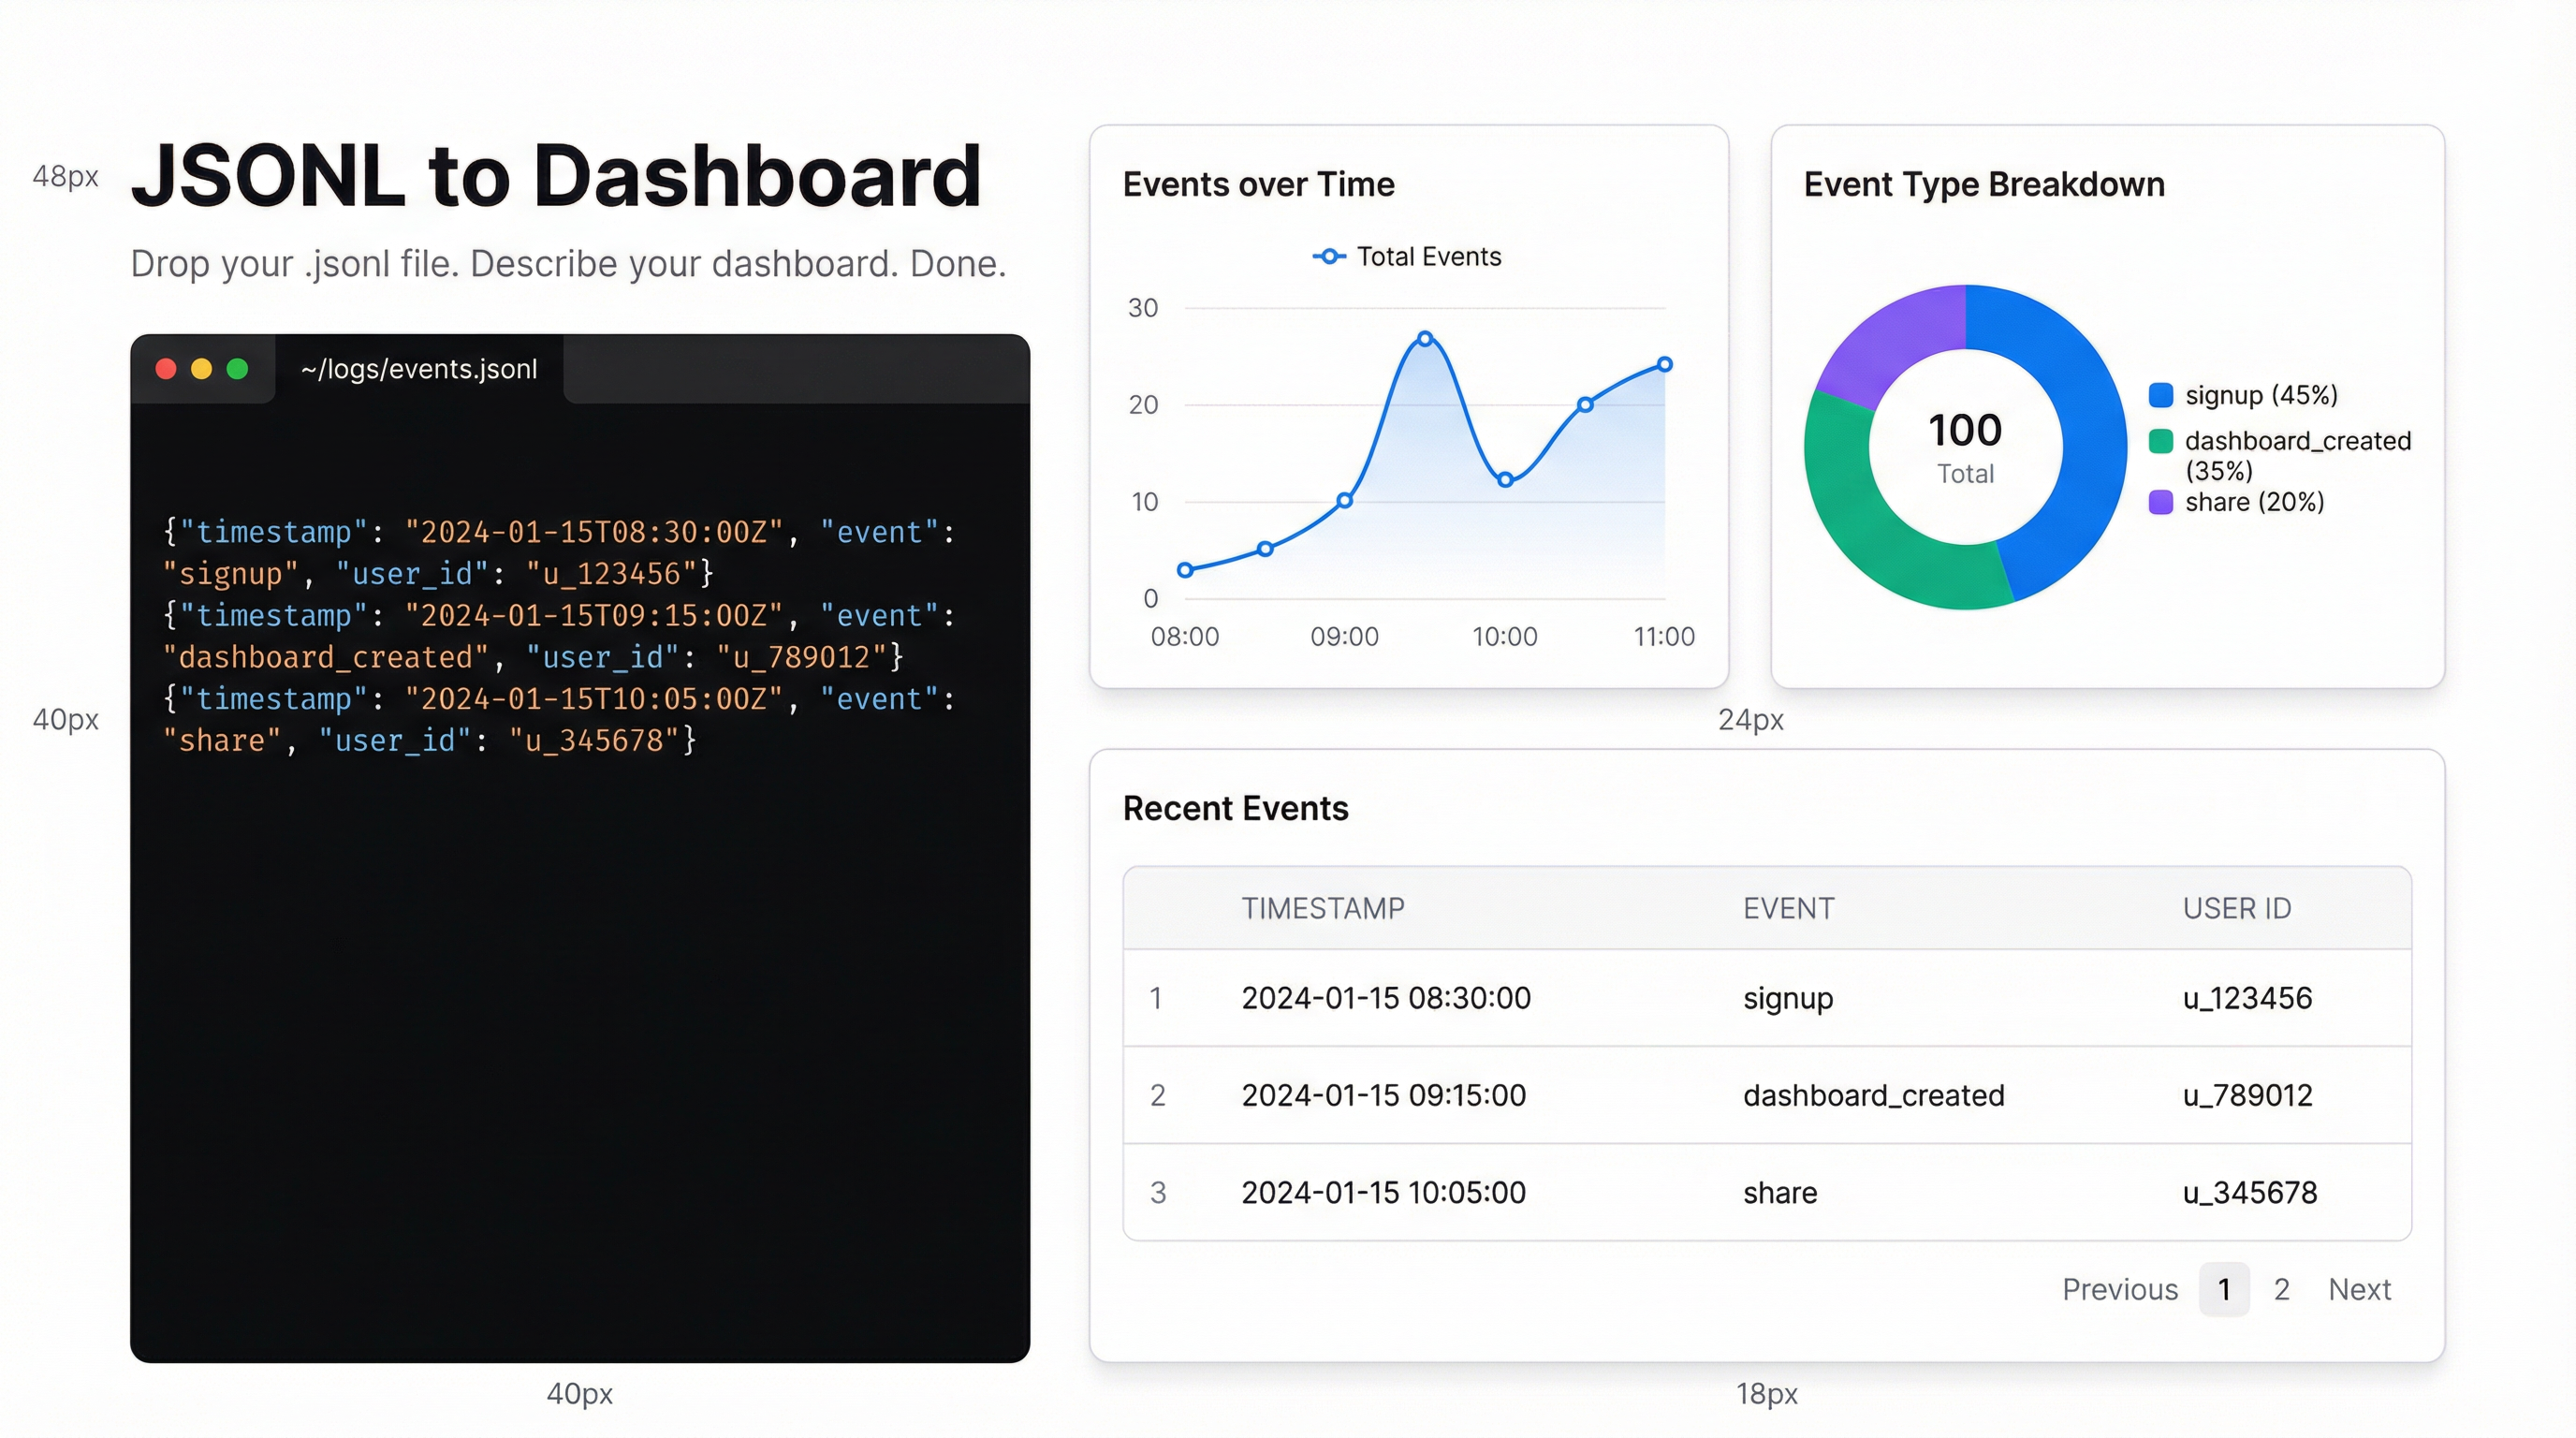
{"timestamp":"2026-03-20T09:00:00Z","event":"signup","user_id":"u_1421","plan":"pro"}
{"timestamp":"2026-03-20T09:00:03Z","event":"dashboard_created","user_id":"u_1421","dashboard_id":"d_889"}
{"timestamp":"2026-03-20T09:02:11Z","event":"share","user_id":"u_1421","share_type":"public"}
Three lines. Three events. Each self-contained. Perfect for log shipping — terrible for monthly reporting.
The standard approaches are painful. jq is powerful but requires you to know what you’re looking for. Python with pandas works if you can write pd.read_json(lines=True) in your sleep. Grafana or Kibana will consume JSONL but only after you’ve wired up the stack. None of these are what you reach for when you just need to answer “what’s the signup-to-activation rate this week?”
Upload JSONL to Infograph
Infograph handles JSONL (and NDJSON — same format, different name) natively. Each line becomes a row. Nested fields get flattened. You can drop a .jsonl file directly.
Here’s the workflow:
1. Go to app.infograph.ai. Free account, no card needed.
2. Click “New Dashboard” and upload your file. Drag the .jsonl or .ndjson file in. Infograph reads line-by-line, flattens nested objects (so user.id becomes a column), and shows you a preview of the parsed schema.
3. Describe what you want. Type something like: “Show me signups per day as a line chart, a breakdown of events by type as a donut chart, and the top 10 user IDs by event count.”
4. Watch the dashboard build. The AI maps your prompt to the actual column names in your file, picks the right chart types, and assembles the layout. The whole thing takes a few seconds.
What the AI Does With Nested JSON
Flattening is where most tools fail. JSONL from a real system rarely has flat fields — you’ll have objects inside objects, arrays of strings, nullable fields. Infograph’s parser handles this. A field like:
{"metadata": {"region": "us-east", "version": "2.1"}, "latency_ms": 142}…becomes two columns: metadata.region and metadata.version, plus latency_ms. You can prompt against any of them immediately.
Arrays of primitives (like ["tag1", "tag2"]) get collapsed to a comma-separated string by default — not ideal for filtering, but fine for display. If you need array expansion, the cleanest approach is to preprocess with jq first: jq -c '.tags[]' events.jsonl > tags.jsonl.
Real Use Case: LLM Evaluation Logs
We used this internally to analyse a batch of LLM evaluation runs. The JSONL file had one record per test case: the prompt, the model response, scores for factuality and relevance, latency in milliseconds, and whether the run passed or failed.
Pasting that into Infograph and prompting “show me pass rate by model, average latency as a bar chart, and a scatter plot of factuality vs relevance score” produced a usable evaluation dashboard in about 20 seconds. That’s genuinely faster than writing the pandas code to do the same thing — and the result was shareable without setting up a Streamlit app.
Keeping It Live
If your JSONL data updates regularly — say, a nightly export from your logging system — you can connect Google Sheets as a bridge. Export your JSONL to a sheet via a script, then connect that sheet to Infograph. The dashboard updates automatically when the sheet updates.
It’s not as elegant as a direct JSONL stream, but it works for daily reporting without any infrastructure overhead.
Try It With Your Own Data
Drop your .jsonl file at app.infograph.ai and describe the dashboard you want. If your file is small enough to email, it’s small enough to get you a working dashboard in under a minute.