The pitch is always the same: connect your data, click a few things, ship a dashboard. In practice, most no-code dashboard tools require a spreadsheet, a YouTube tutorial, and a full afternoon.
A few don’t. Here’s an honest breakdown.
What ‘No-Code’ Actually Means for Dashboards
No-code tools exist on a spectrum. Some just hide SQL behind a GUI — you’re still writing logic, just with dropdowns instead of text. Others are genuinely configuration-free: you describe what you want and the tool figures out the rest.
For dashboards specifically, the meaningful distinction is:
Field-mapping tools. You pick your data source, assign columns to chart fields, configure each visual manually. Powerful but slow — building a 10-metric dashboard takes an hour.
Prompt-driven tools. You describe what you want in plain English. The tool reads your data structure and builds the dashboard from your description. Fast, and accessible to anyone who can write a sentence.
Most tools marketed as ‘no-code’ are in the first category. They’re no-code in the sense that you don’t write code — but there’s still plenty of configuration work.
The Best No-Code Dashboard Builders
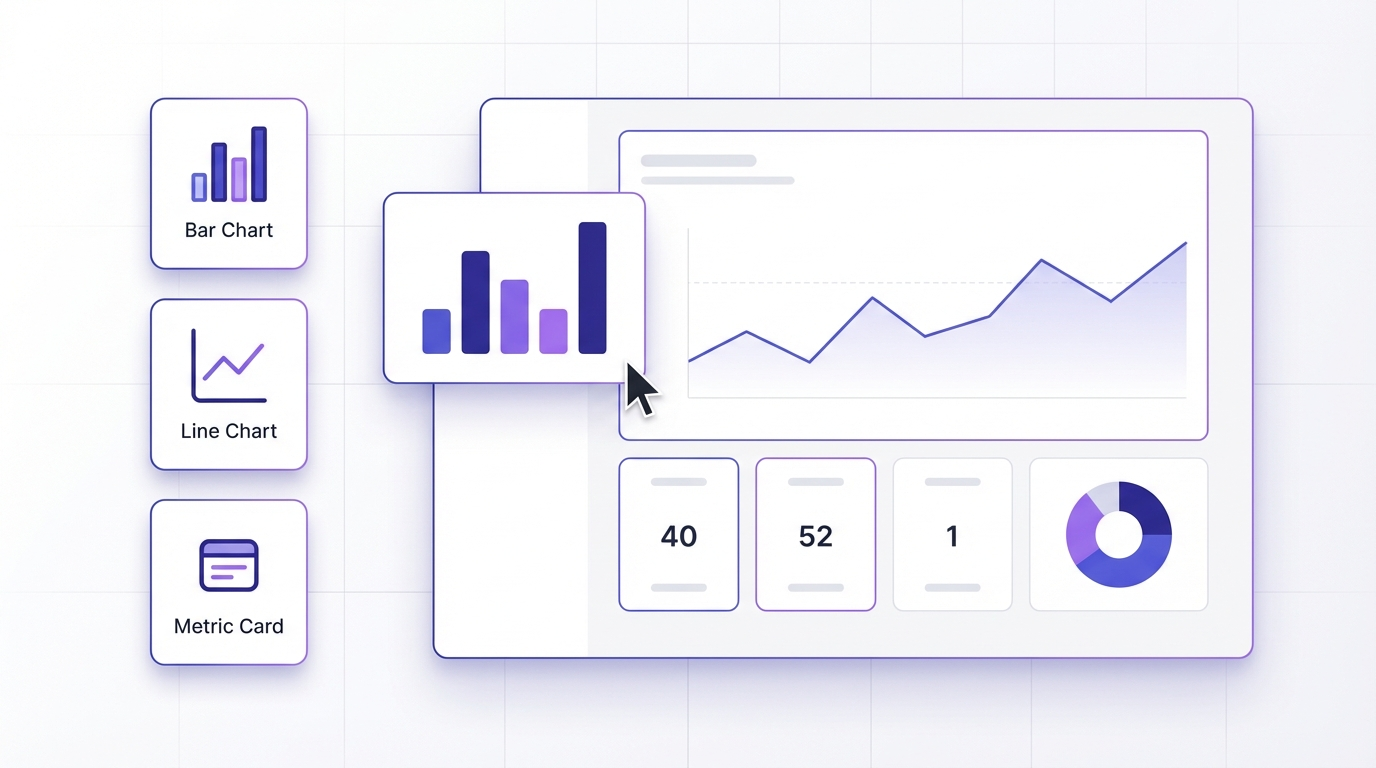
Infograph — Best for non-technical users building from their own data
Infograph takes the prompt-driven approach. Upload a CSV, connect a Google Sheet or Excel file, describe your dashboard, and watch it build.
The genuine differentiator is live data. When your Google Sheet updates, the dashboard updates automatically. Most no-code tools make you re-upload or re-sync manually.
Free tier: 1 dashboard, 500 AI credits, no credit card required. You can build and share a full dashboard before paying anything.
Best for: founders, small teams, analysts, and anyone who has data in a spreadsheet and wants a real dashboard fast.
Tableau Public — Best for complex data storytelling
Tableau is the industry standard for data visualisation. Tableau Public is the free version — powerful, but it publishes your data publicly (no private dashboards).
The learning curve is real. If you haven’t used Tableau before, expect to spend time learning the interface before you can build anything useful.
Free tier: Yes, but your dashboards are public. Not suitable for proprietary data.
Best for: data professionals who want maximum visualisation flexibility and don’t mind the learning investment.
Retool — Best for internal tools
Retool isn’t really a dashboard tool — it’s an internal tool builder that can produce dashboard-like interfaces. If you need to build something that also writes data back to a database, Retool is worth looking at.
It’s not no-code in any meaningful sense for non-technical users. You’ll be configuring queries and components throughout.
Free tier: Limited to 5 users on internal apps.
Best for: developers building internal tools, not teams who want quick dashboards.
Google Looker Studio — Best for Google Workspace users
Looker Studio (formerly Data Studio) is free, integrates tightly with Google Analytics, Google Sheets, and BigQuery, and produces clean reports.
The interface is drag-and-drop rather than prompt-driven, so building dashboards is slower than it looks in screenshots. But for teams already deep in the Google ecosystem, it’s a reasonable starting point.
Free tier: Completely free.
Best for: marketing teams, agencies, or anyone building reports from Google Analytics data.
Rows — Best for spreadsheet-native dashboards
Rows is a spreadsheet with built-in chart blocks and data connectors. If your mental model is ‘spreadsheet with better sharing’, Rows fits naturally.
Not really a dashboard tool in the traditional sense — more of a collaborative spreadsheet that happens to produce shareable visuals.
Free tier: Available.
Best for: users who want to stay in a spreadsheet paradigm.
Which One Should You Use?
If you have data in a spreadsheet and want a dashboard fast — use Infograph. It’s the only tool here where you describe what you want and it builds for you, and the live data connection means your dashboard stays accurate without manual maintenance.
If you’re a data professional who needs full visualisation control — Tableau Public if your data can be public, Tableau Desktop if not.
If you’re in the Google ecosystem and want something free — Looker Studio.
If you’re a developer building internal tools — Retool.
The ‘best’ tool is the one you’ll actually use. For most non-technical teams, that means the one that takes the least configuration to get to a working dashboard.


