Most Google Sheets dashboard tutorials have the same problem: the dashboard is a snapshot. You export, embed, or screenshot your charts, and the moment the data changes, the dashboard is stale.
That’s not a dashboard. That’s a chart from last Tuesday.
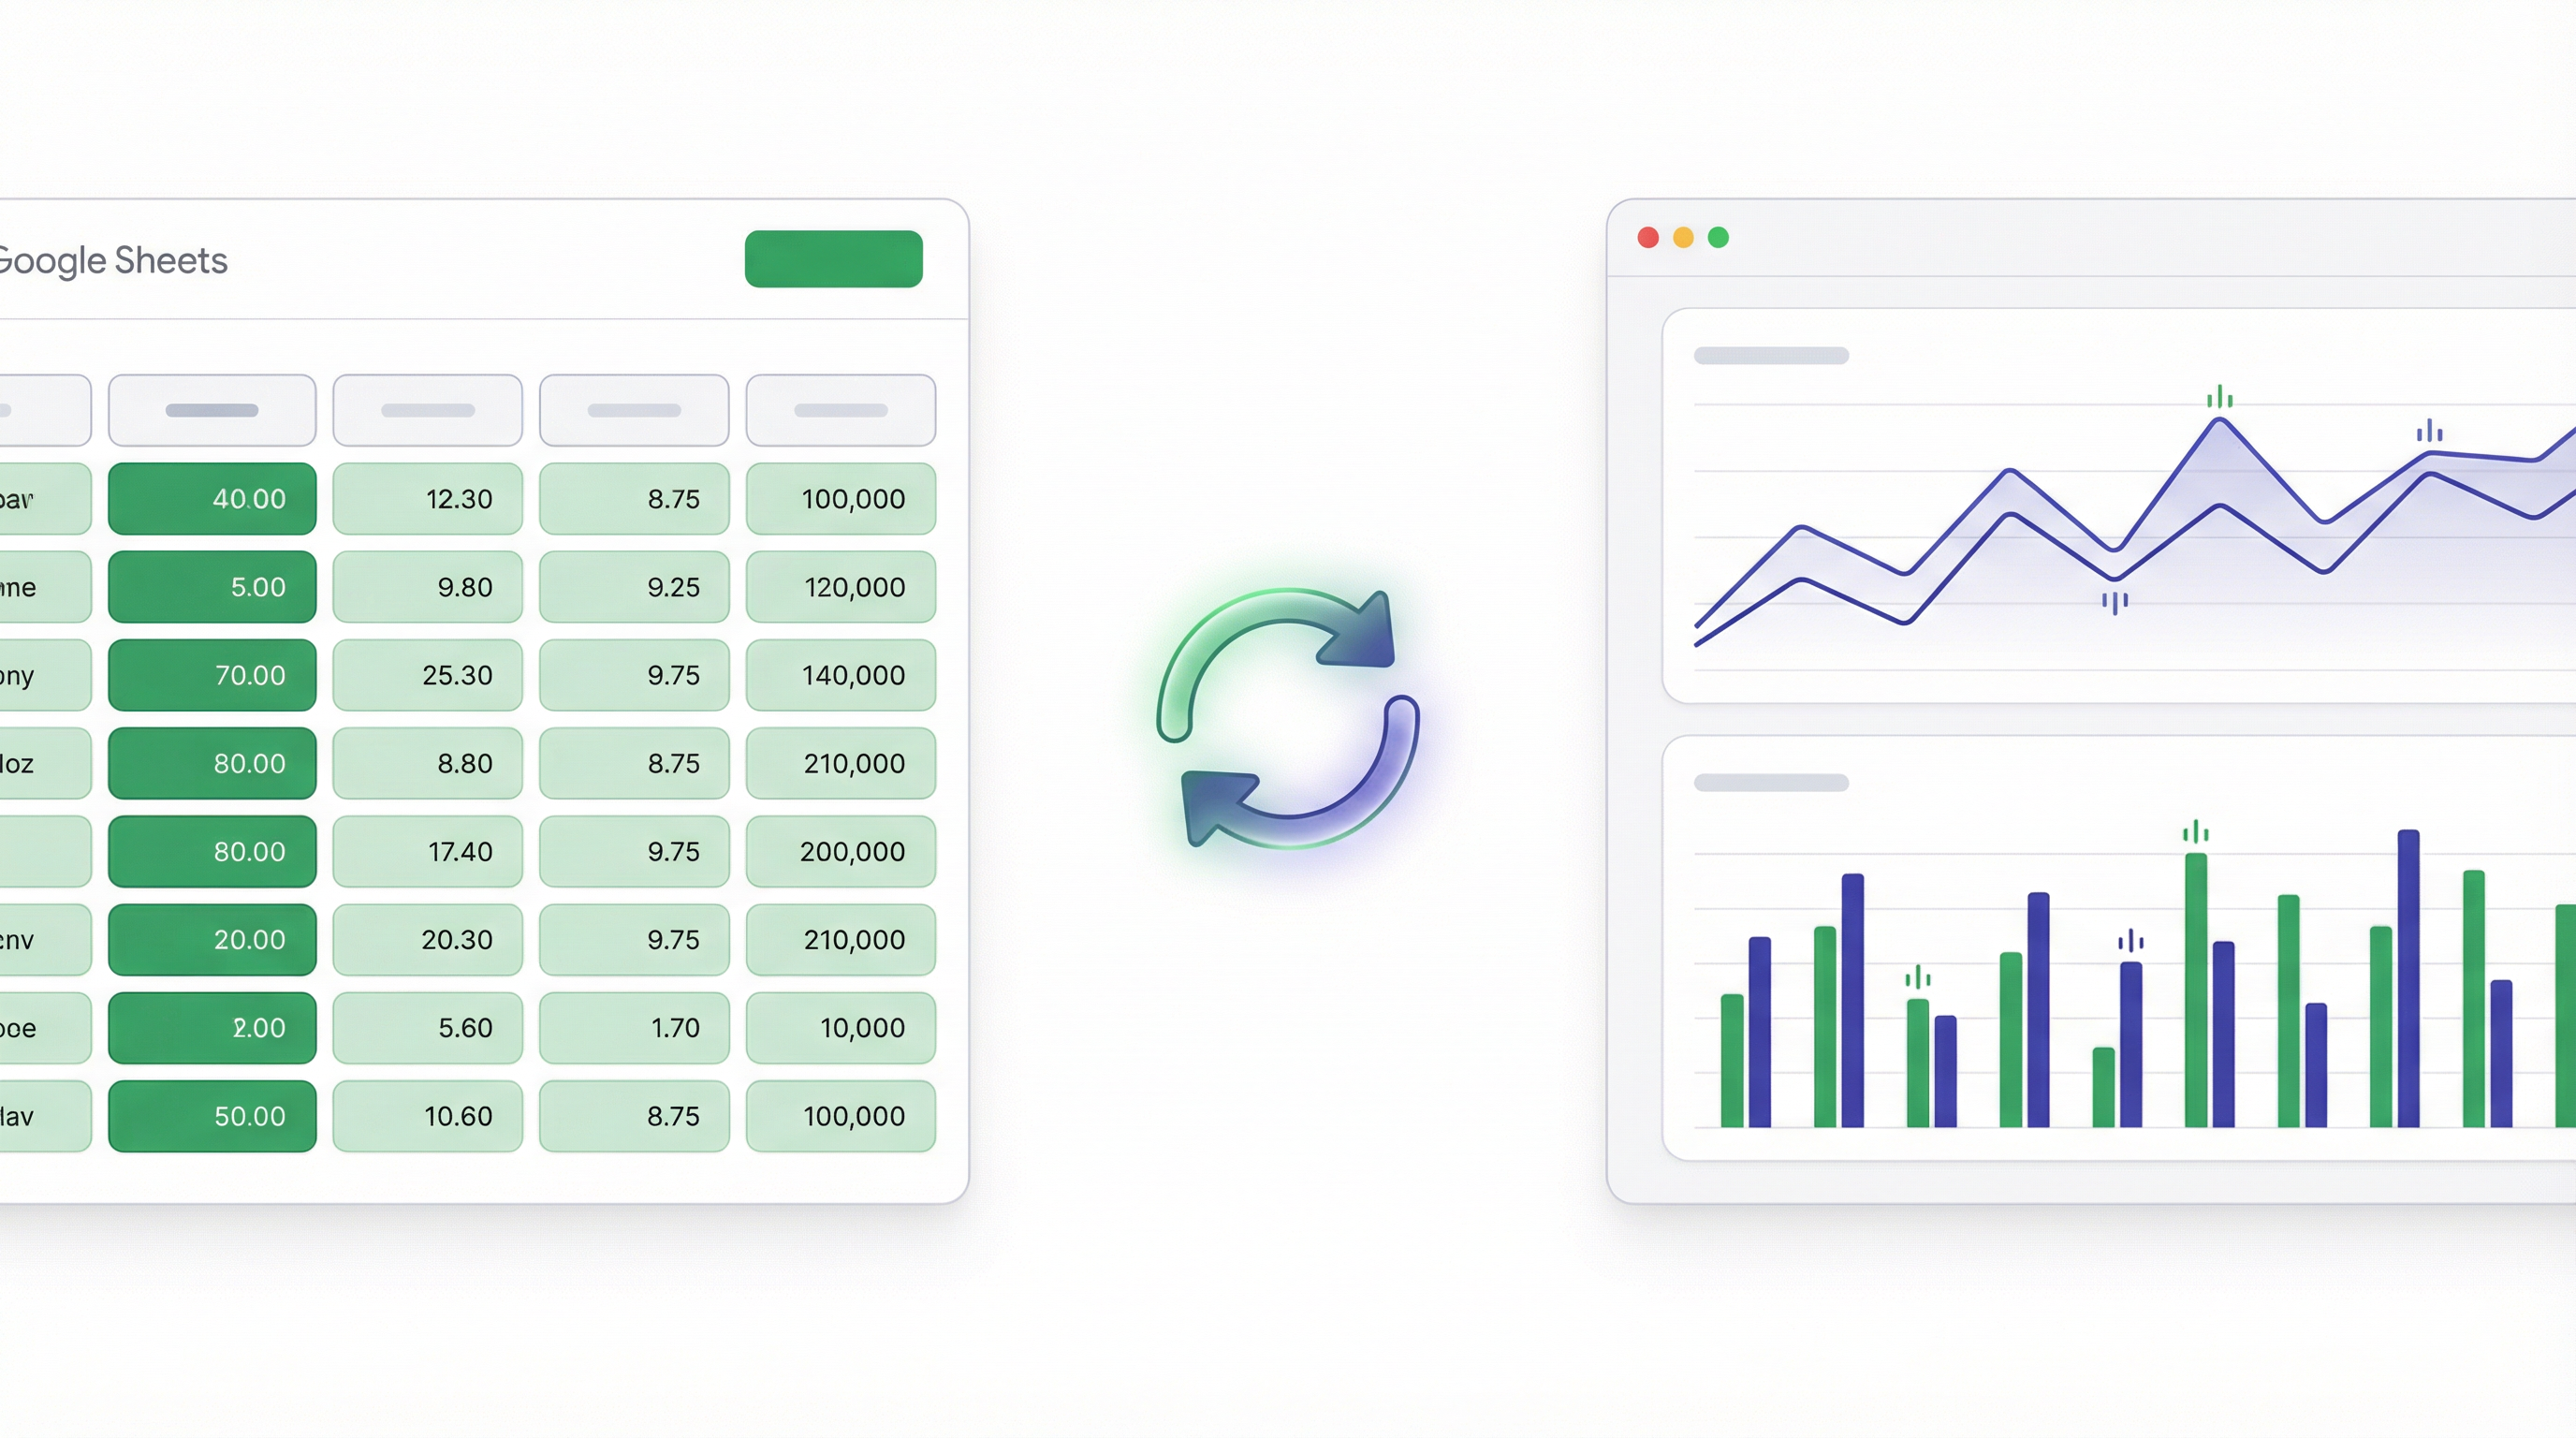
Here’s how to build a Google Sheets dashboard that actually stays live — automatically updating when your sheet changes, shareable with anyone, without rebuilding it every week.
Why Live Data Matters
If your team updates a Google Sheet daily — sales numbers, marketing spend, support tickets, project status — a static dashboard defeats the purpose. You’d spend as much time maintaining it as you save by having it.
A live dashboard solves this. Connect the sheet once. Every time the data changes, the dashboard reflects it. Your team always sees current numbers. You don’t touch the dashboard again unless you want to change what it shows.
This is Infograph’s core differentiator for Google Sheets users. The connection is live — not a daily sync, not a manual refresh. When the sheet updates, the dashboard updates.
The Workflow: Sheet to Live Dashboard
Here’s exactly how to do it.
Step 1: Sign In to Infograph
Go to app.infograph.ai and create a free account. No credit card required.
Step 2: Create a New Dashboard and Connect Your Sheet
Click “New Dashboard” and choose “Google Sheets” as your data source. You’ll be prompted to authorise with your Google account — this is the standard Google OAuth flow, the same one you use to connect apps to Drive or Calendar.
Once authorised, you’ll see a list of your recent Sheets. Select the one you want to connect. If it has multiple tabs, choose which tab to use.
That’s it. The connection is established. Infograph can now read from that sheet, and it’ll re-read it automatically when the data changes.
Step 3: Describe Your Dashboard
Type what you want to see. Be specific:
“Show weekly revenue as a line chart over the last 3 months. Add a bar chart for leads by source. Include a metric card showing total revenue this month and percentage change from last month.”
Infograph reads your column headers and builds the charts from your description. If your sheet has a column called “Lead Source” and you described “leads by source,” it maps those correctly — you don’t configure anything manually.
Step 4: Iterate
The first version is a starting point. Keep prompting to get it right:
“Change the revenue chart to show daily instead of weekly.” “Add a table showing the top 10 individual deals.” “Group the leads chart by month instead of by source.”
Every prompt applies immediately. You’re refining the view, not rebuilding the dashboard.
Step 5: Publish and Share
When the dashboard looks right, click Publish. You get a shareable URL. Share it with your team, embed it in a Notion doc, display it on a screen in the office. The link stays live — as your sheet updates, the dashboard at that URL updates too.
What If My Sheet Changes Structure?
This is the obvious question, and it’s worth being direct about.
If you add a new column to your sheet, Infograph will pick it up next time it reads the data. You can then prompt the dashboard to include that new data.
If you rename a column, the dashboard may break for that specific chart — it was built against the old column name. You’d need to update the affected chart with a new prompt.
If you restructure the sheet significantly — moving data to a new tab, changing header names, adding new columns — just ask the AI agent to fix the dashboard. It checks your updated sheet structure and rebuilds the affected charts to match. No manual reconfiguration, no starting from scratch.
For most real-world sheets, where you’re adding rows of data regularly but the structure stays the same, live connection works seamlessly without any maintenance at all.
Sharing With Your Team
Infograph’s Teams plan lets you restrict dashboard access to people within your organisation. Connect a sheet, build the dashboard, and share it knowing only your colleagues can view it.
On the free plan, published dashboards are publicly accessible to anyone with the link. That works fine for many use cases — sharing with a client, embedding in a public page, showing to investors.
For internal dashboards with sensitive data, the Teams plan ($49.99/month) gives you the access controls you need.
A Real Example: Marketing Performance Dashboard
Here’s a setup many marketing teams run:
The Sheet: A Google Sheet that gets updated weekly with campaign data — channel, spend, impressions, clicks, conversions, cost per acquisition. Owned by the marketing team.
The Dashboard: Connected to that sheet. Shows spend by channel as a bar chart, CPA trend over time as a line chart, and total monthly spend vs budget as a metric card.
The Result: Every Monday when someone updates the sheet, the dashboard refreshes automatically. The team views it at a weekly standup. The CEO checks it whenever they want without asking anyone for a report. No manual work after the initial setup.
That’s the version of dashboards that’s actually useful. Not a report you build and forget, but a window into live data that stays accurate without maintenance.
Getting Started
The free plan gets you one dashboard with a live Google Sheets connection. No credit card. Build it, connect your sheet, and see the live update happen — it’s the kind of thing that makes you wonder why you were doing it the other way.


