The ‘AI dashboard generator’ category has filled up fast. A year ago there were a handful of options. Now there are dozens, many making nearly identical claims. Most of them aren’t actually AI dashboard generators — they’re BI tools that added a chatbot.
Here’s an honest comparison of what’s actually worth using, who each tool is built for, and what you can do for free before committing.
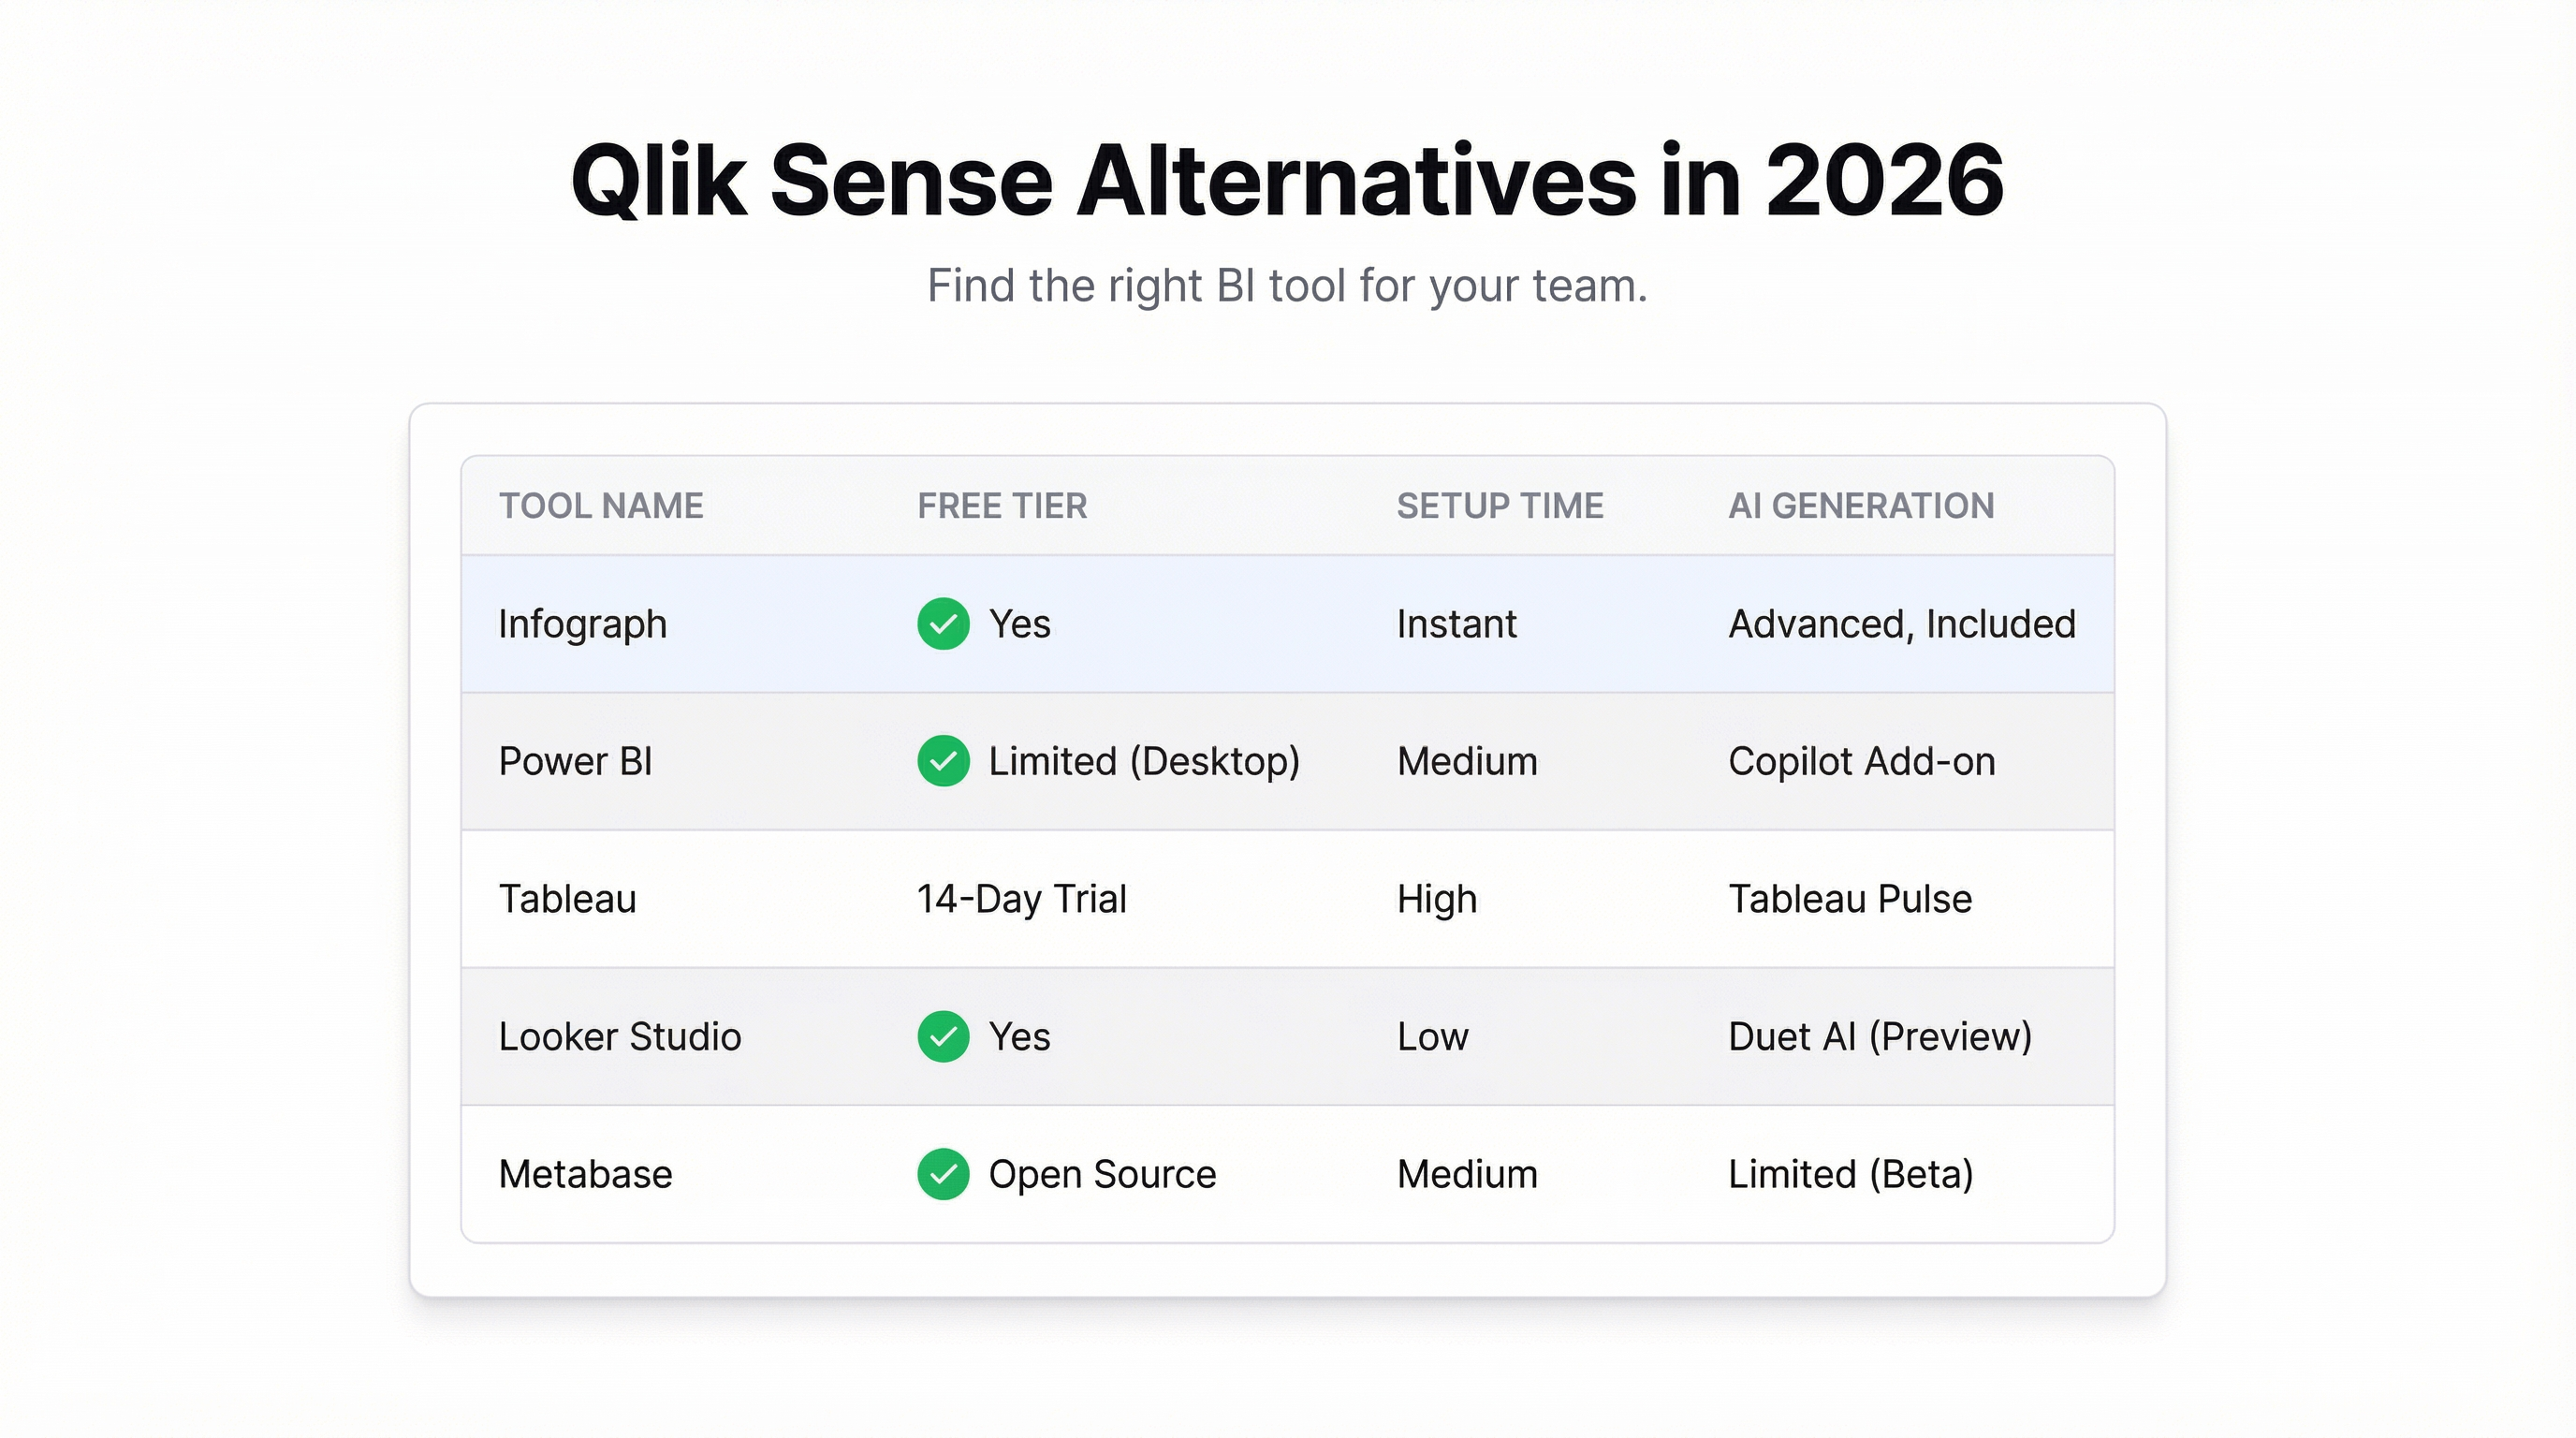
Quick Comparison
| Tool | Free Tier | Best For | AI Approach |
|---|---|---|---|
| Infograph | Yes — 1 dashboard, no CC | Non-technical users with spreadsheet data | Prompt-driven from upload |
| Tableau Public | Yes — public dashboards only | Data professionals, storytelling | Query assistant only |
| Polymer | Limited trial | E-commerce analysts | Natural language queries |
| Julius AI | Yes — limited | Data analysis, not dashboards | Chat with CSV |
| Rows | Yes | Spreadsheet-first teams | Formula/API assistance |
| Obviously AI | No | Predictive analytics | ML-first, not viz |
The Tools
Infograph — Best for non-technical users building from their own data
What it does: Upload a CSV, connect a Google Sheet or Excel file, describe your dashboard in plain English, and Infograph builds it. Live data connections mean the dashboard updates automatically when your spreadsheet changes.
What’s good: The prompt-driven interface is genuinely different from every other tool here. You don’t pick chart types or map fields — you describe what you want, and it builds. For non-technical teams, this removes the biggest barrier to building dashboards: the configuration overhead.
The live data connection is the other real differentiator. Most tools make you re-upload or re-sync manually. Infograph’s Google Sheets and Excel Online connections stay live permanently.
What’s not great: Less suitable for very complex visualisations or custom chart types that go beyond standard bar, line, pie, and metric cards. If you need a custom Sankey diagram or a highly configured waterfall chart, a traditional BI tool gives you more control.
Free tier: 1 dashboard, 500 AI credits, no credit card required. Full publishing and sharing included.
Pricing: Pro at $19.99/month (5 dashboards, live connections). Teams at $49.99/month (10 dashboards, 3 seats, access controls).
Tableau Public — Best for complex data storytelling
What it does: Tableau is the industry-standard visualisation tool. Tableau Public is the free version — the full Tableau Desktop feature set, but your dashboards are published publicly. No private dashboards on the free tier.
What’s good: Unmatched depth of visualisation options. If you can imagine a chart, Tableau can probably build it. The community is enormous, documentation is excellent, and data storytelling capabilities are genuinely best-in-class.
What’s not great: The learning curve is steep. Building your first Tableau dashboard takes hours of learning, not minutes of prompting. The AI features are limited to a query assistant that helps write calculated fields — not an AI that builds dashboards for you.
The free tier requires your data to be public, which rules it out for any proprietary business data.
Free tier: Yes, but dashboards are publicly visible. Not suitable for private data.
Pricing: Tableau Creator at $75/user/month.
Polymer — Best for e-commerce analysts
What it does: Upload a dataset (CSV, Shopify export, Google Analytics) and Polymer creates a set of views with natural language querying. Strong focus on e-commerce use cases.
What’s good: Good automatic chart generation from structured data. Reasonable natural language querying once the data is loaded.
What’s not great: Limited to the data types and use cases it was designed for. Less flexible for general-purpose dashboards. Free trial is short — you hit paywalls quickly.
Free tier: Limited trial only.
Pricing: Starts around $10/month.
Julius AI — Best for data analysis (not dashboards)
What it does: Chat with your data. Upload a CSV, ask questions, get analysis back in natural language with supporting charts. More of an analysis tool than a dashboard builder.
What’s good: Excellent for exploratory analysis — “what’s the trend here?”, “which segment is growing fastest?”, “summarise this dataset”. Produces clear answers with explanatory charts.
What’s not great: The output is a conversation, not a dashboard. You get charts embedded in a chat thread, not a shareable, standalone dashboard you can publish and share as a link. Not the right tool if you need something your whole team can look at daily.
Free tier: Limited queries per month.
Pricing: Pro at $20/month.
Rows — Best for spreadsheet-native dashboards
What it does: A spreadsheet with built-in chart blocks, data connectors, and AI formula assistance. Build a spreadsheet, add chart blocks, share it publicly.
What’s good: If your mental model for dashboards is ‘a spreadsheet that looks good’, Rows fits naturally. Good for teams who want to stay in a spreadsheet workflow with better sharing.
What’s not great: It’s primarily a spreadsheet, not a dashboard builder. The dashboard capabilities are more limited than dedicated tools. The AI assistance is mostly about formulas and functions, not about generating visualisations from your data.
Free tier: Available.
Pricing: Scales with team size and usage.
Obviously AI — Best for predictive analytics
What it does: Build predictive ML models from your data without writing code. Useful for forecasting, classification, and regression — not primarily for dashboards or visualisation.
What’s good: Genuine ML capabilities for non-technical users. If you want to predict customer churn or forecast sales, Obviously AI does this without requiring data science skills.
What’s not great: The wrong tool if you want to visualise historical data. It’s a prediction tool, not a dashboard tool. No free tier.
Free tier: No.
Pricing: Starts at $75/month.
Which One Should You Use?
You have data in a spreadsheet and want a dashboard fast: Infograph. It’s the only tool here designed specifically for this — upload or connect your data, describe what you want, get a dashboard. Free to start.
You’re a data professional who needs full chart control: Tableau. Budget the time to learn it properly, and the depth is unmatched.
You want to ask questions about your data conversationally: Julius AI. Just don’t expect a shareable dashboard at the end.
You’re an e-commerce team: Polymer. Built for that use case specifically.
You want to forecast future values: Obviously AI. But that’s a different problem than dashboarding.
The AI dashboard space is still early. Most tools that claim to be “AI-powered” have added a query assistant to a traditional BI platform. The tools that are genuinely AI-native — where AI is the primary interface, not an add-on — are fewer, and Infograph is the one built specifically for the spreadsheet-to-dashboard use case.