Business intelligence used to mean one thing: a big, expensive tool that took months to set up, required a dedicated analyst to run, and produced reports that were already outdated by the time they shipped.
That model still exists. But it’s no longer the only option — and for most teams, it’s no longer the right one.
Here’s what’s actually changed in BI, and how to think about what to use.
The old model
Traditional BI tools — Tableau, Power BI, Looker — are powerful. They can connect to dozens of data sources, handle millions of rows, and produce beautiful, interactive reports. Used well, they’re impressive.
The problem was always the “used well” part.
Getting value from a traditional BI tool required: a data warehouse (so your data was in one place), a data engineer (to model the data), a BI developer (to build the reports), and an analyst (to interpret them). For companies with all four, it worked. For everyone else, it was a tool that sat mostly unused because no one had time to figure it out.
Even at companies with data teams, the process was slow. You had a question, you filed a ticket, you waited two weeks for a dashboard that answered a slightly different question than the one you asked.
What AI changes
AI doesn’t replace BI. It changes the interface.
Instead of writing SQL or dragging fields into a visual query builder, you describe what you want in plain English. “Show me monthly revenue by product line with a comparison to last year.” The AI figures out the right chart type, builds the query, and ships the visualization.
For people who couldn’t use BI tools before — because they didn’t know SQL, didn’t understand data modeling, or just didn’t have time to learn the tool — this is a fundamental shift. The barrier from “I have a question” to “I have an answer” drops from days to seconds.
What hasn’t changed
Data quality is still your problem. If your underlying data is wrong or inconsistently formatted, the AI will build a beautiful dashboard showing you the wrong thing. Garbage in, garbage out — AI doesn’t change that.
You still need to think about what questions to ask. AI can build a dashboard from a prompt, but it can’t tell you which metrics matter for your business. That thinking is still yours.
And complex, multi-source data modeling — joining your CRM to your data warehouse to your billing system — still requires engineering work. AI helps at the exploration and visualization layer, not the data engineering layer.
The new workflow
For most teams — those without a dedicated BI infrastructure — the new workflow looks like this:
Export your data from wherever it lives. Your CRM, your accounting software, your ad platform. Most systems export CSV or Excel.
Upload it or connect it live. With Infograph, you can upload a file directly or connect a Google Sheet or Excel Online file as a live data source. Live means the dashboard updates when the source updates — no manual refresh needed.
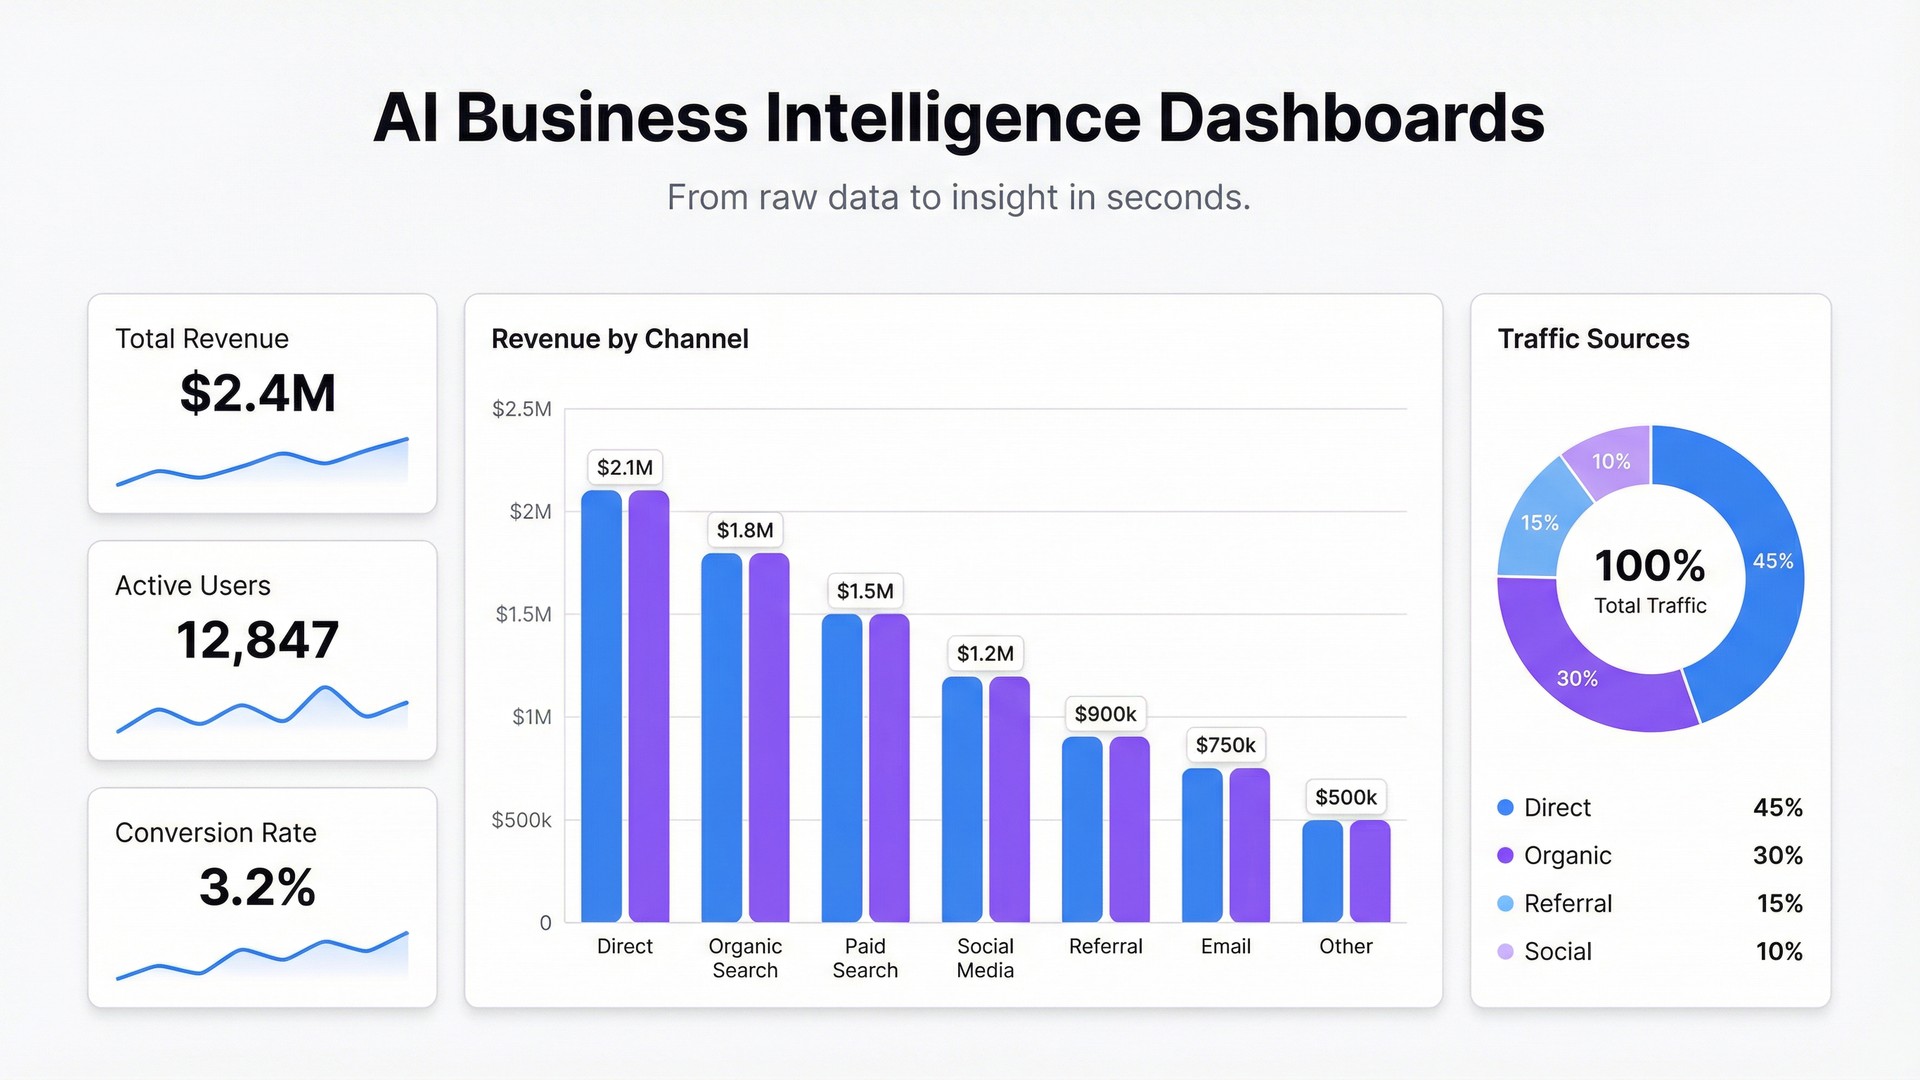
Describe what you want. Type in plain English: “Show sales pipeline by stage, revenue vs target by month, and close rate by rep.” The AI builds it.
Share it with your team. A link, a password if it’s sensitive, or restricted to your team only.
That’s a workflow that anyone on the team can run. Not just the analyst.
Comparing the approaches
| Traditional BI | AI BI Dashboard | |
|---|---|---|
| Setup time | Weeks to months | Minutes |
| Technical skill required | High (SQL, data modeling) | None |
| Data sources | Databases, warehouses | Files, spreadsheets, live connections |
| Customization | Very high | High |
| Cost | $$$+ | Free to low |
| Good for | Large orgs with data teams | Everyone else |
This isn’t an argument that traditional BI is bad. For large orgs with complex multi-source data needs, it’s still the right choice. But for teams under 200 people, teams without dedicated data analysts, or teams that just need answers faster — AI BI is the better starting point.
What to actually use
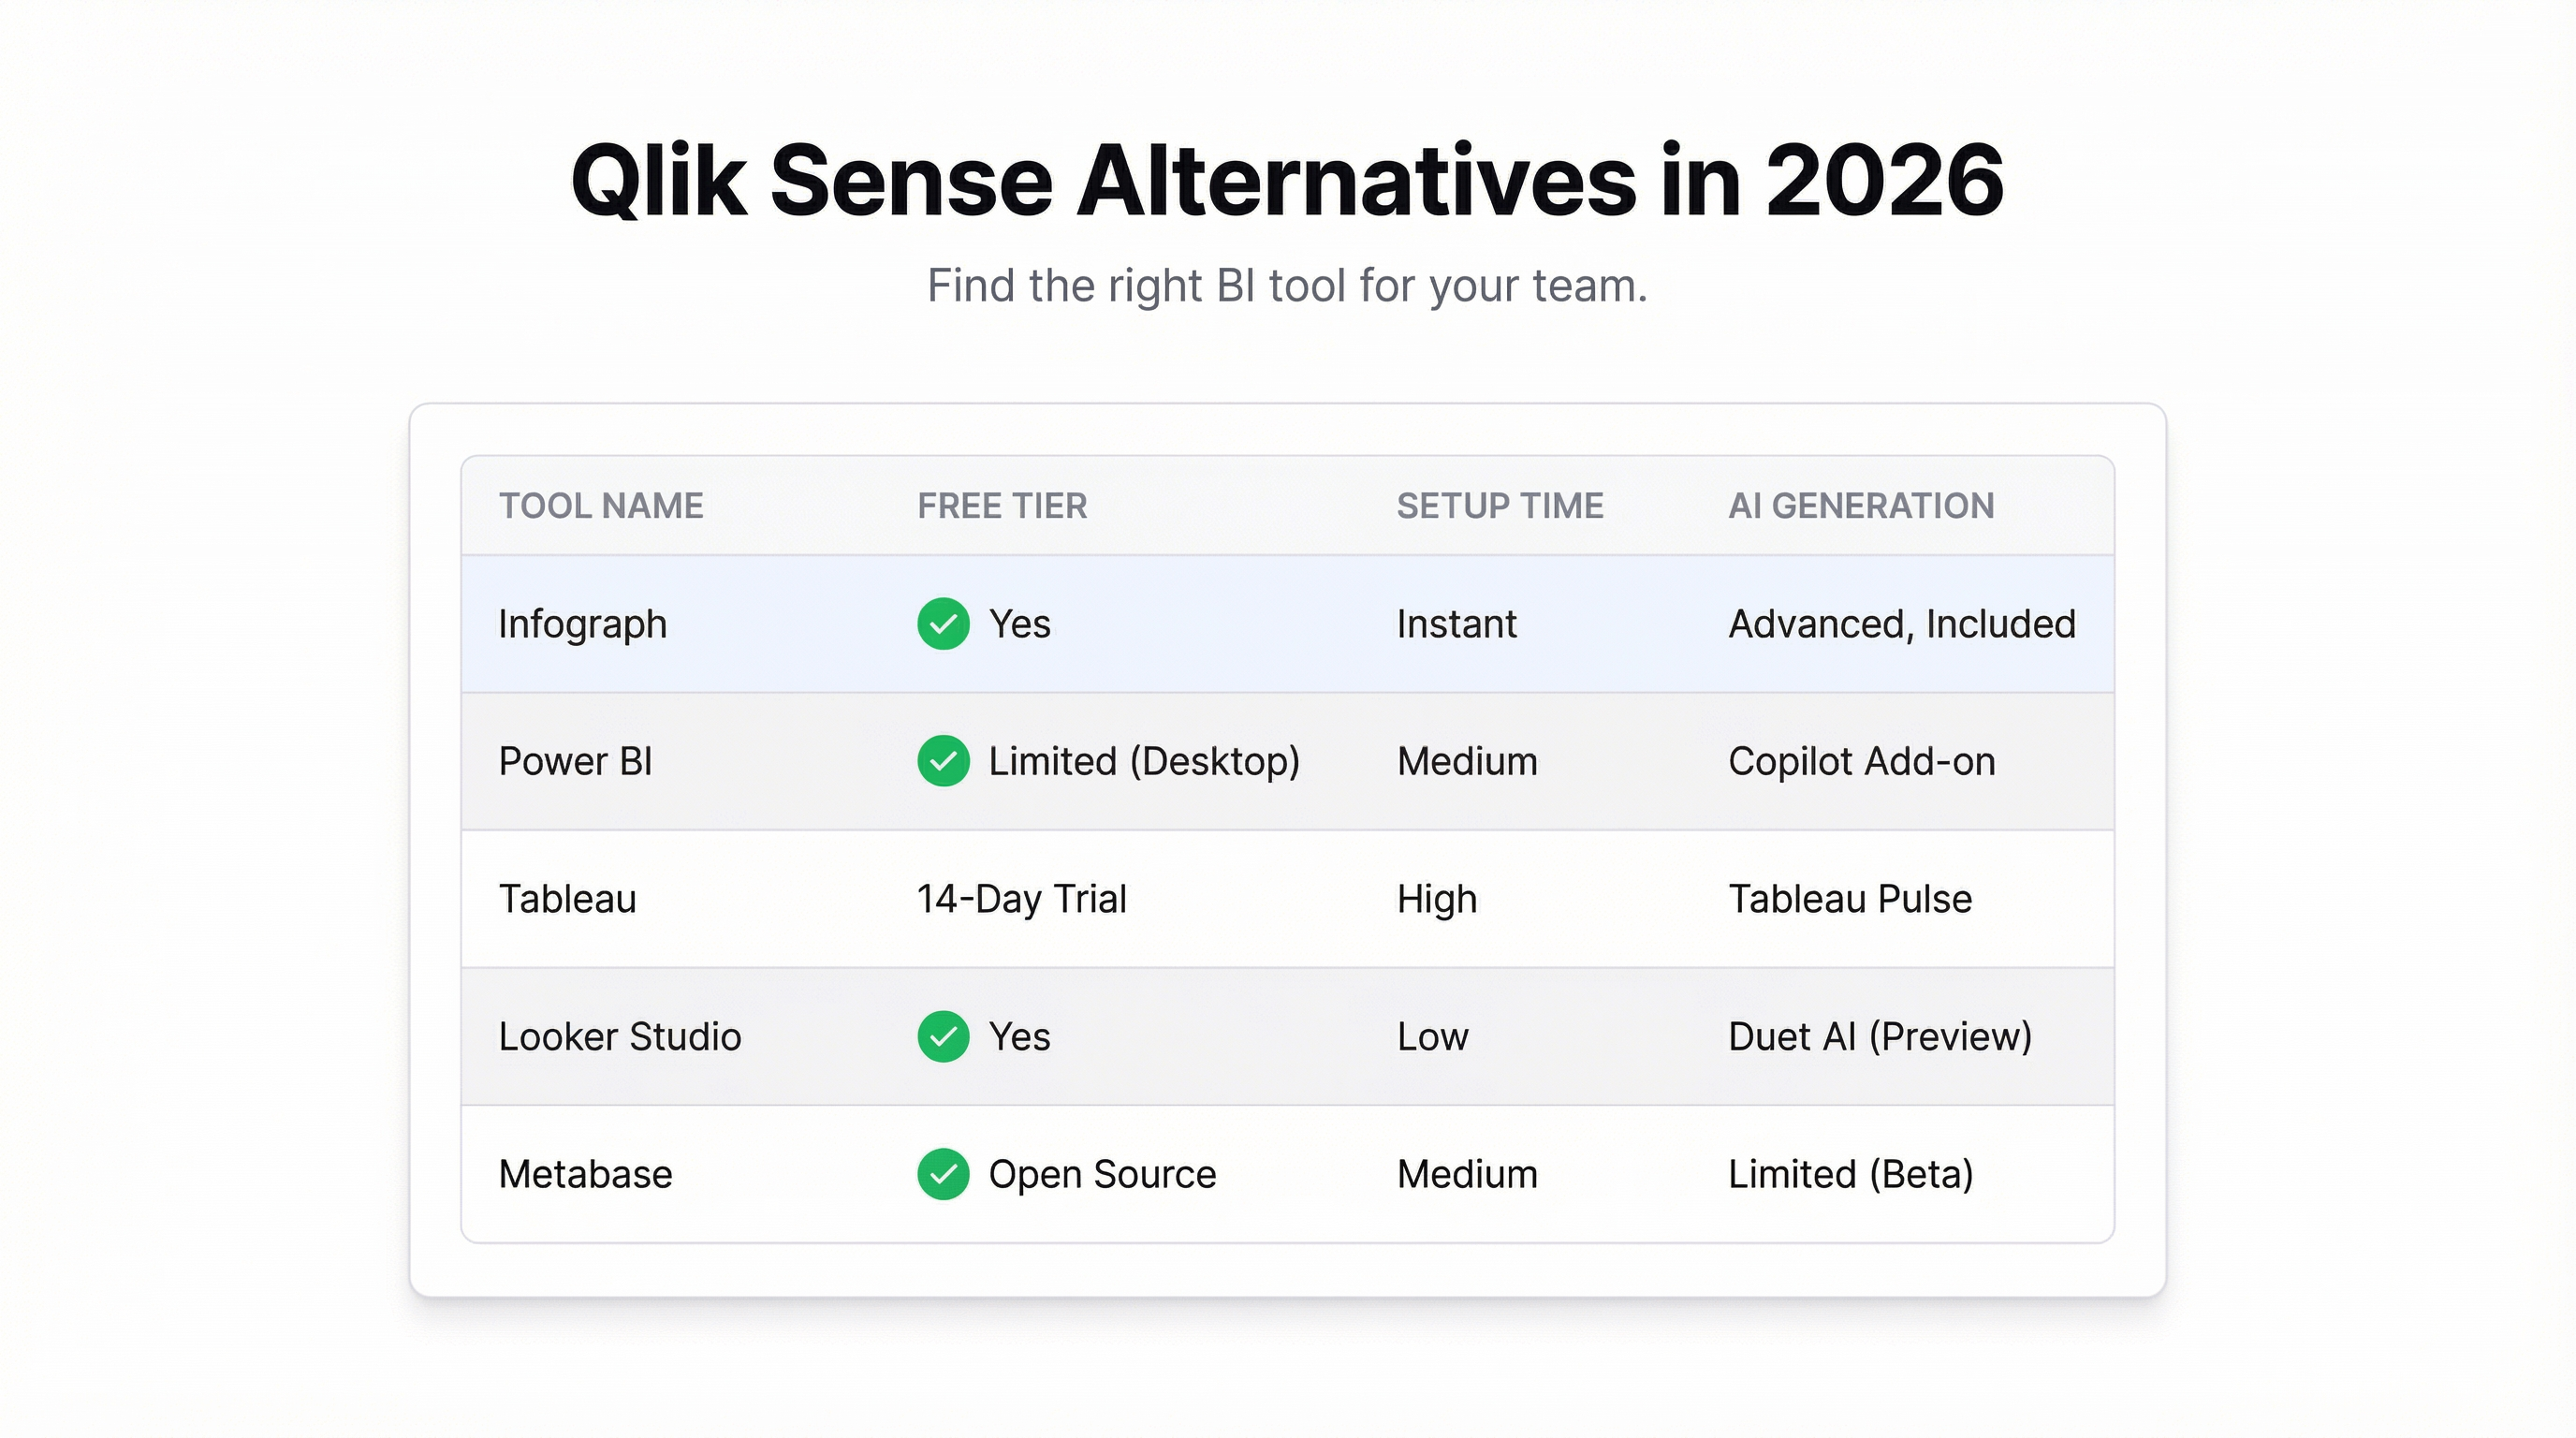
If you have a data team and a warehouse: Looker or Power BI. Spend the setup time, it pays off at scale.
If you’re a growing company without a dedicated data function: Start with Infograph. Connect your spreadsheets, upload your exports, describe your dashboards. You’ll get useful visualizations in minutes rather than months.
If you’re somewhere in between: The honest answer is to start simple and add complexity as you grow. A team of 30 does not need a data warehouse. They need a dashboard that connects to the Google Sheet they’re already maintaining and shows them what’s happening.
The shift that matters
The real change in BI isn’t the technology — it’s who can participate.
When building a dashboard required engineering resources and a BI developer, data was for the data team. Everyone else waited for reports.
When anyone can describe what they want to see and get a dashboard in seconds, data becomes a team capability, not a specialist one. That changes how fast decisions happen and who gets to make them.
Try Infograph free — upload your data, describe your dashboard, and see what AI-powered BI actually feels like in practice.