Qlik Sense has been around long enough to earn its reputation. The associative data engine — the thing that lets you click a value and have the rest of the dashboard filter contextually — is genuinely clever. Enterprise data teams loved it in 2016. A lot of them are still paying for it in 2026, mostly because switching feels painful.
But the complaints are consistent, and they’ve gotten louder: the licensing model is opaque, the setup requires a dedicated admin, and non-technical users hit walls that require IT tickets to solve. If you’re reading this, you’ve probably already hit one of those walls.
So let’s be direct about what Qlik does well, when it makes sense to leave, and what the alternatives actually look like.
When Qlik Sense Is Still the Right Call
Qlik is genuinely built for complex, multi-source enterprise data. If your organisation has a dedicated BI team managing data connections, security groups, and schema, and you need high-volume associative analysis across a dozen data sources simultaneously — Qlik’s engine has real advantages.
The associative model is legitimately different from most tools. In Tableau or Power BI, you apply filters. In Qlik, you make selections, and the entire data model responds. For analysts doing exploratory work across wide, interconnected datasets, this is valuable.
Qlik’s NPrinting for scheduled enterprise report distribution, its governance and lineage features, and its integration with enterprise data warehouses at scale — these are legitimate differentiators in large-org contexts.
If you’re in that world and have the IT infrastructure to support it: Qlik might be right for you. This post isn’t for you.
When Teams Should Look Elsewhere
Qlik’s pricing is enterprise-tier. The Qlik Sense Business plan starts around $30/user/month, and Qlik Sense Enterprise (which most organisations actually need for full functionality) requires custom contracts that routinely land at $100k+/year for meaningful team sizes. That’s not a complaint — it’s just the market they’re built for.
The second issue is setup time. Qlik Sense Self-Managed requires dedicated infrastructure. Qlik Cloud is easier, but still requires admin configuration, space management, and data connection setup that most small-to-mid teams don’t have someone qualified to own.
The third issue is the learning curve. Qlik’s scripting language (QlikScript) and set analysis syntax are things people study. There are certification courses. Reddit threads full of “why isn’t my set expression working” posts that date back years. For a team that just wants to see their monthly metrics, this is massive overkill.
The Alternatives
Infograph — Best for teams building from their own data
If Qlik is the enterprise battleship, Infograph is the fast motorboat that gets you to the same destination in a tenth of the time.
You connect your data — upload a CSV, link a Google Sheet, connect Excel Online — and describe the dashboard you want in plain English. Infograph reads your data, interprets your column headers, and builds the dashboard. Live data connections mean it updates automatically when your spreadsheet changes.
There’s no scripting, no schema mapping, no set analysis to learn. “Show me monthly revenue by region, with a target line at $50k” is a prompt, not a development task.
The free tier is a real test: one dashboard, 500 AI credits, no credit card required. Pro is $19.99/month. Teams is $49.99/month for three seats with access controls.
The honest limitation: Infograph is built for spreadsheet-and-file-based workflows. If you need to join a live Snowflake table to a PostgreSQL database with custom SQL, that’s not what it’s for. But for the majority of teams whose “data” lives in Google Sheets and CSVs, the complexity of Qlik is a tax, not a feature.
Power BI — Best for Microsoft-stack organisations
Power BI is the most direct Qlik competitor for teams already inside the Microsoft ecosystem. If your organisation runs on Azure, uses Office 365, and your data lives in Excel or SharePoint — Power BI Desktop is free and connects to all of it naturally.
Power BI Desktop (the local application) is genuinely free with no strings attached. Power BI Service (cloud sharing and collaboration) requires Microsoft 365 or a Power BI Pro license at around $10/user/month.
The learning curve exists — DAX, Power Query, and the data model take time to understand properly — but the documentation and community are enormous. There’s a reasonable path from “zero knowledge” to “functional dashboards” in a few weeks.
The issue is that Power BI’s strength is deeply tied to the Microsoft stack. If you’re not in that ecosystem, you’re working against the grain.
Tableau — Best for complex data storytelling
Tableau’s visualisation engine has no equal for sophisticated, multi-dimensional charts. If your dashboards need to tell complex stories with layered data — geographic analysis, drill-down hierarchies, custom blended calculations — Tableau gives you tools that Qlik and most other tools don’t.
Tableau Creator runs around $75/user/month on annual billing. The learning curve is steep — Tableau’s logic for data relationships, LOD expressions, and blending is its own language. But for professional data analysts working at high complexity, it’s the benchmark.
For most teams evaluating Qlik alternatives, Tableau is a lateral move on complexity and a step up on cost. It’s worth considering if visualisation depth is the primary need.
Looker Studio — Best free option for Google Workspace teams
Looker Studio (formerly Google Data Studio) is free and connects naturally to Google Sheets, Google Analytics, BigQuery, and a long list of Google products via built-in connectors.
It’s not as powerful as Qlik or Tableau, and its non-Google connectors require partner integrations that add cost and complexity. But for teams whose data lives in Google Sheets and whose reporting needs are standard — monthly summaries, marketing dashboards, simple KPI tracking — it works well and costs nothing.
The trade-off is a ceiling. Looker Studio dashboards hit limitations quickly when the data gets complicated. It’s a good tool for what it is; just don’t expect enterprise-grade modelling capability.
Metabase — Best for SQL-comfortable technical teams
Metabase is an open-source BI tool that connects directly to databases. If your team has engineers who can write SQL, Metabase is a clean, modern interface for building dashboards on top of Postgres, MySQL, Redshift, Snowflake, and more.
The open-source version is free to self-host. Metabase Cloud starts at $500/month for 5 users — not cheap, but far below Qlik Enterprise pricing. The interface is significantly simpler than Qlik, and the learning curve is manageable for technical users.
The limitation: non-technical users hit walls. Metabase’s question builder is friendly, but ad-hoc exploration still requires some understanding of data structure. It’s a BI tool, not an AI dashboard generator.
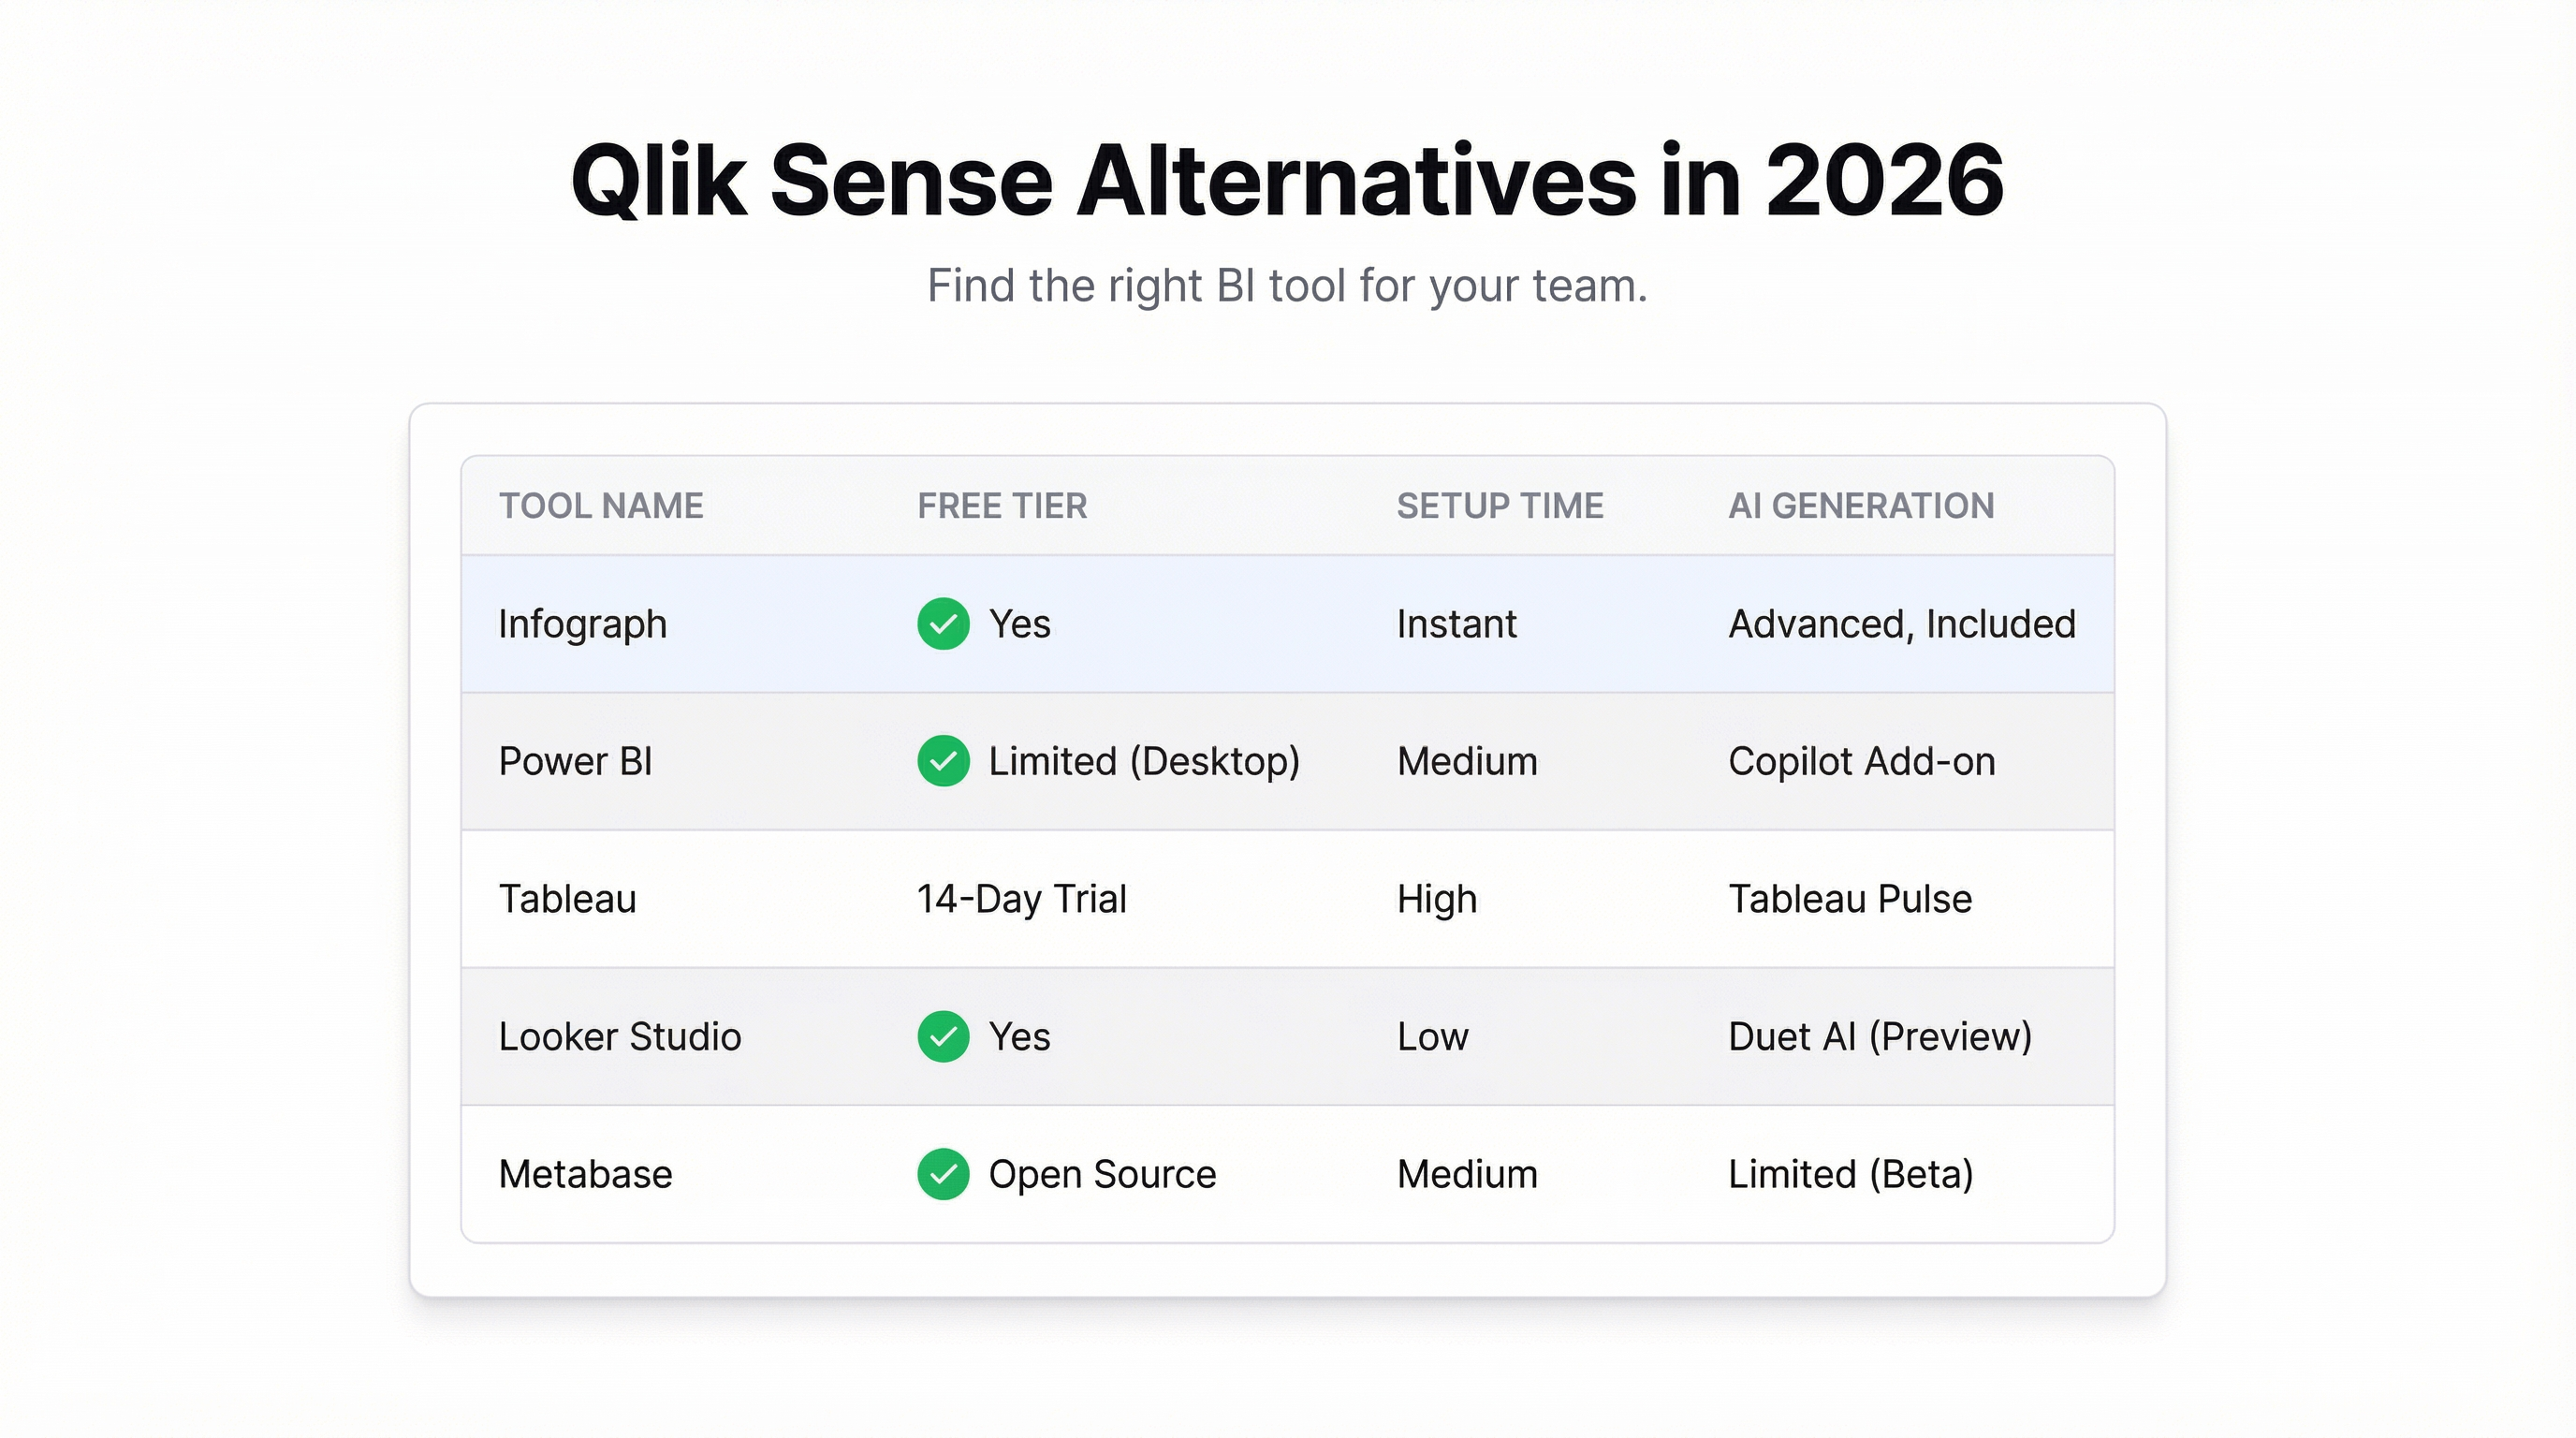
How They Stack Up
| Tool | Free Tier | Setup Time | AI Generation | Best For |
|---|---|---|---|---|
| Infograph | Yes — 1 dashboard, no CC | Minutes | Yes — prompt-driven | Non-technical teams, spreadsheet data |
| Power BI | Desktop only (no sharing) | Hours–days | Limited | Microsoft-stack organisations |
| Tableau | Public only | Days–weeks | No | Complex visualisation, analysts |
| Looker Studio | Yes — fully free | Hours | No | Google Workspace teams |
| Metabase | Self-hosted only | Hours | No | SQL-capable technical teams |
| Qlik Sense | No | Weeks | No | Enterprise data teams with dedicated BI |
The Real Question
Most teams switching away from Qlik aren’t switching because they found something with equivalent power. They’re switching because they realised they were paying enterprise BI prices to solve problems that don’t require enterprise BI tools.
If your data analysis involves joining seven tables in a proprietary scripting language with custom set expressions — Qlik is probably doing useful work. But if your actual problem is “I need a dashboard showing this month’s sales by rep, and I need it before Thursday” — the complexity is in the way.
Infograph was built for the second problem. Upload your data, describe the dashboard, done. No scripting, no admin overhead, no six-figure contract.