Most KPI dashboard templates are garbage. Not because the people who made them didn’t try — they did. They built something that looked great on the day they shipped it, for a company that doesn’t exist anymore, with data that doesn’t match yours. You download it, spend an hour reformatting columns, break three formulas, and end up with something worse than what you started with.
That’s the honest truth about templates. Here’s what to do instead.
What actually makes a good KPI dashboard
A good KPI dashboard does one thing: it tells you, at a glance, whether something needs your attention right now. That’s it. It’s not a reporting artifact. It’s not a slide deck. It’s a live signal.
That means a useful template has to satisfy a few hard constraints:
It connects to where your data actually lives. Not a CSV export from three weeks ago. Not a manually updated spreadsheet. If someone has to remember to update it, it won’t get updated.
It shows the metrics that matter for your business. Revenue growth for a SaaS company looks different than churn rate for a subscription box or fulfillment time for an ecommerce brand. Generic templates collapse all of this into a single mush of “sales,” “leads,” and “conversion” — labels that mean something different to everyone.
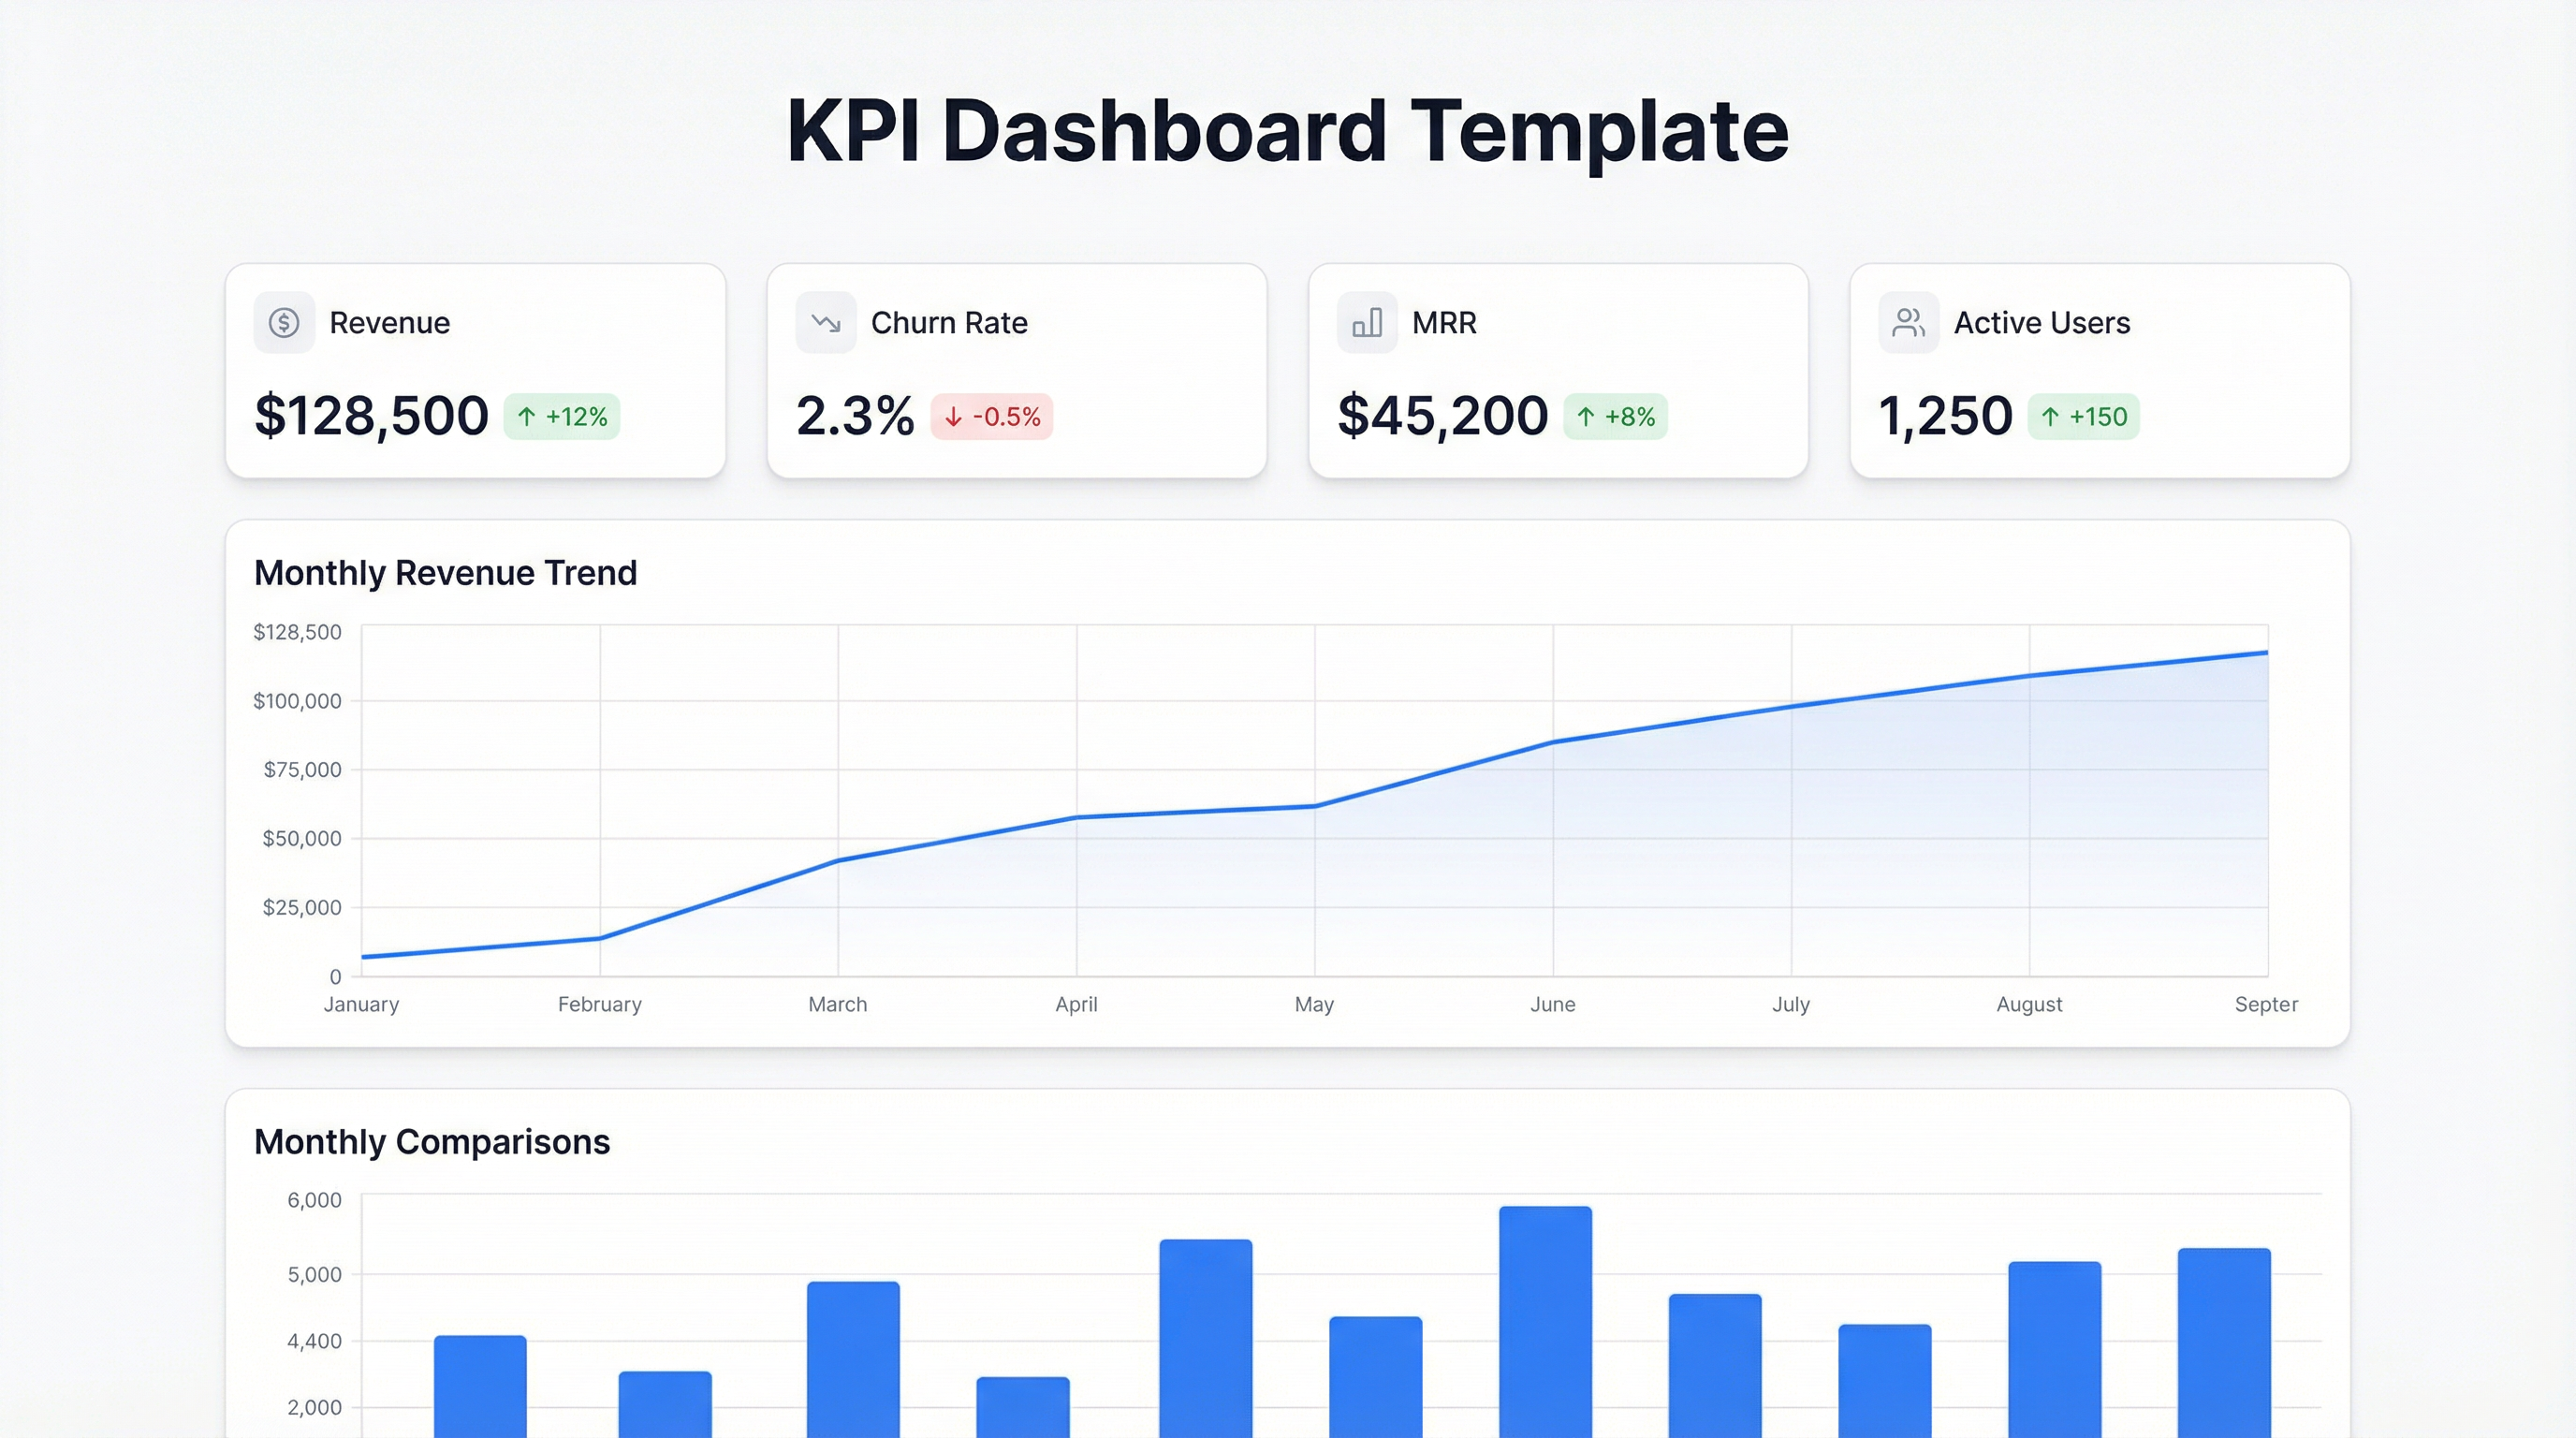
It surfaces changes, not just numbers. A KPI of $84,200 MRR means nothing without context. $84,200 MRR, down 3.1% week-over-week, with churn spiking in the enterprise segment — that’s something you can act on.
Templates that hit all three? Rare. But they exist, and we’ll get to them.
The best free KPI dashboard templates (and where they break)
Google Sheets: Databox’s KPI Dashboard Template
Databox offers a clean, well-structured Google Sheets template covering marketing, sales, and product KPIs. The layout is smart — traffic at the top, funnel metrics below, revenue at the bottom. For a bootstrapped team that’s not ready to invest in a dedicated BI tool, it works.
Where it breaks: the data entry is manual. You’re copying numbers from your analytics platform into cells. Every. Single. Week. This is fine once. After month two, it stops happening.
Excel: HubSpot’s Marketing KPI Template
HubSpot’s Excel template is probably the most downloaded KPI template on the internet. It covers leads, MQLs, SQLs, customer acquisition cost, and monthly revenue — the full B2B funnel. The charts are pre-built, the formulas are locked, and the layout is clean.
Where it breaks: Excel is a local file. The moment two people need to edit it, you’ve got version conflicts. The moment your data volume grows, the formulas slow to a crawl. And if you want to add a metric it doesn’t have — good luck untangling the cell references without breaking the whole thing.
Google Data Studio / Looker Studio: Google’s own templates
Looker Studio (formerly Data Studio) has actual connectors — Google Analytics, Google Ads, Search Console, Sheets. If your whole stack lives in Google’s ecosystem, these templates are genuinely useful.
Where it breaks: the UI is clunky, customization requires learning a non-obvious dimension/metric system, and the moment you need a data source that isn’t native to Google, you’re paying for a third-party connector.
For SaaS teams: ChartMogul + Baremetrics
Both platforms ship pre-built dashboards for subscription businesses: MRR, ARR, churn rate, LTV, new vs. expansion vs. contraction revenue. If you’re billing through Stripe, connecting takes about five minutes and you immediately get a real-time dashboard.
This isn’t a free template, but the free tiers are usable. And unlike spreadsheets, the data is live.
The KPIs worth tracking (and how to think about them)
Templates give you the structure. Here’s the substance — the metrics that actually matter and why.
Monthly Recurring Revenue (MRR) — The headline number for any subscription business. Track it as a total, but also decompose it: new MRR (new customers), expansion MRR (upgrades), contraction MRR (downgrades), and churned MRR (cancellations). The total can stay flat while your business is quietly deteriorating underneath.
Churn Rate — The percentage of customers (or revenue) you lose in a given period. Logo churn and revenue churn tell different stories. If you’re losing small customers but retaining big ones, revenue churn is low even when logo churn looks bad. Know which one your business cares about.
Customer Acquisition Cost (CAC) — What it costs to acquire one new customer, across all your sales and marketing spend. Compare this to LTV. If CAC is creeping up but LTV is flat, your unit economics are degrading before it shows up in the revenue line.
Net Revenue Retention (NRR) — Expansion minus churn, as a percentage of starting revenue. NRR above 100% means your existing customers are growing faster than you’re losing them. It’s the single best indicator that you have product-market fit in a customer segment.
Conversion Rate (by stage) — Not one number. Visitor to trial, trial to paid, free to upgrade. Each stage tells you where the leak is. A good dashboard shows all three in sequence so you can see which stage changed when performance shifts.
Activation Rate — The percentage of new users who reach your “aha moment.” Defined differently at every company (sent first report, connected first data source, shared first dashboard). If you don’t track this, you’re blind to your onboarding effectiveness.
These six metrics, tracked weekly with week-over-week and month-over-month comparison, tell you almost everything you need to know about a SaaS business. Put them on a single page. Don’t add more until these are working.
The real problem with templates: they’re snapshots, not systems
Every template starts as a snapshot of someone else’s business at a moment in time. The more you customize it, the more it becomes yours — but also the more brittle it becomes. Add a new column, break a formula. Change your fiscal year, break the date calculations. Switch from monthly to weekly reporting, rebuild the whole thing.
The underlying issue is that templates are static by design. They’re built around a fixed schema, a fixed set of metrics, a fixed visual layout. Real businesses don’t stay fixed.
What you actually need is something that can reshape itself when your business changes. That’s a very different tool than a spreadsheet template.
How Infograph skips the template entirely
Infograph works differently. You connect your data source — a Google Sheet, an Excel file, a CSV — and then describe what you want in plain language.
“Show me MRR by plan for the last 6 months, with a line chart and month-over-month percentage change.”
“Build a dashboard with churn rate, CAC, and NRR at the top, then a breakdown of new vs. expansion MRR below.”
“Track weekly active users and activation rate, with a 4-week rolling average.”
The AI builds the dashboard from the prompt. You’re not fighting templates or reformatting columns. You’re telling it what you need, and it figures out how to display it from your actual data.
When your business changes — new pricing tier, new segment, new metric you care about — you prompt again. The dashboard rebuilds. No broken formulas. No version history. No “let me just quickly update the spreadsheet” that takes an hour.
You can share the dashboard publicly, lock it behind team access, or publish a live view that updates as your underlying data changes. The whole thing takes minutes, not hours.
If you’ve been stuck in the template loop — download, customize, break, rebuild — it’s worth seeing what a prompt-based approach looks like. Try it at app.infograph.ai. Your data’s already there. You just need to describe what you want to see.


