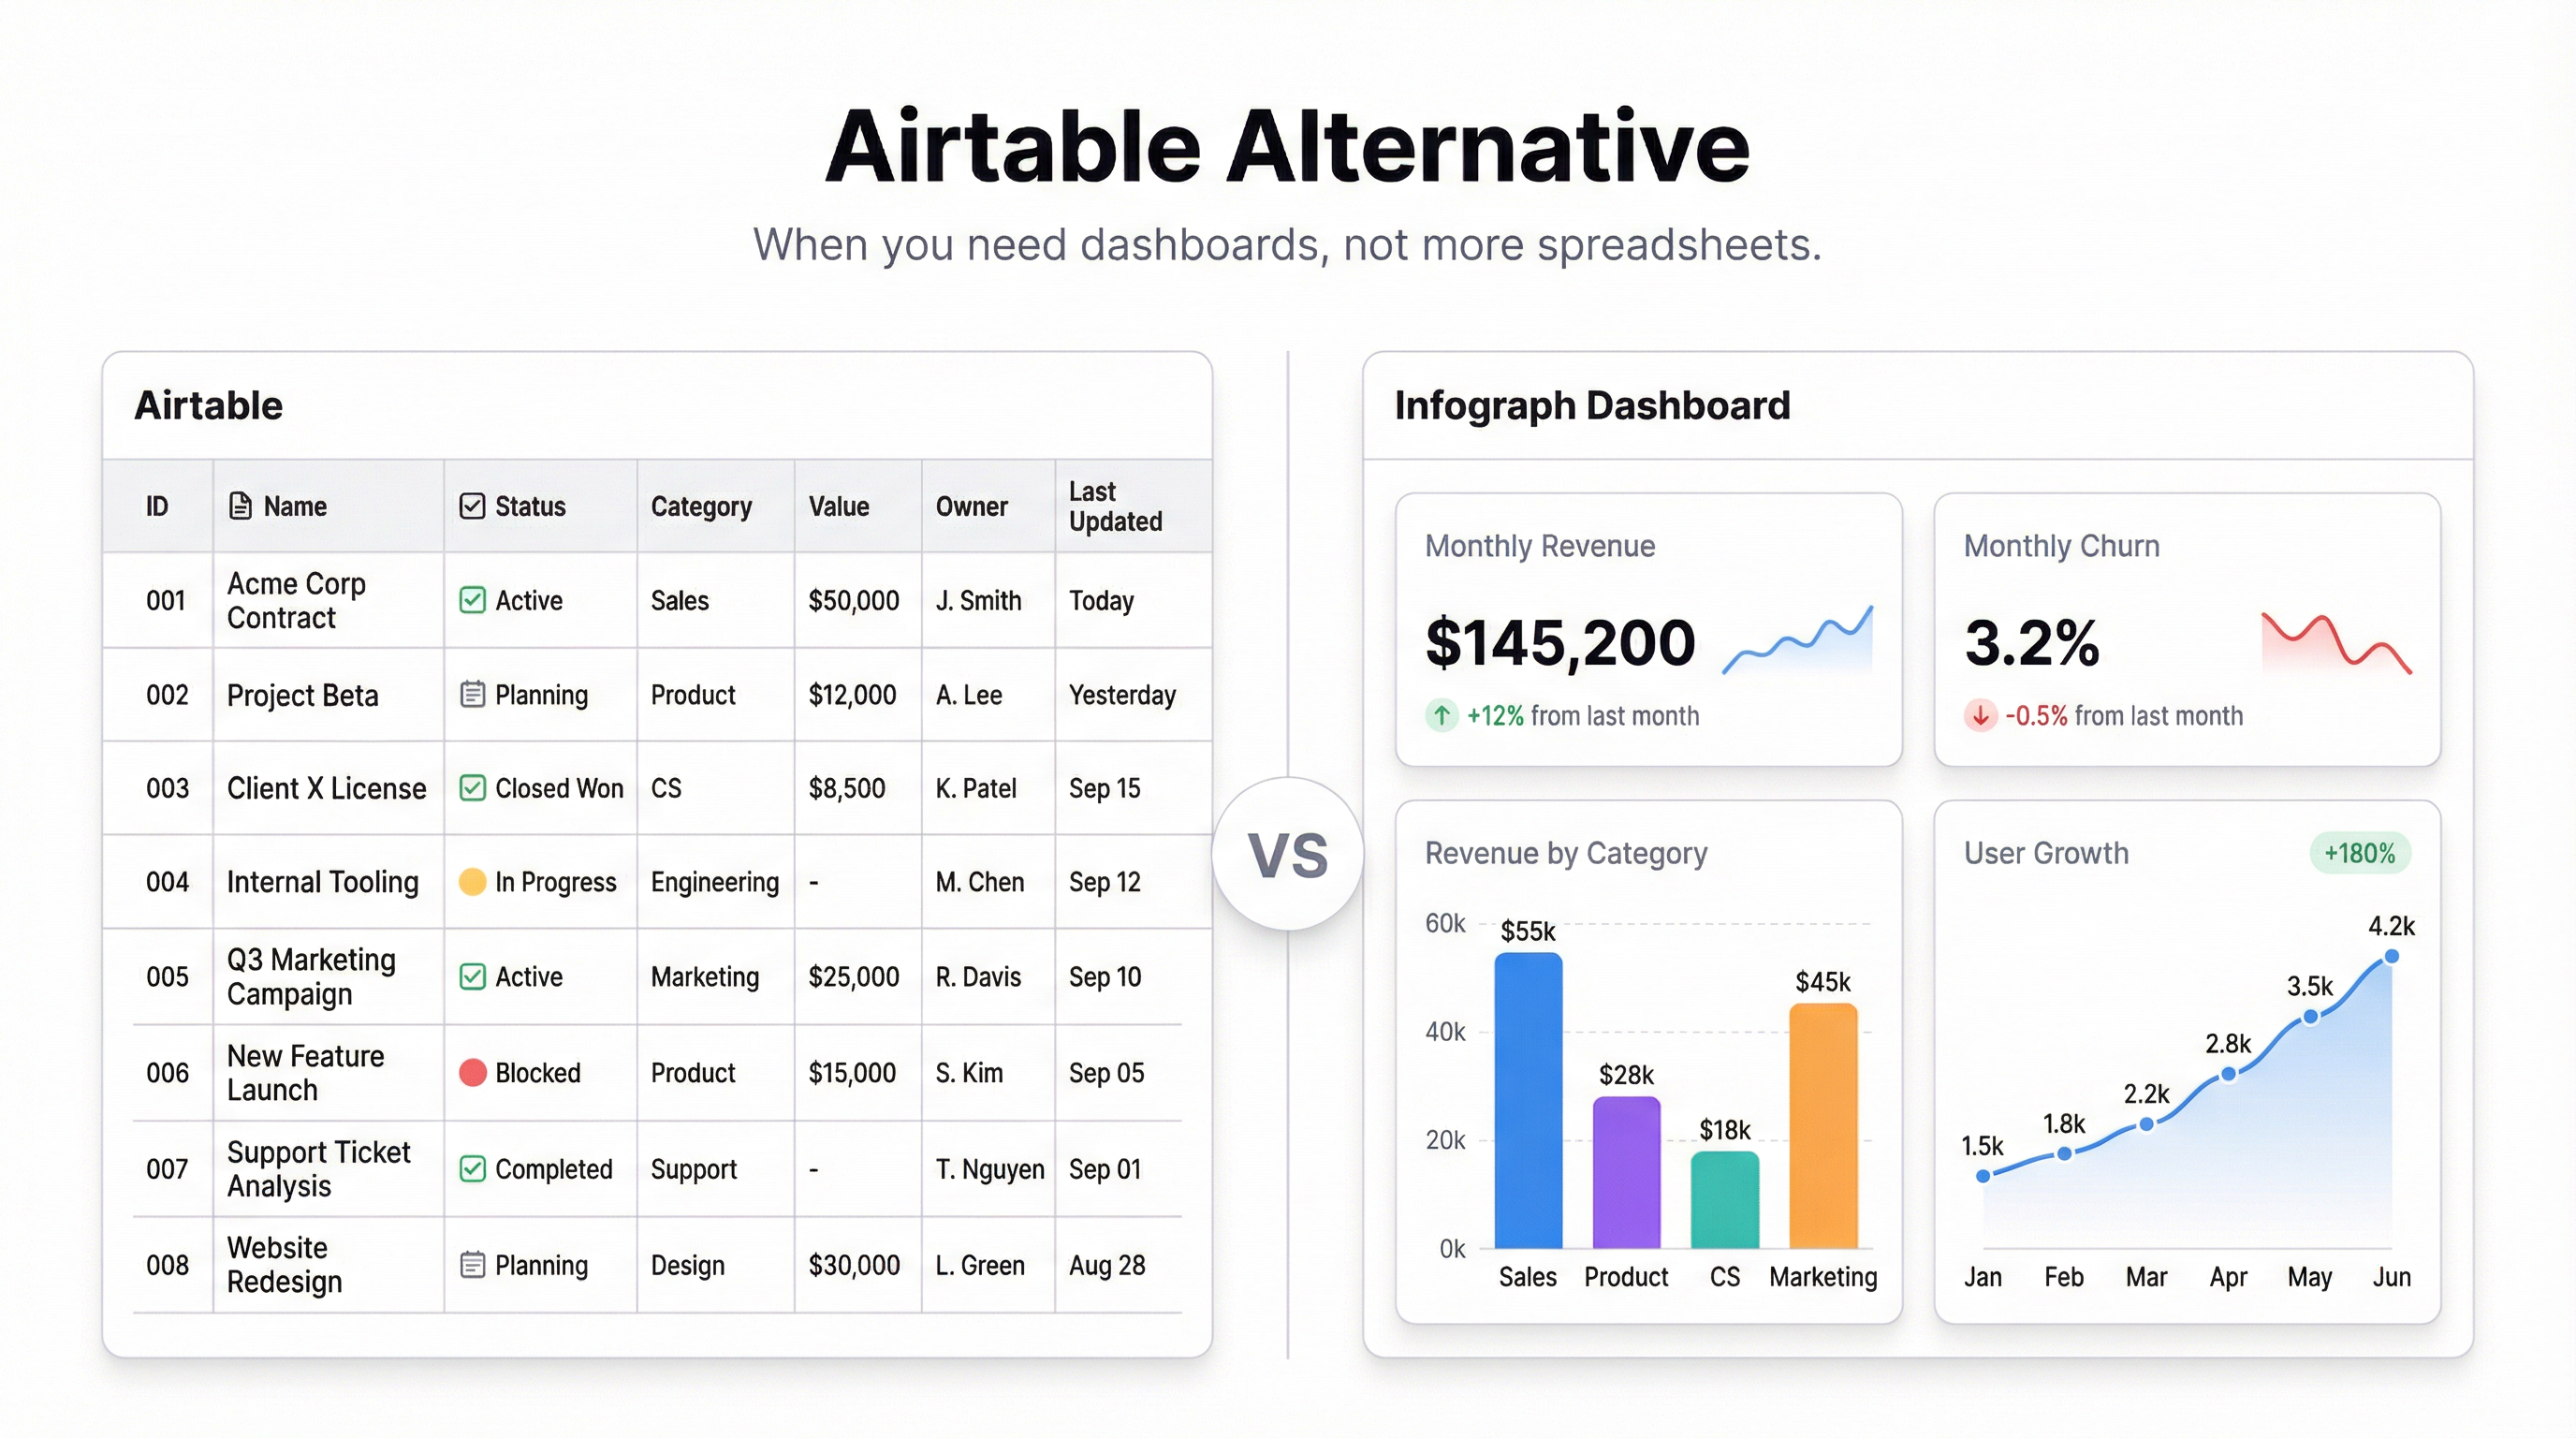
Airtable is genuinely good at what it does. It’s a flexible database with a spreadsheet face — great for managing projects, tracking inventory, building internal tools. If you’ve been using it to organize data, you’re not wrong to love it.
But “organize data” and “understand data” are different jobs.
When you need to answer questions like “what’s our revenue trend over the last quarter?” or “which product lines are underperforming?” or “how do I share a live report with a client who doesn’t have an Airtable login?” — that’s where Airtable starts to feel like the wrong tool.
Its built-in dashboards are limited, the chart types are basic, and sharing externally requires either a Pro plan or awkward workarounds. For a database tool, it’s understandable. But if dashboards are what you actually need, there are better options.
The Most Common Reasons People Look for an Airtable Alternative
You need real dashboards, not just charts. Airtable’s interface blocks are useful for internal views, but they’re not designed for client-facing or executive reporting. Layout control is limited, and the output looks like an internal tool because it is one.
Sharing is friction. External viewers need an Airtable account unless you share a read-only link to a specific view. That’s fine for simple tables, but it’s not the same as a clean, shareable dashboard link.
The data is already in spreadsheets. A lot of teams use Airtable for structured data but still do their reporting from Google Sheets or Excel exports. If your data isn’t exclusively in Airtable, you’re bridging two systems.
Cost. Airtable’s pricing scales with users and features quickly. If your main use case is reporting, you’re paying for a lot of database infrastructure you don’t need.
The Best Airtable Alternatives
Infograph — for fast dashboards from spreadsheet data
Infograph is the right replacement if your goal is dashboards specifically. You upload a CSV, connect a Google Sheet or Excel file, and describe what you want in plain English. The AI builds the dashboard. No data modeling, no drag-and-drop chart assembly.
The output is a real, shareable dashboard — public, password-protected, or team-only. If your source data updates, the dashboard updates too.
It’s not a database. It won’t replace Airtable for project tracking or content calendars. But if the reason you’re looking for an Airtable alternative is dashboards, this is the direct answer.
Best for: Teams who have data in spreadsheets and need to turn it into shareable dashboards fast.
Notion — for documentation and lightweight project management
Notion does a lot of what Airtable does, with a better writing and documentation layer on top. The databases are flexible, the sharing model is cleaner, and most teams find the onboarding easier.
The dashboards are still weak — Notion is fundamentally a docs tool with database features, not a BI tool. But if the reason you’re leaving Airtable is friction and cost rather than dashboards specifically, Notion is a natural fit.
Best for: Teams that use Airtable primarily for project management and want simpler sharing.
Monday.com — for work management and team tracking
Monday.com competes directly with Airtable on work management but adds better workflow automation and more polished reporting views. The dashboard layer is more developed than Airtable’s, especially for tracking project status and team workload.
It’s more opinionated about structure than Airtable, which some teams find easier and others find restrictive. Pricing is similar or higher.
Best for: Teams managing projects, sprints, or client work who want better built-in reporting.
Google Sheets + Infograph — for data-heavy teams
This one isn’t a single tool, but it’s worth naming: if you use Airtable mainly as a data store and then export to Google Sheets for analysis, just skip the Airtable step. Keep the data in Google Sheets and connect it directly to a dashboard tool.
Infograph connects to Google Sheets natively. Your sheet updates, the dashboard updates. You get the live data connection without managing a separate database.
Best for: Teams who already have data in Google Sheets and want dashboards without adding a new system.
Coda — for teams that build internal tools
Coda sits closer to Airtable than Notion on the power-user spectrum. It has more formula capability, better automation, and a stronger “build an internal app” story. If you’re using Airtable as the back-end for an internal tool, Coda is the natural upgrade.
Dashboards are still basic compared to dedicated BI tools.
Best for: Technical teams that want a programmable database and don’t need polished external dashboards.
Which One Is Actually Right for You?
The honest answer depends on why you’re leaving Airtable.
- If dashboards are the gap: Infograph
- If you want simpler sharing and docs: Notion
- If you manage projects or client work: Monday.com
- If you want a more powerful database tool: Coda
- If your data is already in Google Sheets: Infograph directly, skip the database layer
Airtable’s sweet spot is structured data management for teams who want something between a spreadsheet and a proper database. If that’s not your problem, it’s probably not your tool.
The pattern we see most: teams use Airtable as a database and then export their data to build the actual reports somewhere else. That’s two tools doing the job of one. If the end goal is a clean, live dashboard your team or clients can look at — start there instead.
Try Infograph free — connect your data source and build a dashboard in minutes →