The problem isn’t finding a data visualization tool. There are hundreds of them. The problem is that most of them assume you have a data team, a data warehouse, or at minimum someone who can write SQL without Googling every other line.
Small businesses have data. Sales records, customer lists, marketing spend, inventory levels. What they don’t have is someone to translate that data into something they can actually make decisions from.
Here’s what works.
The Wrong Tools (and Why People Buy Them Anyway)
Tableau gets recommended constantly. It’s genuinely powerful — but at $75/user/month, it’s priced for enterprise. And even if you could justify the cost, getting a useful dashboard out of Tableau takes time and skill that most small business owners don’t have on hand.
Power BI is cheaper and better integrated with Excel, but the learning curve is real. Building a proper report in Power BI means understanding relationships, measures, and DAX formulas. It’s not impossible — it just takes more time than most people expect.
Both tools were designed for organisations with dedicated BI teams. If you’re a founder checking revenue before a board call, or a marketing manager trying to understand what’s actually working, they’re the wrong starting point.
What Small Businesses Actually Need
Fewer features. Faster setup. Data that stays connected.
The dashboards that get used in small businesses are the ones that don’t require maintenance. The ones built in Excel get rebuilt from scratch every month because the data format changed. The ones in Tableau get abandoned when the person who built them leaves.
What works: tools that connect directly to where your data already lives, update automatically when that data changes, and don’t require a PhD to read.
Google Looker Studio (Free)
If your data is already in Google — Analytics, Ads, Sheets, or Search Console — Looker Studio is worth 30 minutes of your time. It’s free, the Google connector integrations are tight, and for marketing analytics specifically, it covers most of what a small business actually needs.
The limitations show up quickly outside the Google ecosystem. Non-Google data sources rely on third-party connectors that are often flaky or expensive. The chart options are limited. And building anything beyond a basic report requires more configuration than the “free and simple” positioning suggests.
Good for: marketing dashboards, Google Analytics reporting, ad spend tracking. Not for: sales data, custom databases, anything not already in Google.
Metabase (Free Self-Hosted / $85+/month Cloud)
If you have a developer or a technically confident team member, Metabase is excellent. It connects directly to your database, lets non-technical users ask questions through a visual query builder, and generates clean dashboards from the results.
The self-hosted version is free. The cloud version costs $85/month for 5 users, which is reasonable for a small team.
The honest catch: someone needs to set it up. If no one on your team is comfortable standing up a Docker container or connecting a database, Metabase will sit unused.
Good for: tech-comfortable small businesses with a database. Not for: teams with zero technical capacity.
Grafana (Free Self-Hosted)
Grafana is excellent for time-series data — server metrics, IoT sensors, application monitoring. It’s not designed for business analytics.
Most small businesses looking for a sales or operations dashboard will find Grafana’s interface disorienting. The concepts (panels, data sources, PromQL queries) are built for infrastructure engineers, not business operators.
Skip it unless your use case is explicitly technical monitoring.
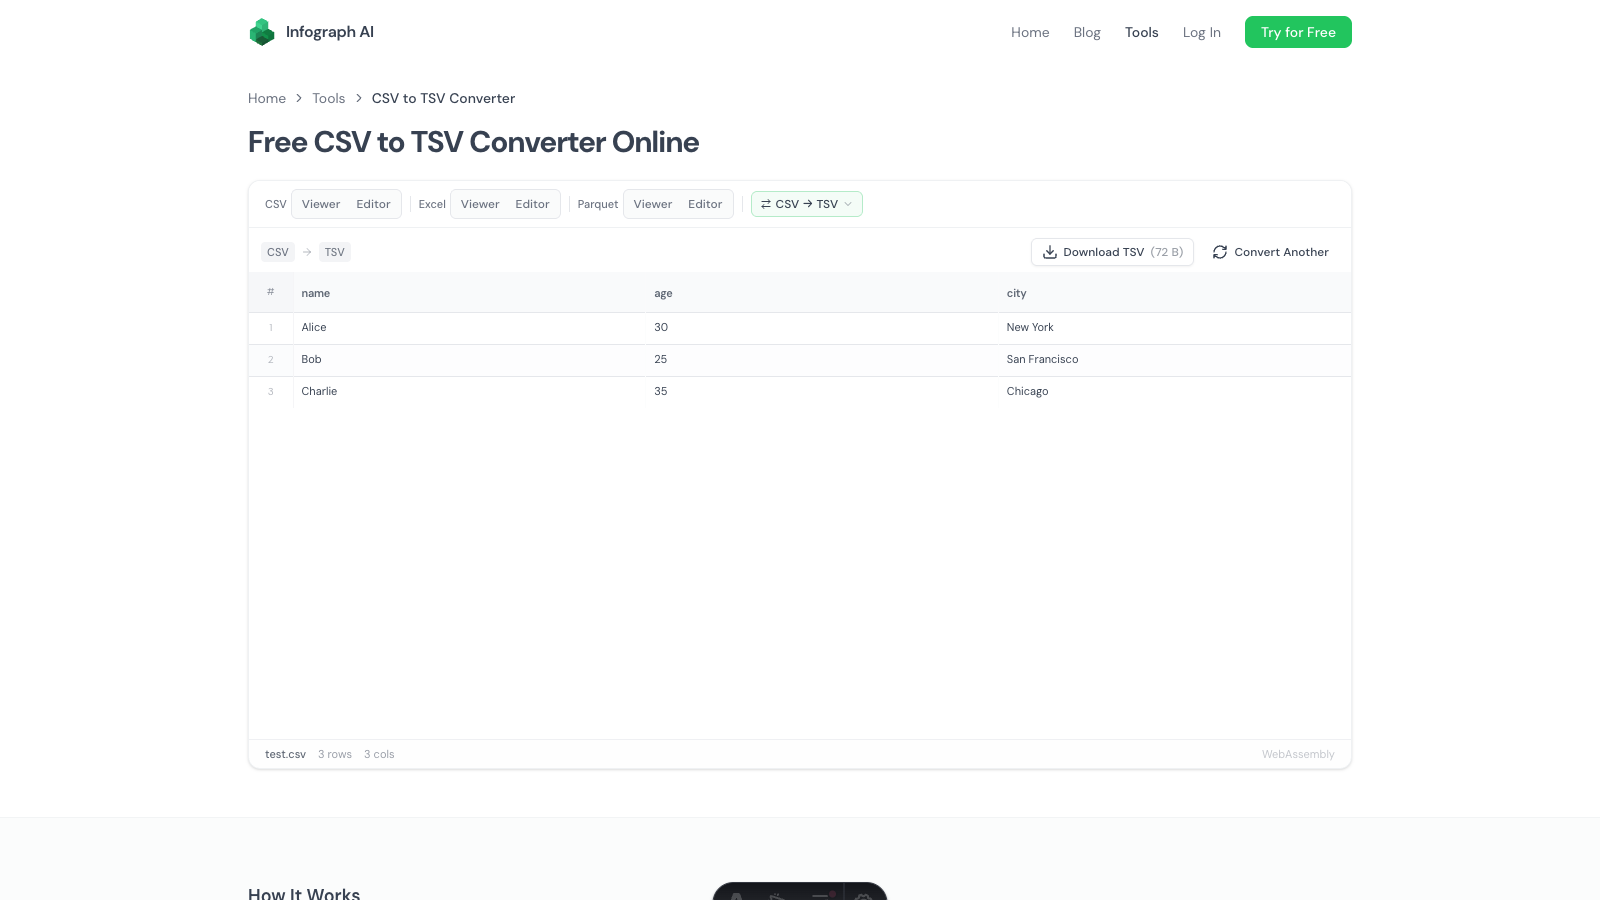
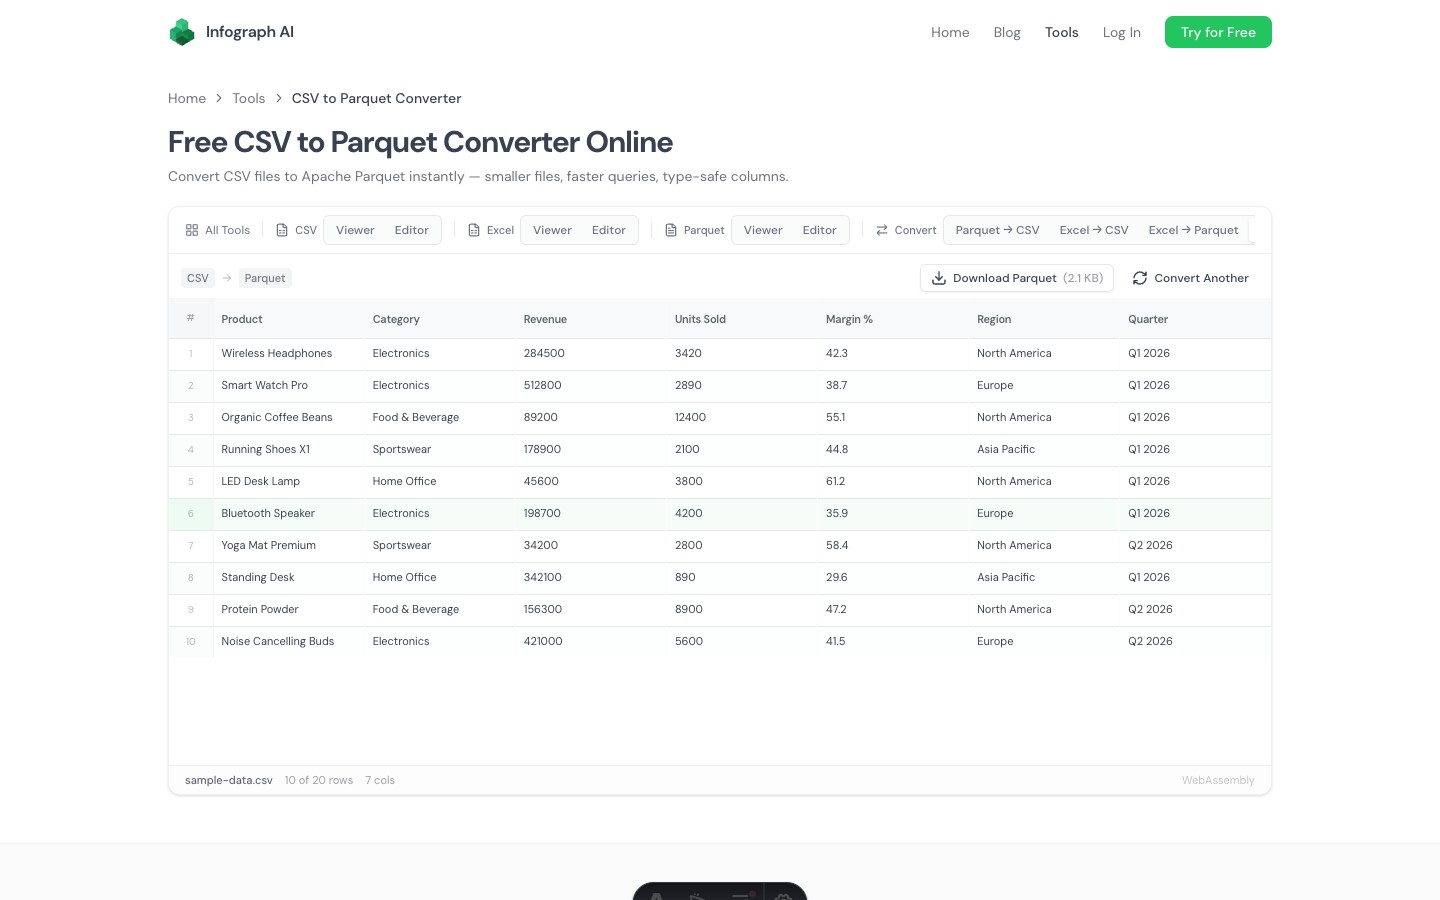
Infograph (Free Tier / $19.99/month Pro)
Infograph is built specifically for the gap that most tools ignore: teams with real data but no data team.
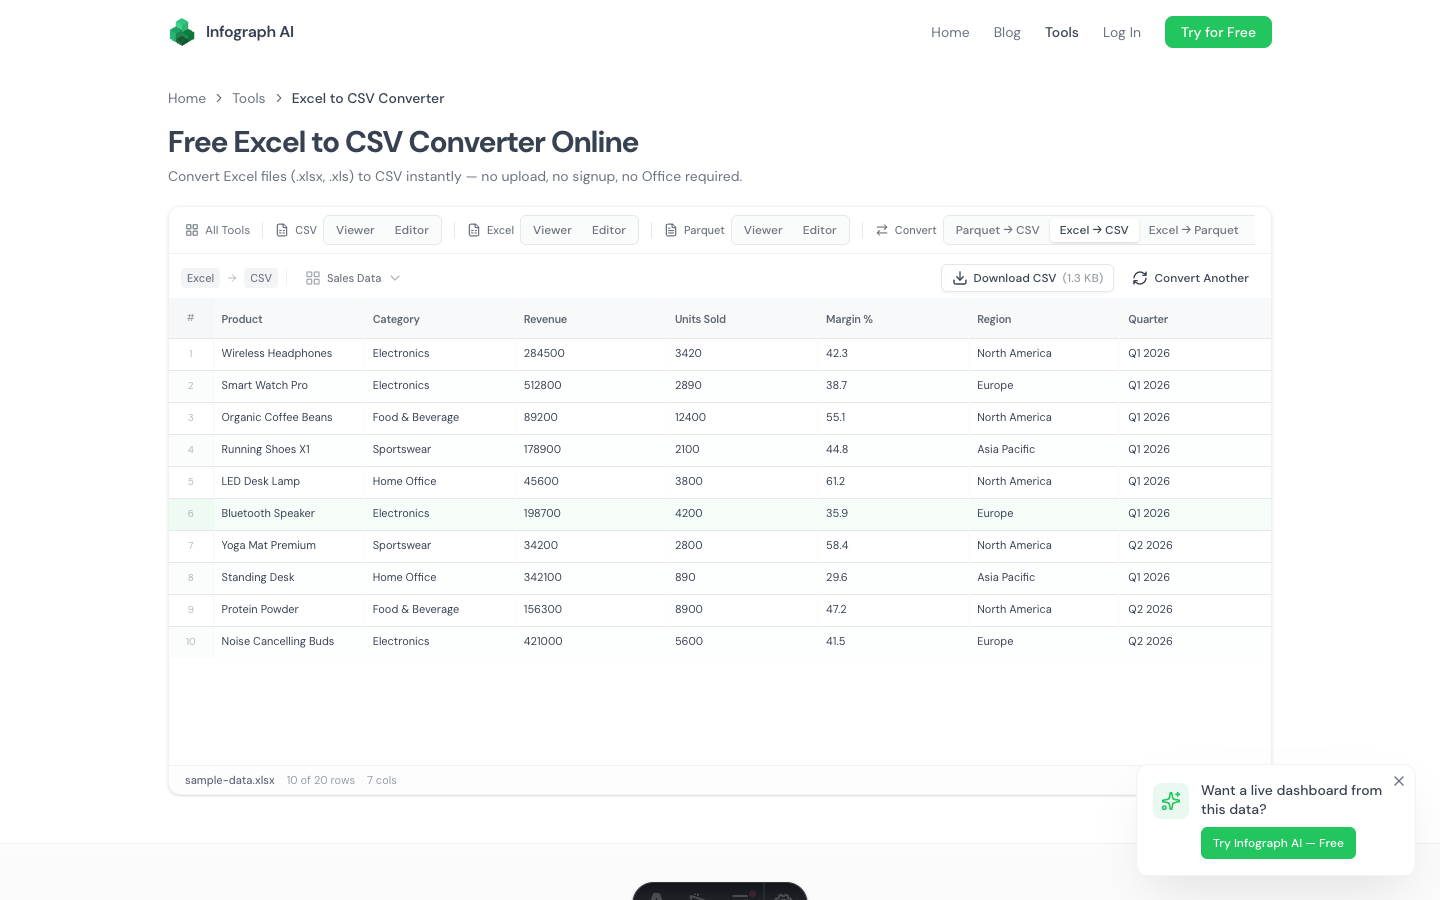
The workflow is direct. Upload your CSV, connect your Google Sheets or Excel Online spreadsheet, or both. Then describe what you want to see — in plain English. The AI builds the dashboard.
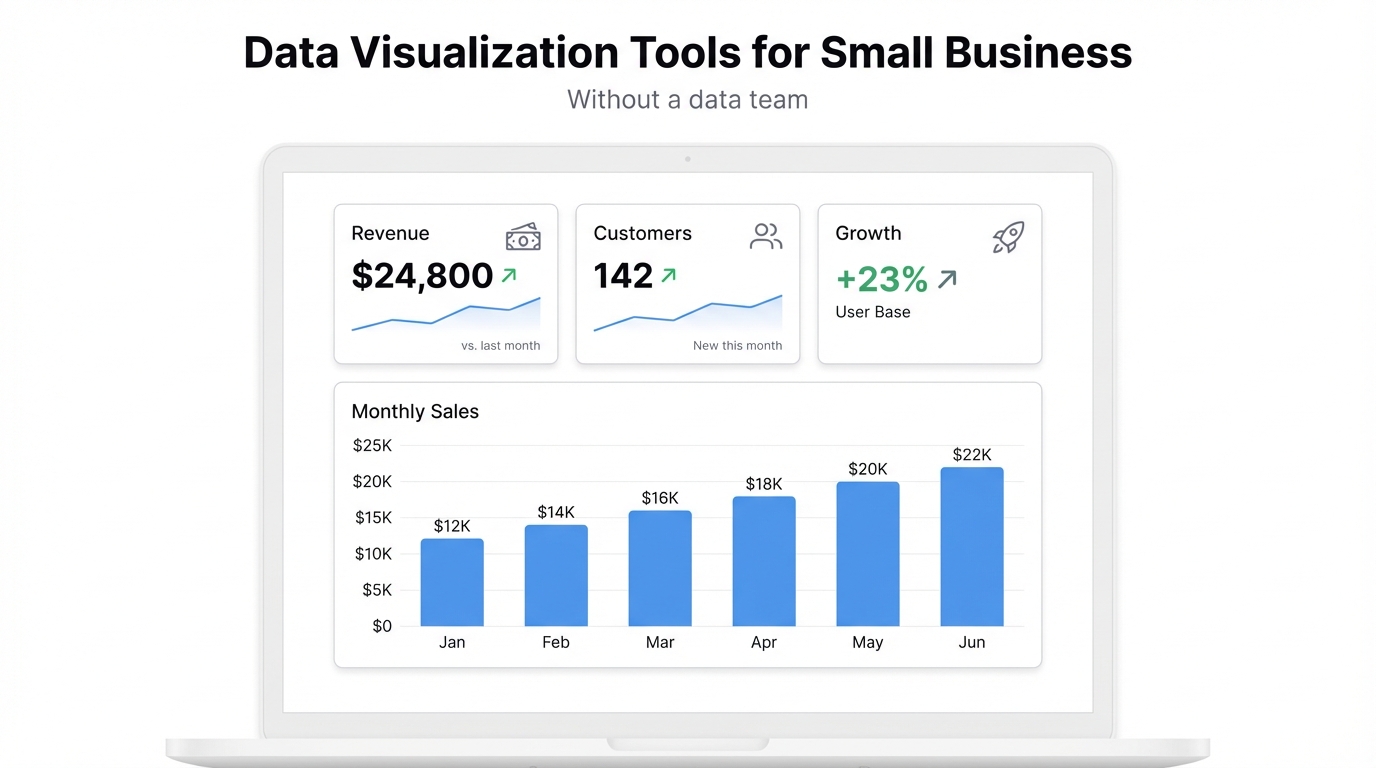
“Show me monthly sales by product category” becomes a bar chart. “Which customer segments had the highest growth this quarter?” runs the query and shows the answer. You don’t write formulas, configure data models, or learn a new interface. You describe what you want and you get it.
The live data connections matter more than they sound. A Google Sheets dashboard in Infograph updates automatically when your spreadsheet updates — no export, no refresh, no rebuild. For a small business tracking weekly numbers in a shared spreadsheet, that’s the difference between a dashboard that gets used and one that gets ignored.
The free tier includes one dashboard, which is enough to decide whether it works for your data. Pro is $19.99/month.
Good for: any small business team without a dedicated analyst. Limitation: designed for spreadsheet-style data, not complex relational databases.
The Honest Recommendation
For most small businesses: start with Infograph if you want something fast and don’t have technical resources. Start with Looker Studio if your data is primarily in Google tools and you want free. Start with Metabase if you have a technical team member and want flexibility.
Don’t start with Tableau or Power BI. They’re not built for you — and you’ll spend weeks figuring that out.
The goal is a dashboard your team actually opens. The best tool is the one that makes that happen. Try Infograph free — one dashboard, no credit card.