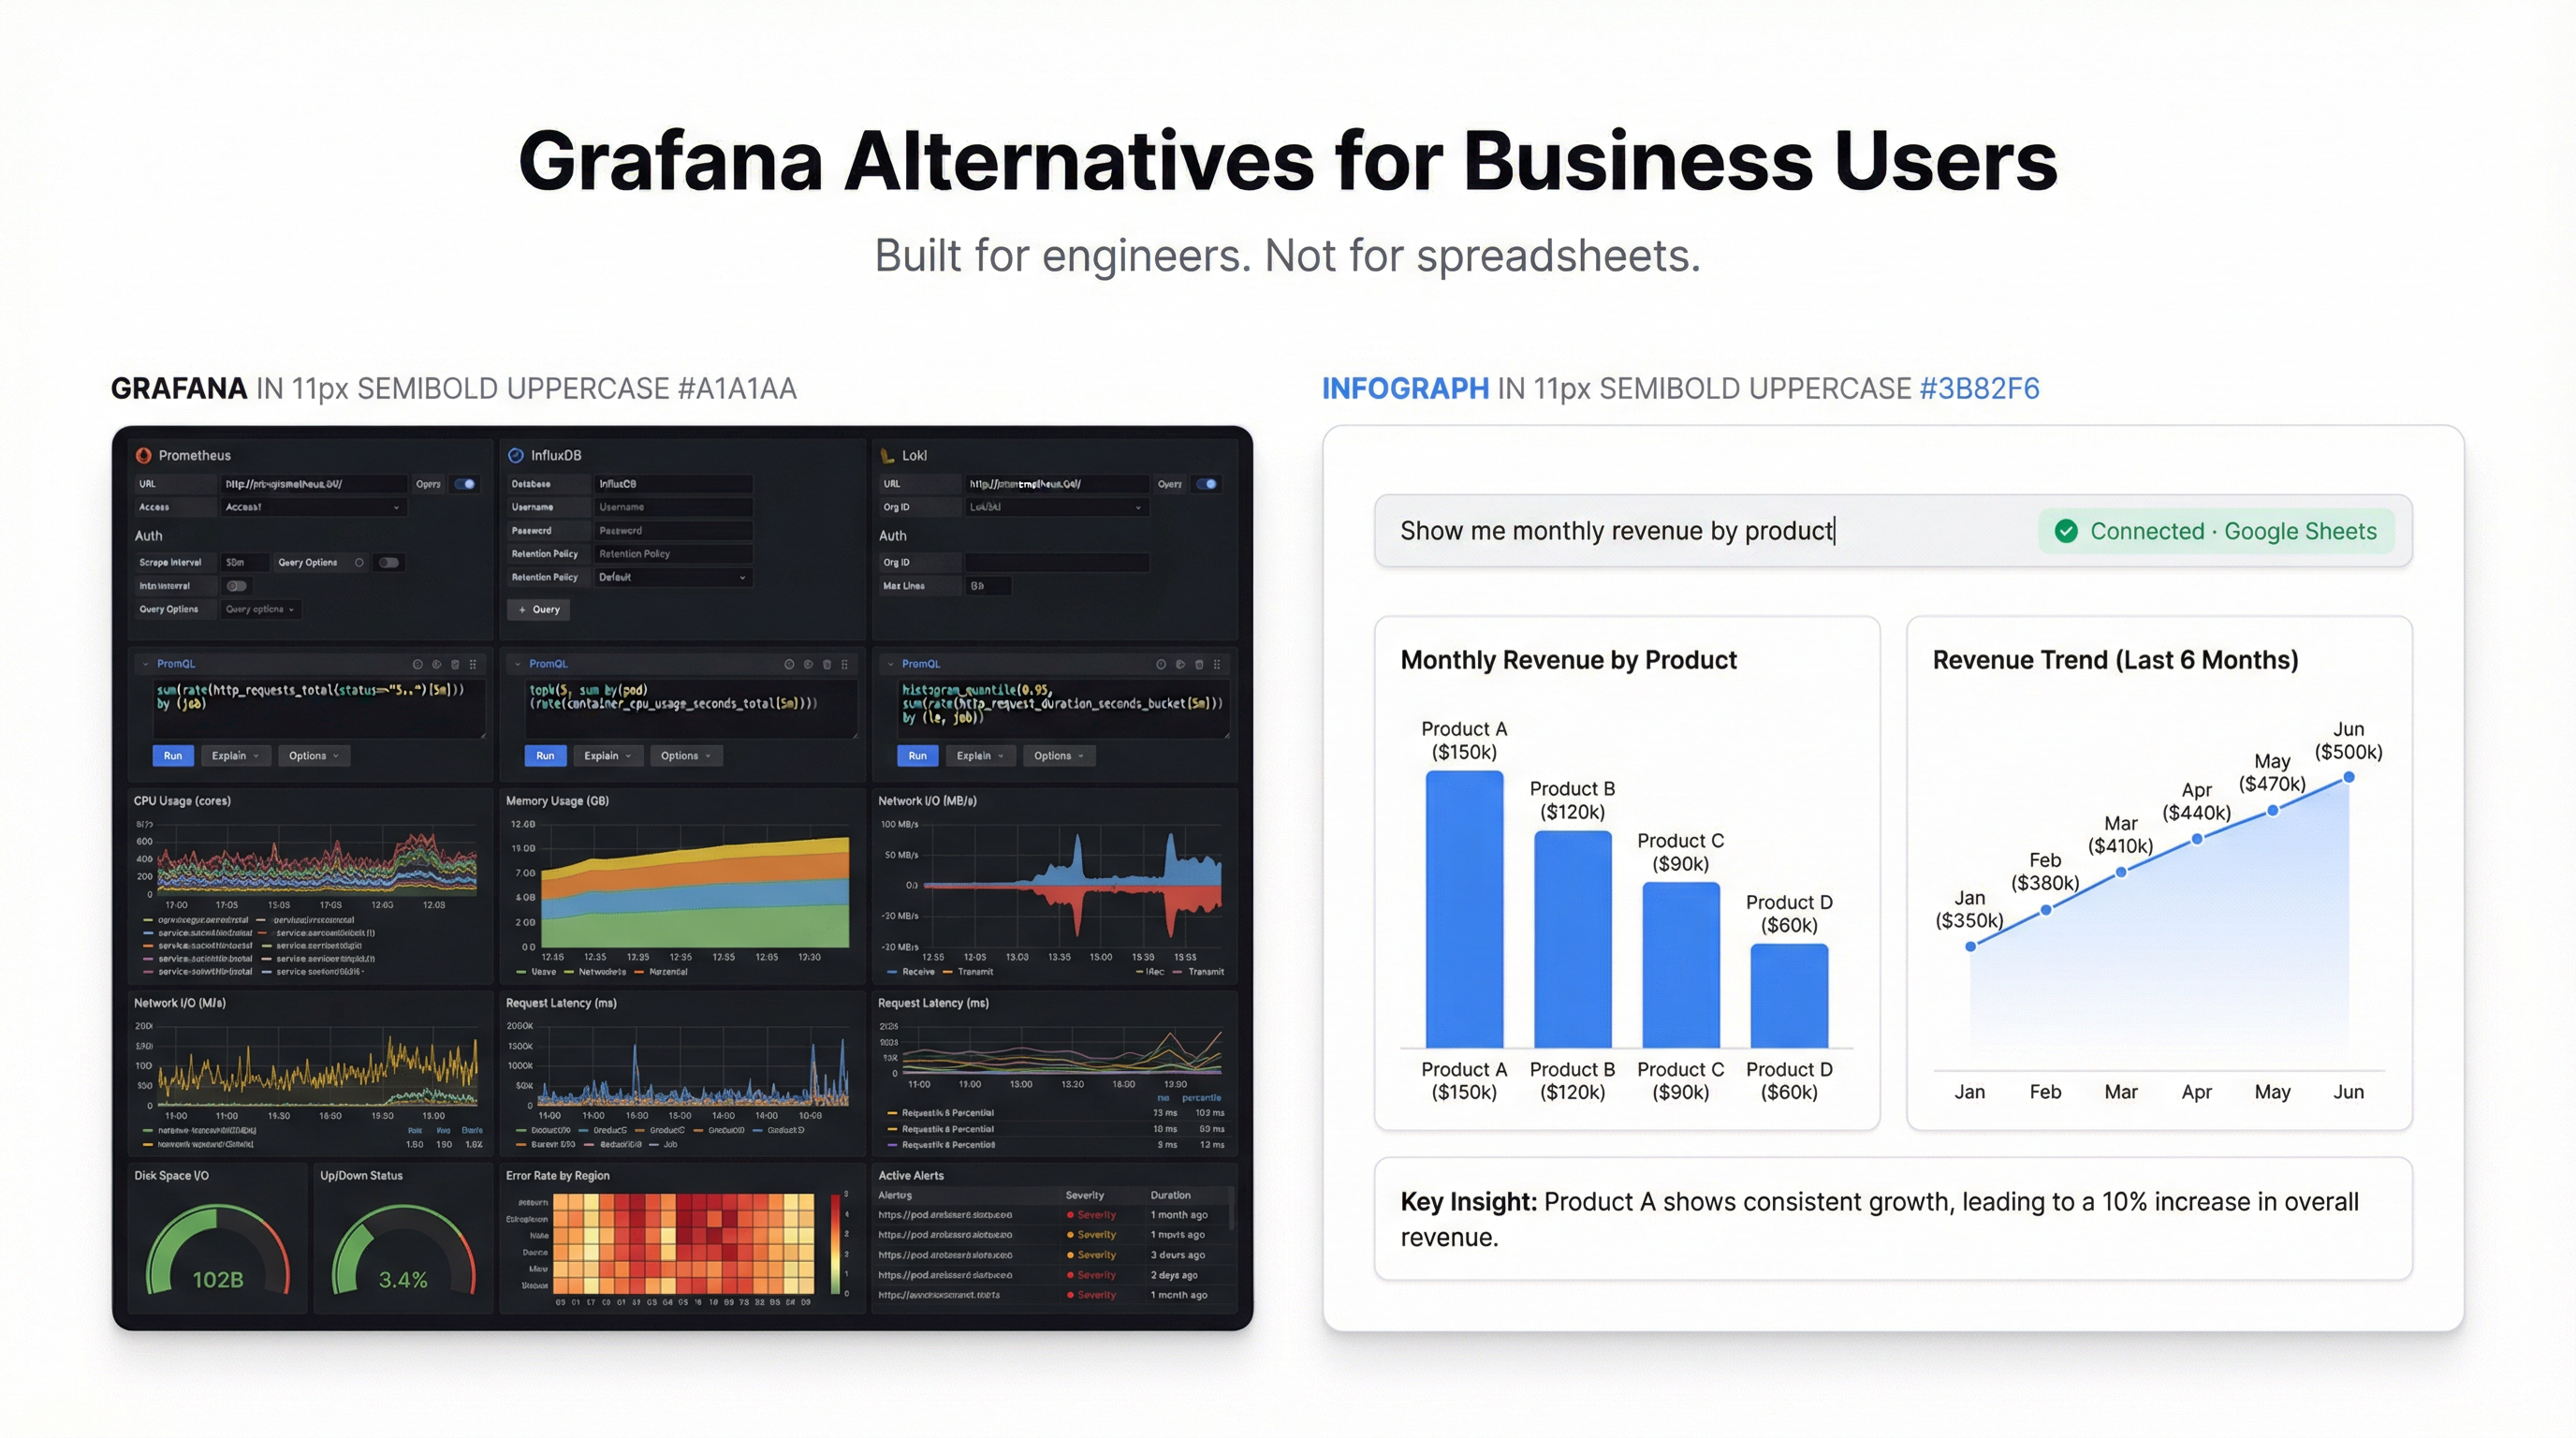
Grafana is a genuinely impressive piece of software. If you’re a DevOps engineer monitoring Kubernetes cluster health or a platform team tracking infrastructure metrics from Prometheus and Loki, it’s probably the right tool. The query language is powerful, the alerting is mature, the plugin ecosystem is enormous.
But if you’re a sales manager trying to visualize your pipeline from a spreadsheet, or a marketing analyst who wants a dashboard from a CSV export — Grafana will make you feel like you’ve walked into the wrong building.
The search volume for “grafana alternative” tells the story. A lot of people found Grafana, realized it wasn’t built for their use case, and started looking for a way out.
What Grafana Is Actually Built For
Grafana’s core use case is time-series infrastructure monitoring. It was designed to connect to data sources like Prometheus, InfluxDB, Graphite, and Elasticsearch — systems that produce metrics about servers, containers, and applications. The dashboards it generates are excellent for that purpose: line charts of CPU usage over time, alert thresholds, anomaly detection.
The catch is that to use Grafana properly, you need to:
- Run a Grafana server (or pay for Grafana Cloud)
- Configure data source connections
- Write queries in PromQL, LogQL, or whatever query language your data source uses
- Understand panel types, transformations, and variable templating
That’s a reasonable ask for an engineer. For a business user with a Google Sheet, it’s an enormous amount of complexity before you can see a single bar chart.
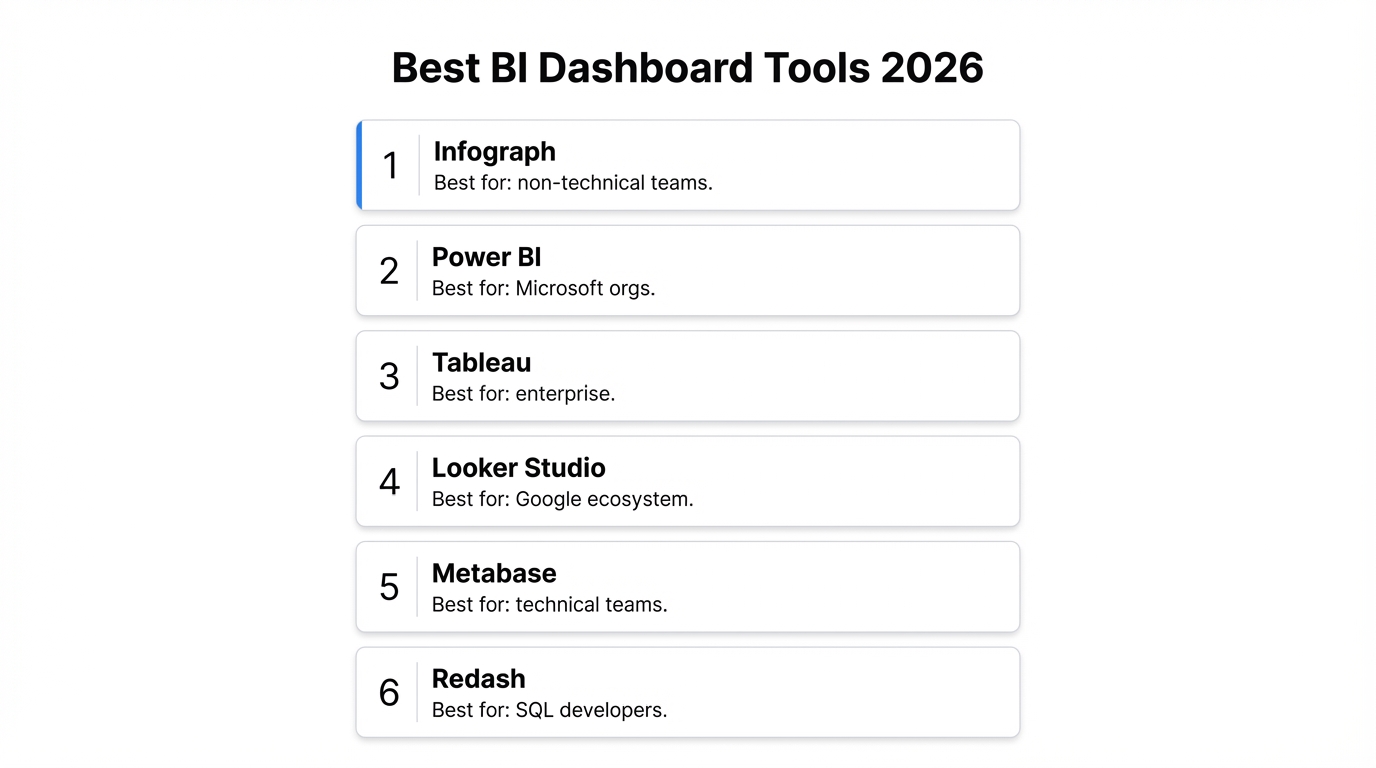
The Alternatives
1. Infograph — Built for Business Users, Not Server Racks
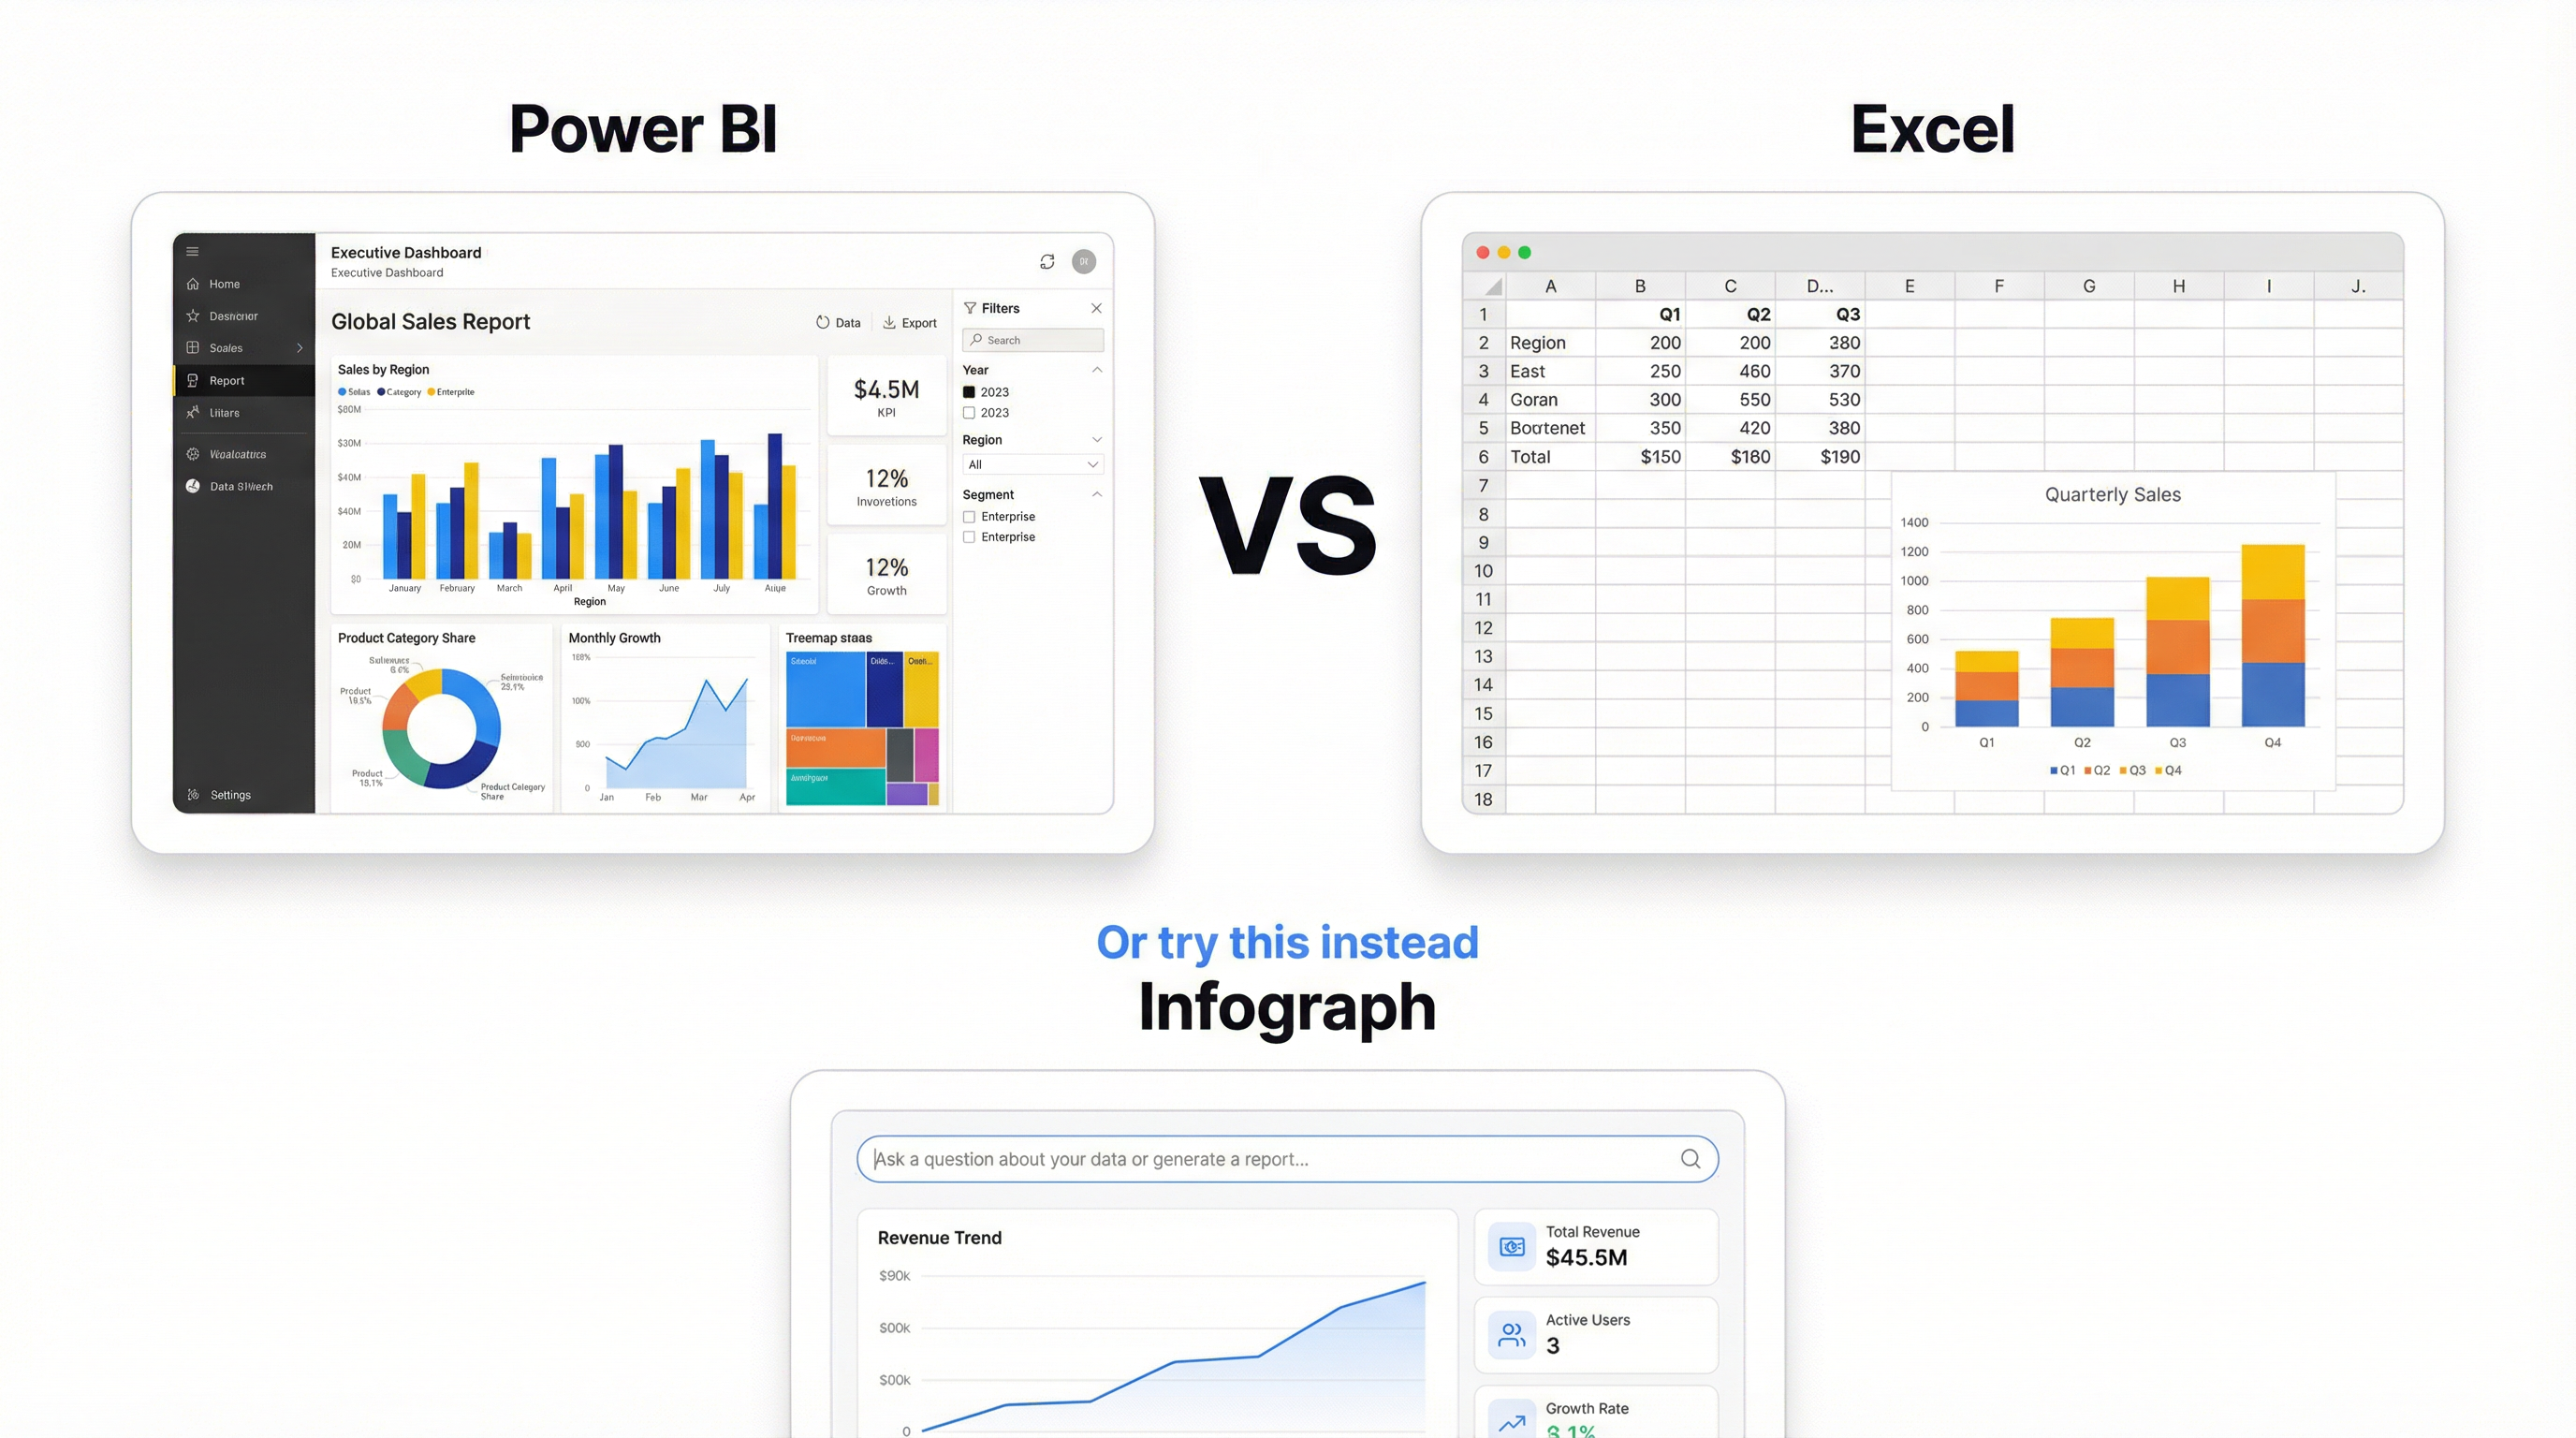
Infograph starts from the opposite assumption: your data is in a spreadsheet or CSV, you don’t want to write queries, and you want a dashboard in under a minute.
Upload your file (CSV, Excel, Google Sheets, JSON), describe what you want to see — “show me monthly revenue by product category with a trend line” — and the AI builds it. No data source configuration. No query language. No server to manage.
Where Infograph stands out specifically compared to Grafana:
Data sources that make sense for business users. Google Sheets, Microsoft Excel Online, CSV, JSON. Not Prometheus. If your data lives in a spreadsheet, Infograph connects to it directly — and if you update the sheet, the dashboard updates automatically.
AI dashboard generation. This is the part that surprises people. You describe the dashboard you want in plain English and watch it build itself. It picks chart types, handles aggregations, and labels everything correctly. You can then adjust, rearrange, and restyle.
Sharing that doesn’t require a login to your infrastructure. Publish a dashboard as a live share link, password-protect it, restrict it to your team, or freeze it as a snapshot. The person you’re sharing with doesn’t need a Grafana account or VPN access.
No server to maintain. Grafana Cloud’s free tier is generous, but self-hosted Grafana means you’re responsible for the instance. Infograph is fully managed — nothing to run.
Pricing: Free plan with 1 dashboard and no credit card required. Pro at $19.99/month for 5 dashboards and live data source connections.
The honest assessment: if your data is in a database and you’re comfortable writing queries, Grafana’s free tier is hard to beat on pure functionality. If your data is in a spreadsheet and you want a dashboard without an engineering degree, Infograph is faster and considerably less painful.
2. Metabase — SQL Dashboards with a Friendlier Interface
Metabase is a business intelligence tool that connects to SQL databases and lets non-technical users ask questions in plain English (or write SQL directly). It’s more accessible than Grafana for business users, has a reasonable dashboard editor, and the self-hosted version is free.
The limitation is the same category of problem as Grafana: you still need a database. Metabase doesn’t accept CSV uploads or connect to Google Sheets in any meaningful way. It’s built for teams that have a data warehouse or relational database and want business users to query it without writing SQL.
If that’s your situation — SQL database, non-technical business users, need for dashboards and reports — Metabase is worth serious consideration. If your data starts in a spreadsheet, it won’t help you much.
3. Looker Studio (formerly Google Data Studio) — Free but Frustrating
Google’s Looker Studio is free and connects natively to Google Sheets, which immediately makes it more accessible than Grafana for many users. You can build dashboards, share them publicly, and it handles basic charts well.
The frustrating part is the interface. Building a Looker Studio dashboard that looks professional takes a genuinely disproportionate amount of time — field configuration, dimension/metric relationships, and the chart editor are clunky in ways that feel like they haven’t been updated since 2017. There’s no AI assistance. There’s no “describe what you want” functionality. You’re clicking through modal after modal to configure a single bar chart.
It’s free, which is a real advantage. But “free and slow” is a different value proposition than “fast and actually works.”
4. Tableau — The Enterprise Standard
Tableau is the industry benchmark for business intelligence dashboards. The visualizations are beautiful, the analytical depth is real, and it’s been the tool of choice for data teams at large companies for over a decade.
The problems: licensing starts at $75/user/month, there’s a steep learning curve for anything beyond basic charts, and it’s designed for analysts who work with data full-time — not managers or operators who need a quick dashboard and don’t want to become Tableau experts.
If you have a dedicated analytics team and a budget, Tableau is excellent. If you’re a small team or a solo operator, the complexity-to-value ratio doesn’t work in your favor.
5. Power BI — Good If You Live in Microsoft’s World
Power BI is Microsoft’s BI platform and it integrates well with Excel, SharePoint, and the rest of the Microsoft stack. The desktop version is free, the web version is included in some Microsoft 365 plans, and it handles Excel data better than almost any other tool.
Like Tableau, Power BI has a learning curve. The DAX formula language for calculated fields is its own thing to learn. And while sharing and collaboration are improving, getting a dashboard in front of someone outside your organization still involves more friction than sharing a link from Infograph or Looker Studio.
Worth considering if your team is already deep in Microsoft 365 and your data lives in Excel or SharePoint. Otherwise, the setup cost is harder to justify.
6. Redash — Open Source, Developer-Friendly
Redash is an open-source tool for building dashboards from SQL databases. It’s more accessible than Grafana, has a cleaner interface, and the dashboard sharing is simpler.
The catch is that it’s a developer tool. You need to self-host it (or find a managed version), connect it to a database, and write queries. No spreadsheet support, no AI generation, no point-and-click. For developers who want a lightweight alternative to Grafana for database dashboards, it’s a solid option. For business users, it solves the wrong problem.
Comparison Table
| Infograph | Grafana | Metabase | Looker Studio | Tableau | Power BI | |
|---|---|---|---|---|---|---|
| Ease of use | ★★★★★ | ★★☆☆☆ | ★★★☆☆ | ★★★☆☆ | ★★★☆☆ | ★★★☆☆ |
| CSV / spreadsheet | ✅ Native | ❌ | ❌ | ✅ Google Sheets | ✅ | ✅ Excel |
| AI dashboard generation | ✅ | ❌ | ❌ | ❌ | ❌ | ❌ |
| SQL / databases | ❌ | ✅ | ✅ | ✅ | ✅ | ✅ |
| Infrastructure monitoring | ❌ | ✅ | ❌ | ❌ | ❌ | ❌ |
| Free tier | ✅ | ✅ | ✅ | ✅ | ❌ | Limited |
| Setup required | None | Server / Cloud | Self-host or Cloud | None | None | None |
| Sharing | Link / password / team | Limited | Embedded / teams | Public link | Paid | Paid |
The Real Question
The Grafana alternative search is often really two different searches compressed into one query.
The first: “I need something like Grafana but easier.” That’s usually a developer or DevOps person who wants less configuration overhead. Metabase or Redash often fit this case.
The second: “I found Grafana but it’s clearly not for me.” That’s a business user who saw Grafana recommended, tried to set it up, got as far as “add a data source” and closed the tab. For that person, the alternatives aren’t really alternatives to Grafana — they’re an entirely different category of tool.
If you have spreadsheet data and want a dashboard that doesn’t require an afternoon of configuration, try Infograph. Upload your file, describe your dashboard, and see what comes back. The free plan doesn’t require a credit card.