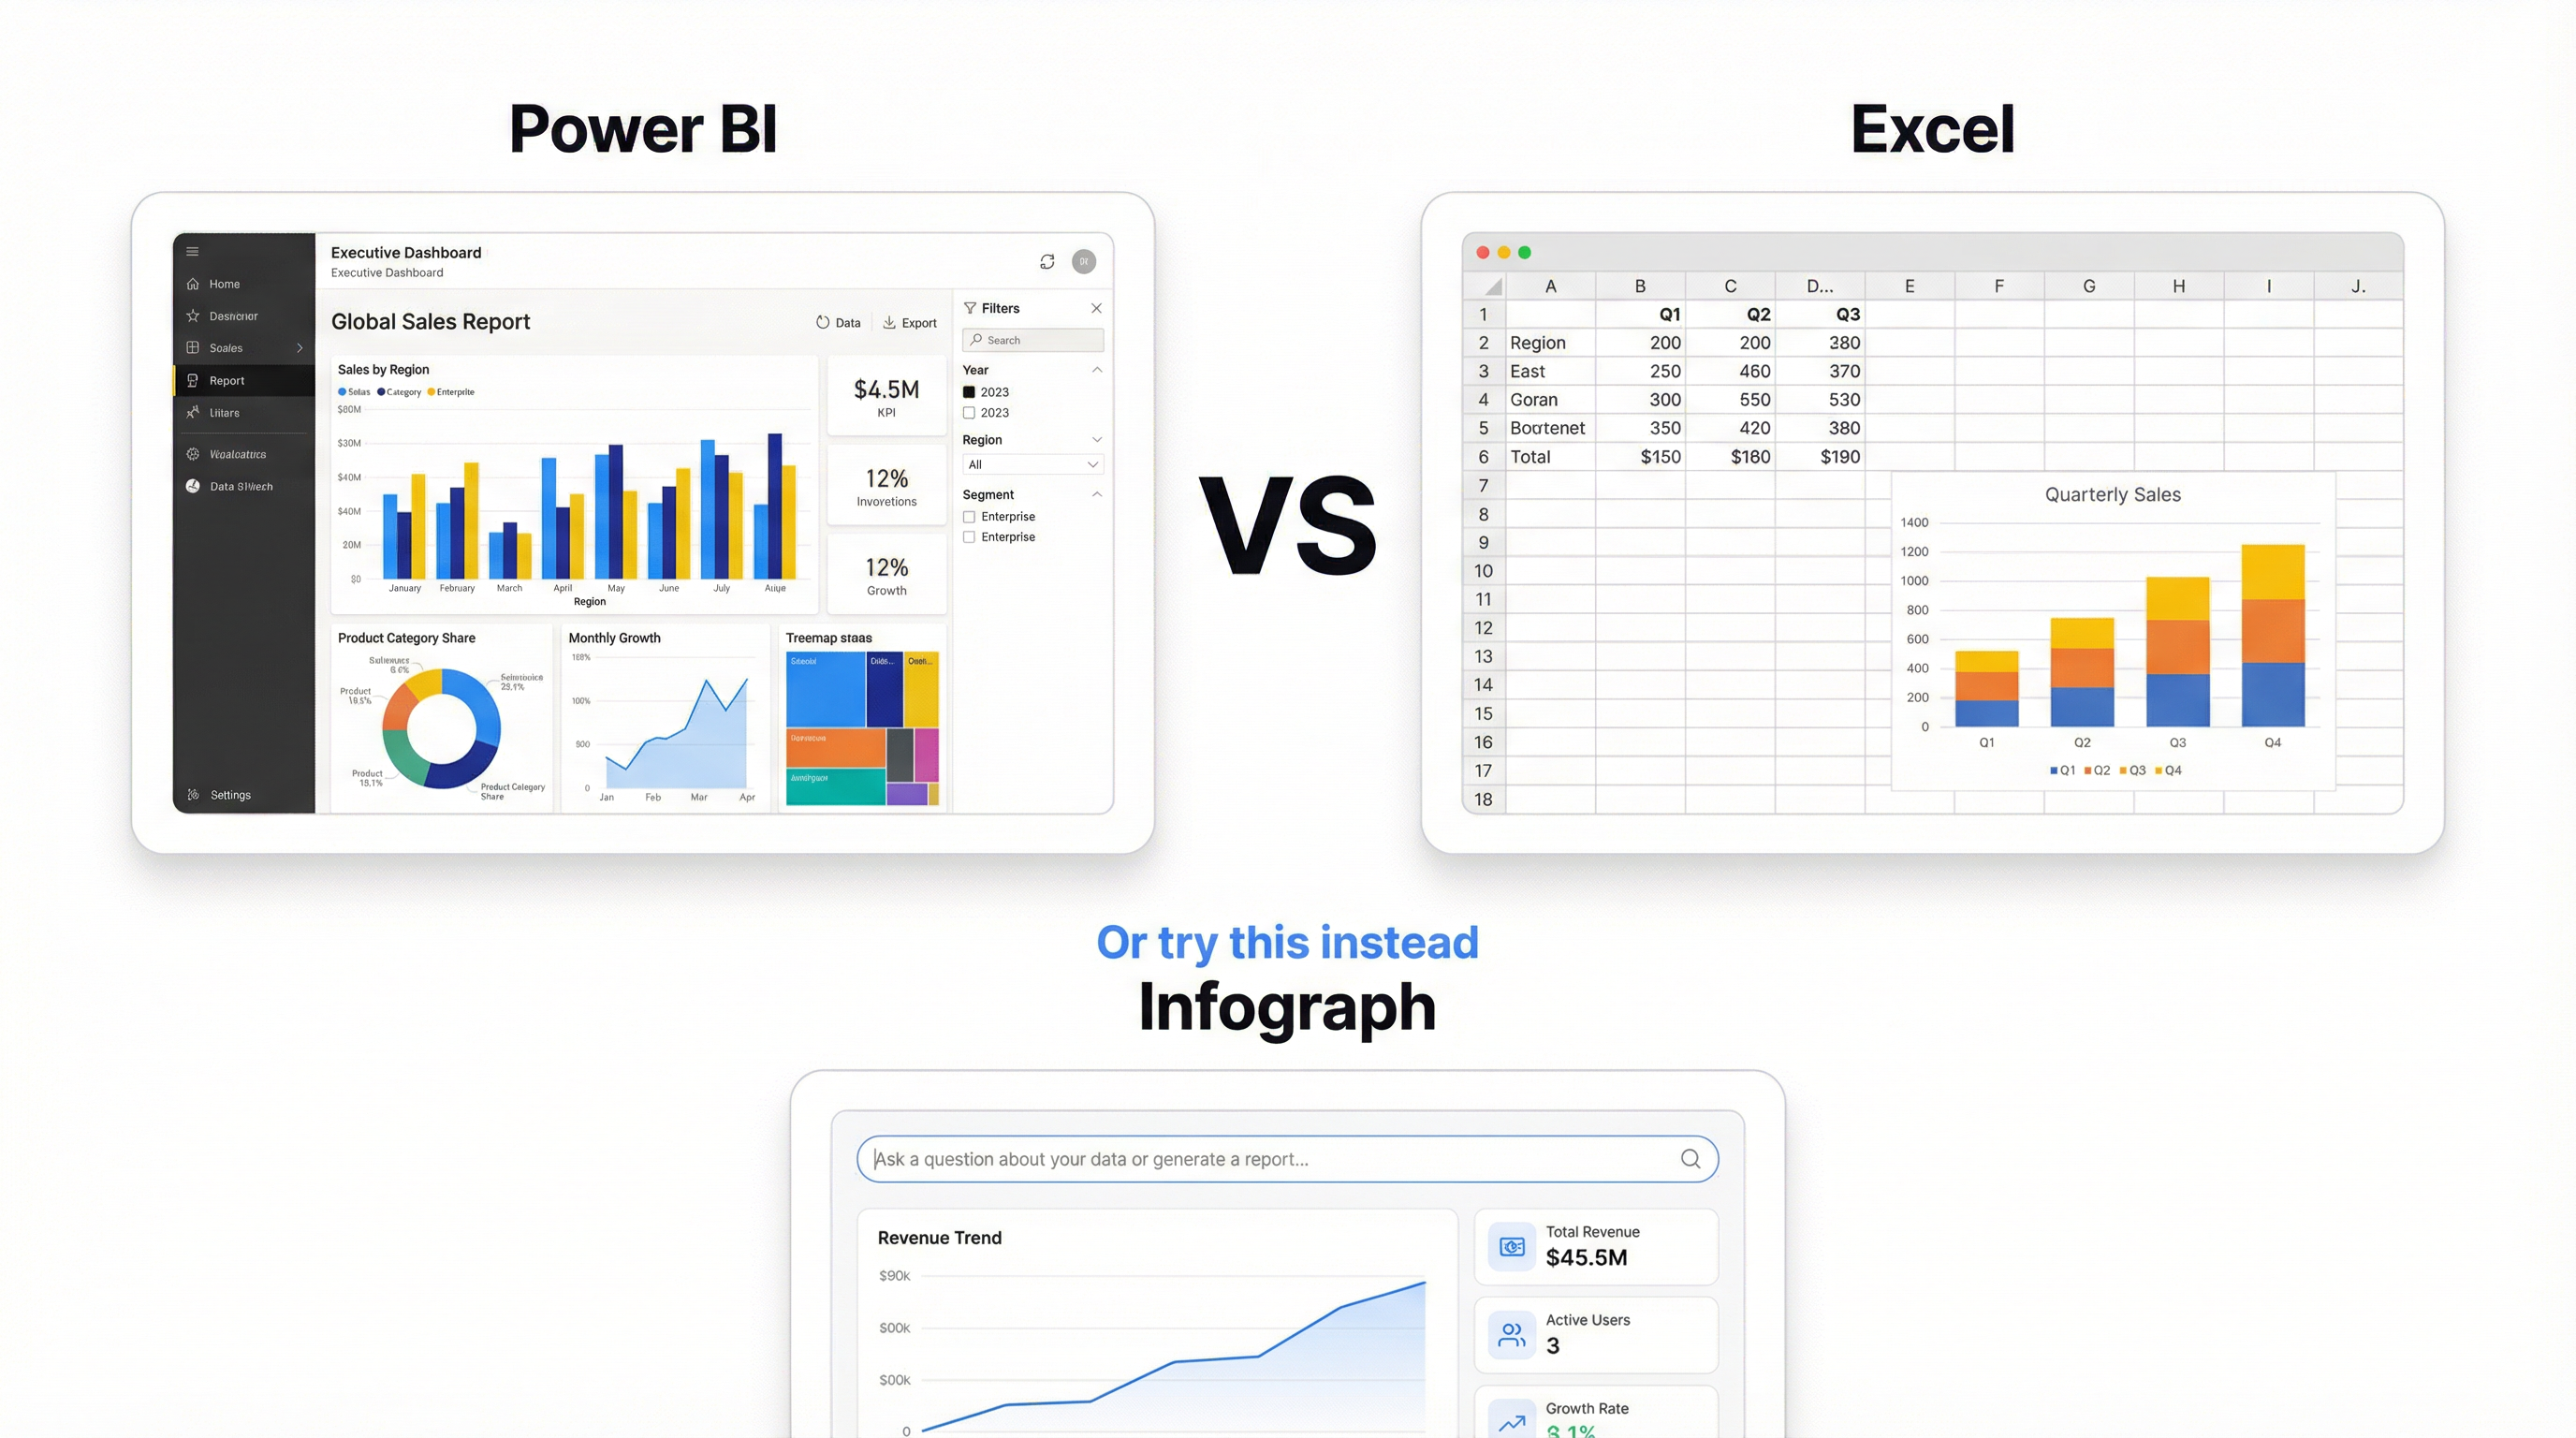
Most BI dashboard tools promise the same thing: connect your data, build dashboards, make better decisions. The reality is more complicated. Some require a full-time analyst. Some need a server. Some cost more per month than some people’s rent.
Here are six BI dashboard tools that are actually worth evaluating, ranked by how quickly a real person can go from raw data to a shipped dashboard.
Quick Comparison: Best BI Dashboard Tools
| Tool | Starting Price | Best For | Setup Time |
|---|---|---|---|
| Infograph | Free (1 dashboard) | Teams with spreadsheet data, no analyst | Minutes |
| Power BI | Free (Desktop) / $10/user/mo | Microsoft-heavy orgs | Hours to days |
| Tableau | $75/user/mo | Data professionals, complex viz | Days to weeks |
| Looker Studio | Free | Google ecosystem, marketing teams | Hours |
| Metabase | Free (self-hosted) / $85/mo cloud | SQL-literate teams wanting open source | Hours (cloud) to days (self-hosted) |
| Redash | Free (self-hosted only) | Engineers who live in SQL | Days |
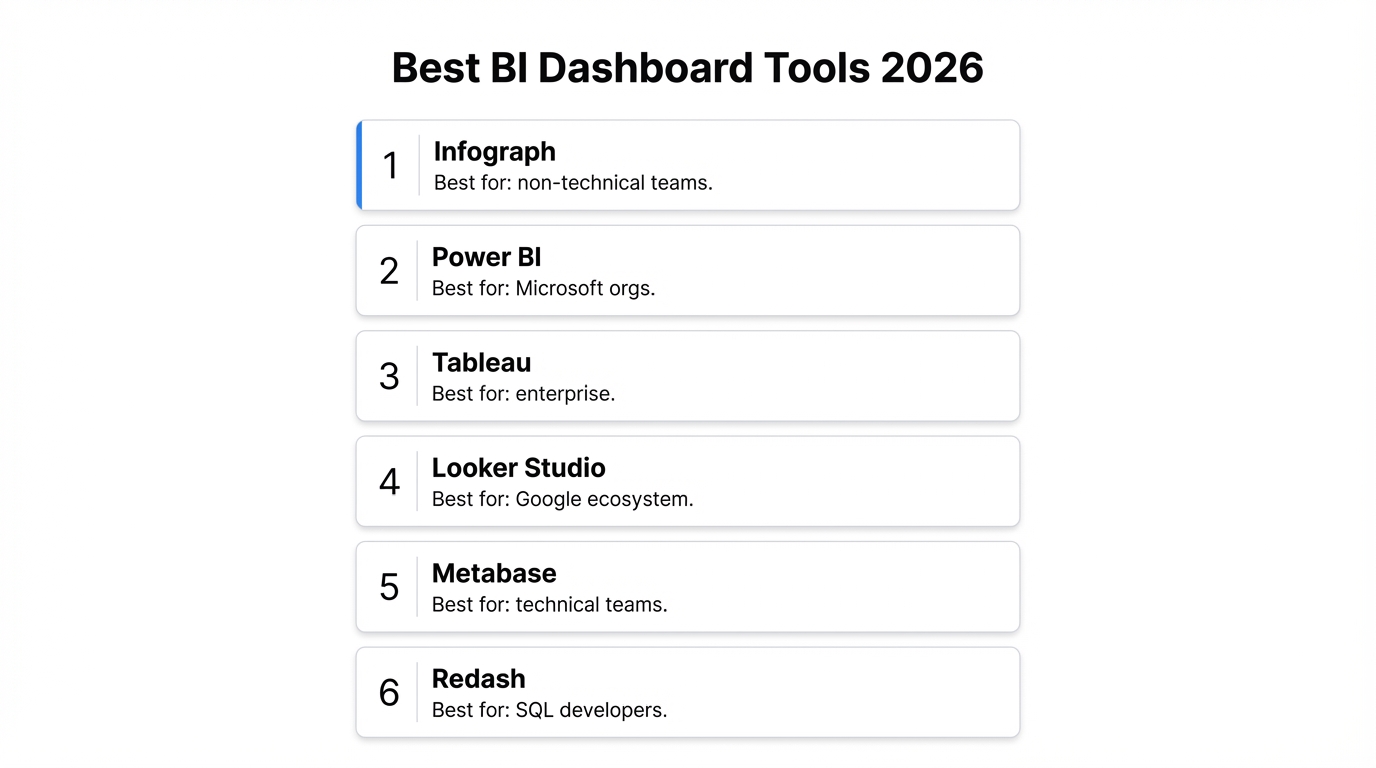
The 6 Best BI Dashboard Tools
1. Infograph — Best for teams without a dedicated analyst
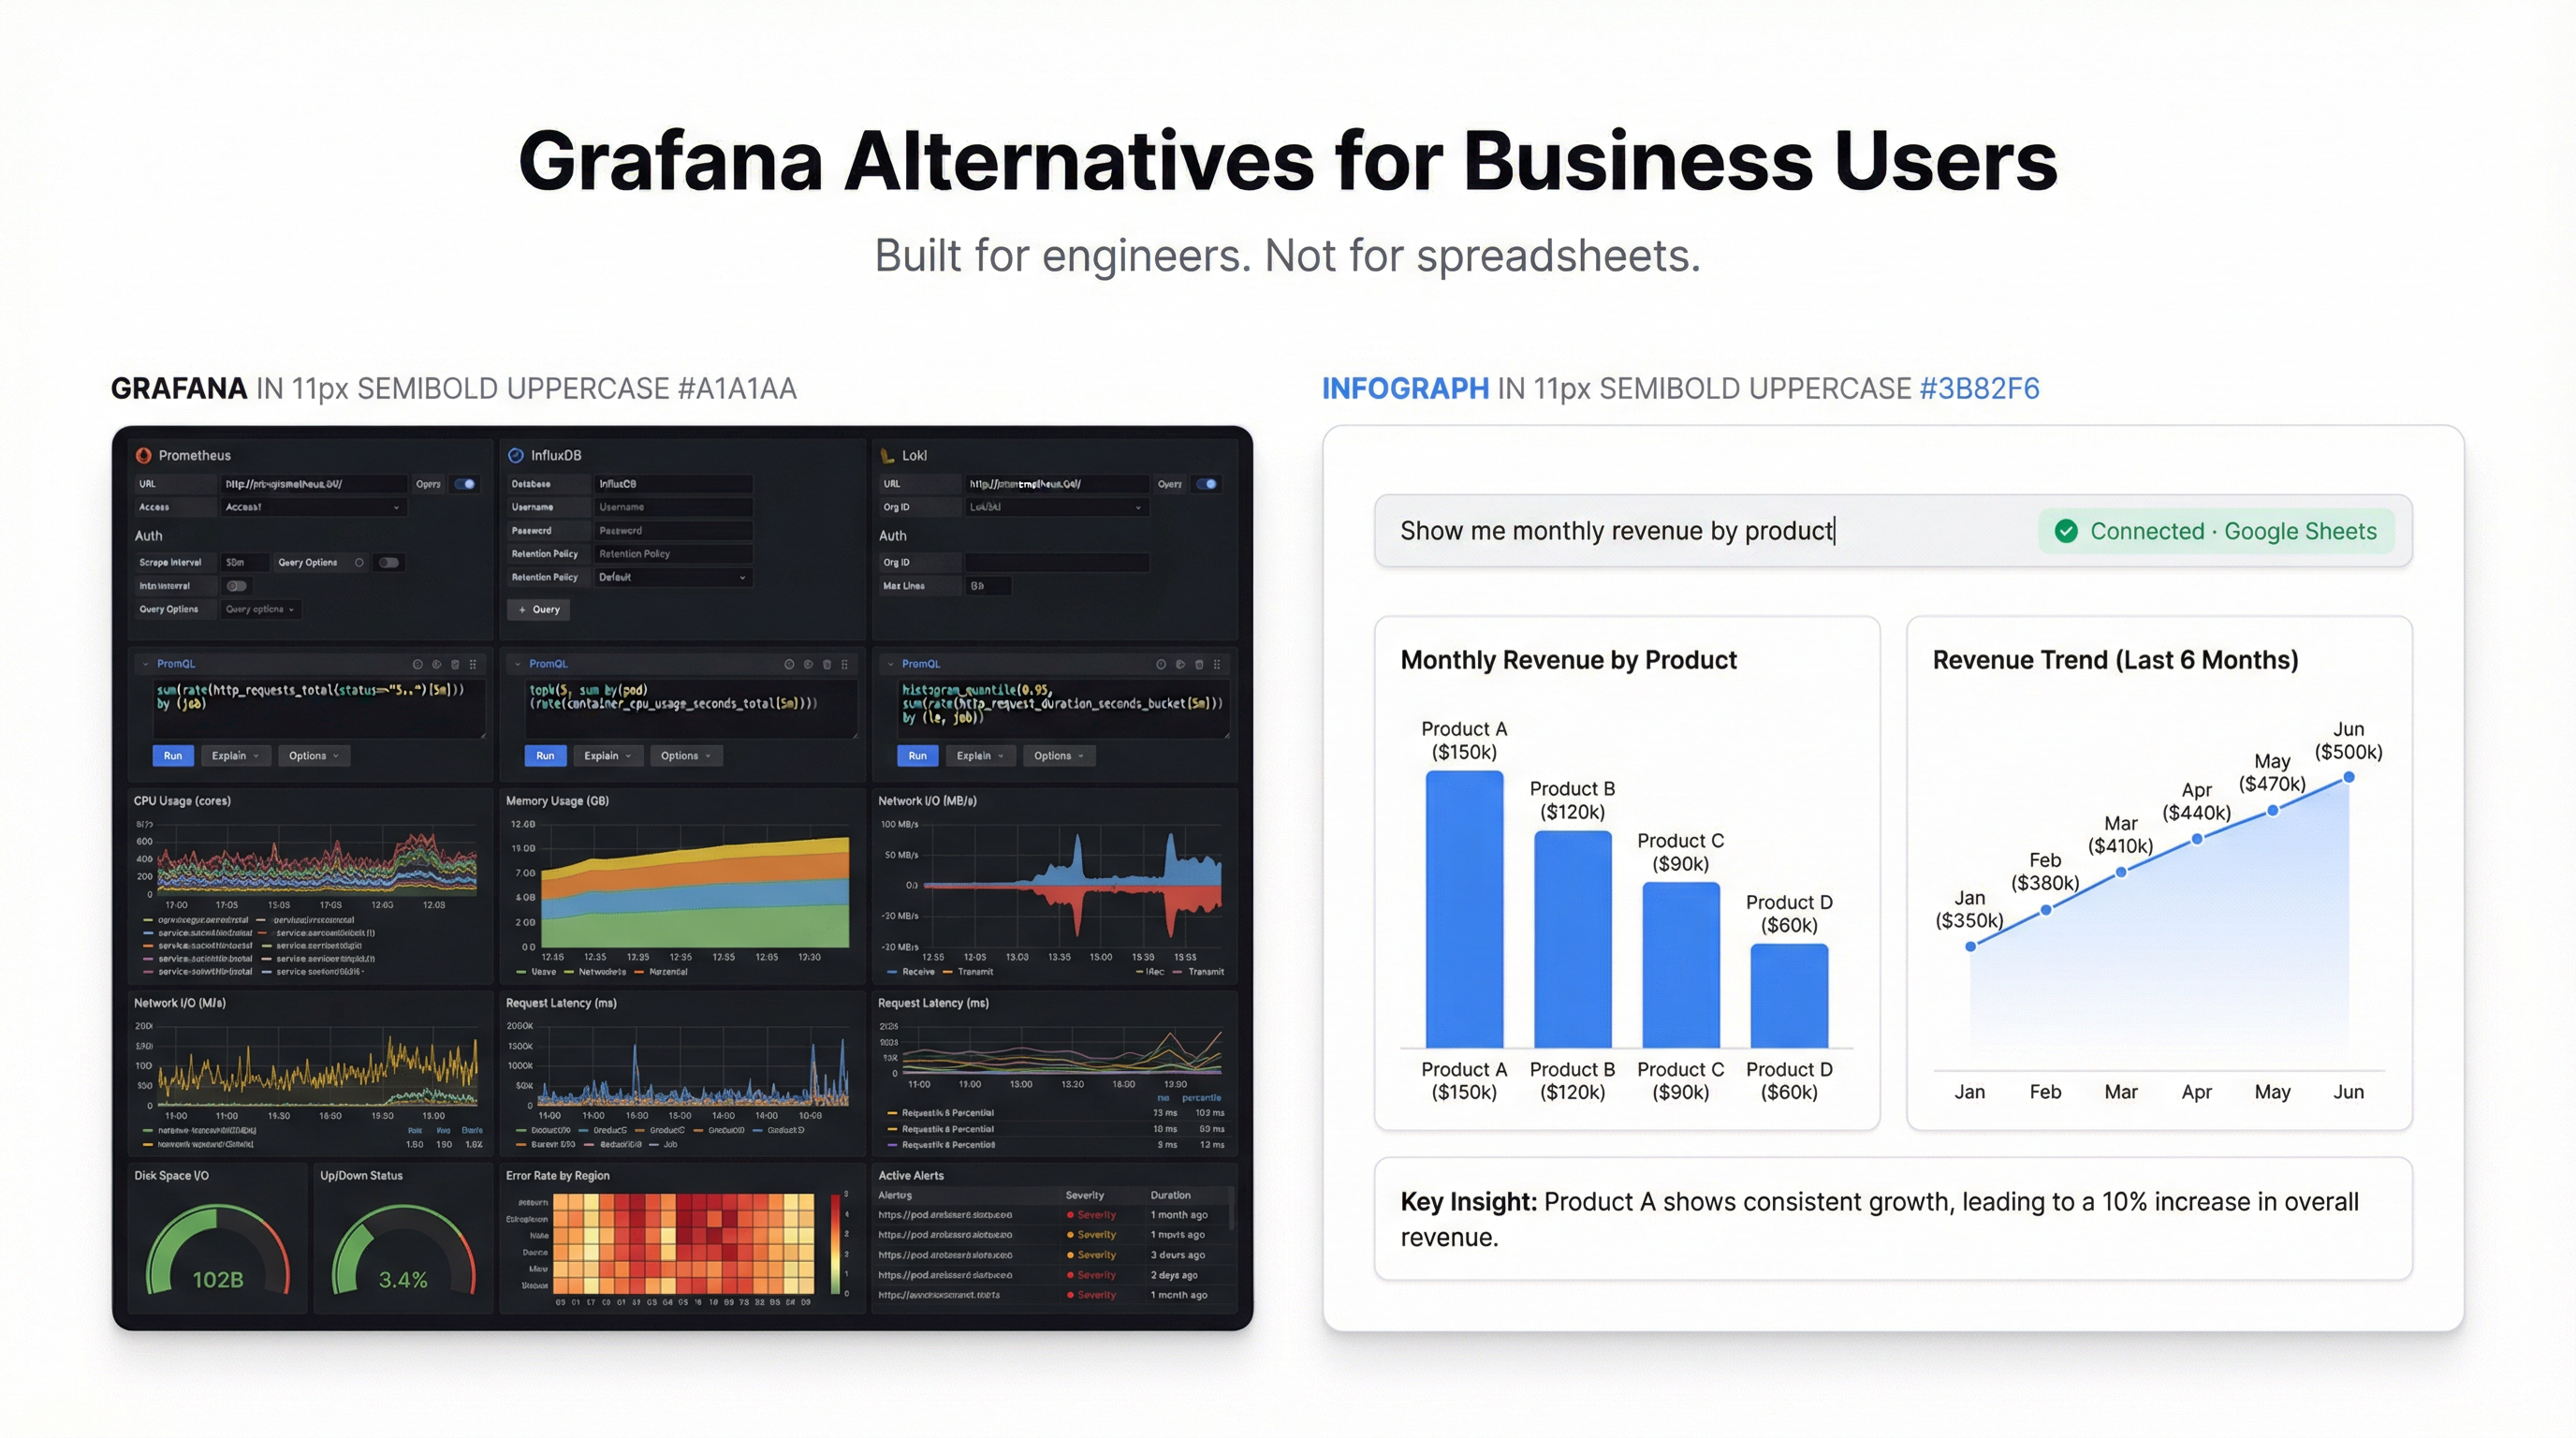
What it is: An AI-first BI dashboard tool. Upload a CSV, connect Google Sheets or Excel Online, prompt what you want, and the dashboard builds itself. Live data connections keep everything current without manual refreshes.
What’s good: Setup is measured in seconds, not sprints. You describe your dashboard in plain language — “show me monthly revenue by region with a trend line” — and it builds. No field mapping, no chart type selection, no drag-and-drop configuration.
The live connection to Google Sheets and Excel Online is genuine. Update a cell in your spreadsheet and the dashboard reflects it automatically. Most BI dashboard software requires you to schedule refreshes or trigger syncs manually.
For small teams and founders, this removes the biggest blocker: you don’t need to hire an analyst or learn a tool to get a working dashboard shipped.
What’s not great: Infograph connects to spreadsheets, not databases. If your data lives in PostgreSQL, Snowflake, or BigQuery, you’ll need to export it first or pipe it through a sheet. That’s a dealbreaker for data teams with proper warehouse setups.
The AI handles standard chart types well — bar, line, pie, metrics, tables — but it won’t build a custom Sankey diagram or a heavily configured waterfall chart. For exotic visualisations, a traditional BI tool gives you more control.
Pricing: Free tier with 1 dashboard and 500 AI credits, no credit card. Pro at $19.99/month for 5 dashboards with live connections. Teams at $49.99/month for 10 dashboards and 3 seats.
Verdict: The fastest path from spreadsheet to shipped dashboard. Pick it when speed matters more than SQL access.
2. Power BI — Best for Microsoft-heavy organisations
What it is: Microsoft’s enterprise BI dashboard software. Connects to nearly everything, from Excel to Azure SQL to Salesforce. Power BI Desktop is free. Publishing and sharing requires a Pro license.
What’s good: If your company runs on Microsoft 365, Power BI fits like a puzzle piece. The Excel connection is the best of any BI tool — it understands Excel data models natively, and DAX (the formula language) feels familiar to Excel power users.
The data modeling layer is genuinely powerful. You can build relationships between tables, write calculated measures, and handle complex business logic that simpler tools can’t touch. The free Desktop version is surprisingly capable for individual use.
What’s not great: Power BI Desktop is Windows-only. Mac users get a web version that’s slower and less capable. The learning curve for DAX is steep — it looks like Excel formulas but behaves differently in ways that trip people up for months.
Sharing is where the costs add up. Every person who views a dashboard needs a Pro license ($10/user/month) or your organisation needs Premium capacity (starts at $4,995/month). For a 50-person company where everyone should see dashboards, that’s $500/month minimum.
The interface has accumulated features over years and it shows. Finding where to configure something often means clicking through three menus and a side panel. The mobile experience is adequate, not good.
Pricing: Desktop is free. Pro at $10/user/month. Premium Per User at $20/user/month. Premium capacity starts at $4,995/month.
Verdict: The right choice if your company already pays for Microsoft 365 and has someone who can learn DAX. Overkill for small teams.
3. Tableau — Best for data professionals who need full control
What it is: The gold standard for data visualisation. Tableau can build virtually any chart type, handle massive datasets, and produce publication-quality visuals. Owned by Salesforce since 2019.
What’s good: Nothing else matches Tableau’s visualisation depth. Custom chart types, advanced calculations, geographic mapping, statistical analysis — if a visualisation exists, Tableau can build it. The community is massive. There’s a Tableau Public gallery with thousands of examples you can download and reverse-engineer.
Tableau Prep (the data preparation tool) is underrated. It handles messy data cleaning and transformation better than most standalone ETL tools.
What’s not great: The learning curve is the steepest on this list. Building your first useful Tableau dashboard takes days of learning, not hours. Concepts like dimensions vs. measures, discrete vs. continuous, and the “Marks” card system are not intuitive. You will watch YouTube tutorials.
Pricing is aggressive. At $75/user/month for Creator licenses, a 10-person analytics team costs $9,000/year. Viewer licenses exist at $15/user/month, but they’re view-only — no editing, no exploration.
Tableau Public (free) requires all dashboards to be published publicly. Your company’s revenue data on the open internet. For most business use cases, that’s a non-starter.
Pricing: Creator at $75/user/month. Explorer at $42/user/month. Viewer at $15/user/month. Tableau Public is free but public-only.
Verdict: Worth the investment if you have dedicated analysts and complex visualisation needs. Not the right tool for a marketing manager who wants a quick KPI dashboard.
4. Looker Studio — Best free BI dashboard tool for Google users
What it is: Google’s free BI dashboard tool, formerly known as Google Data Studio. Connects natively to Google Analytics, Google Sheets, BigQuery, and other Google services. Drag-and-drop interface with a template gallery.
What’s good: It’s completely free. No user limits, no dashboard limits, no feature gates. For teams already in the Google ecosystem, the native connections to Google Analytics 4 and BigQuery are seamless — no API keys, no credentials management, just authorize and go.
The template gallery has decent starting points for common use cases: GA4 reports, ad spend tracking, SEO dashboards. For marketing teams specifically, Looker Studio is hard to beat on value.
What’s not great: Performance degrades noticeably with large datasets or complex calculations. A dashboard with 15+ charts pulling from BigQuery can take 30 seconds to load. And there’s no caching layer you can configure — you’re at the mercy of Google’s infrastructure.
The drag-and-drop interface is serviceable but clunky. Aligning charts requires manual pixel adjustment. There’s no snap-to-grid that works reliably. Building a polished-looking dashboard takes more fiddling than it should.
Data blending (joining data from multiple sources) is limited and breaks in confusing ways. If you need to combine Google Analytics data with spreadsheet data in a single chart, prepare for frustration.
Pricing: Free.
Verdict: The obvious choice if you need Google Analytics dashboards and don’t want to pay anything. Less suitable for complex data from non-Google sources.
5. Metabase — Best open-source BI dashboard tool
What it is: An open-source BI platform that connects directly to databases. SQL-native, with a visual query builder for non-SQL users. Self-host for free or use Metabase Cloud.
What’s good: Metabase’s visual query builder is the best compromise between SQL power and GUI accessibility. Non-technical users can build queries by clicking through tables and filters. SQL users can drop into raw queries whenever the GUI isn’t enough.
The self-hosted version is genuinely free and full-featured. No artificial limitations, no user caps, no feature gates. For a startup with a technical co-founder who can manage a server, this is hard to beat on value.
Dashboard embedding is a standout feature. You can embed Metabase dashboards directly into your own product with white-labeling. For SaaS companies that want to ship analytics to their customers, this saves months of development.
What’s not great: Self-hosting means you own uptime, backups, and upgrades. The Java-based backend needs a real server — don’t try to run it on a $5/month VPS with 512MB of RAM. It will crash during peak usage.
Metabase Cloud ($85/month for 5 users) closes the self-hosting gap but gets expensive at scale. And some features, like audit logs and row-level permissions, are locked behind the Enterprise tier.
The visualisation options are functional but not beautiful. You won’t build award-winning data stories in Metabase. Charts are clean and readable, but customisation is limited compared to Tableau or even Power BI.
Pricing: Self-hosted is free. Cloud starts at $85/month (5 users). Enterprise pricing on request.
Verdict: The best BI dashboard tool for technical teams who want database access and don’t mind managing infrastructure. The visual query builder makes it accessible enough for mixed-skill teams.
6. Redash — Best for engineers who think in SQL
What it is: An open-source, SQL-native dashboarding tool. Write a query, get a chart. Connect to PostgreSQL, MySQL, BigQuery, Redshift, and dozens of other data sources. Self-hosted only since the managed service shut down.
What’s good: Redash is the simplest path from SQL query to dashboard. There’s no abstraction layer, no visual query builder trying to interpret what you want. You write SQL, pick a chart type, and add it to a dashboard. For engineers, this directness is refreshing.
It supports a massive list of data sources — over 35 database types. If your data is in a database, Redash can probably connect to it.
Alerts are built in. Set a threshold on any query result and Redash will notify you via Slack, email, or webhook when the threshold is crossed. Simple and effective.
What’s not great: Redash is self-hosted only. The hosted service (redash.io) shut down in 2021, and the open-source project’s development has slowed considerably. Community contributions keep it alive, but there are no guarantees about long-term maintenance.
The interface feels dated. It works, but it hasn’t had a design refresh in years. Non-technical users will struggle — there’s no visual query builder, no drag-and-drop, no prompting. If you can’t write SQL, Redash isn’t for you.
Dashboard layout is a basic grid. You can resize and rearrange panels, but don’t expect design controls like custom fonts, brand colours, or conditional formatting. It’s functional, not polished.
Pricing: Free (self-hosted only). No managed option.
Verdict: The right tool if your team writes SQL daily and you need a quick way to visualise query results internally. Not for customer-facing dashboards or non-technical teams.
Which BI Dashboard Tool Should You Pick?
Skip the feature matrices. Here’s the honest decision framework:
You have data in spreadsheets and no analyst on staff. Use Infograph. Prompt what you want, ship a live dashboard in minutes. It’s the fastest option on this list by a wide margin.
Your company runs Microsoft 365 and has someone who can learn DAX. Use Power BI. The ecosystem integration is unmatched and the free Desktop version is genuinely powerful.
You have a data team that needs maximum visualisation flexibility. Use Tableau. Accept the learning curve and the pricing. Nothing else offers the same depth.
You need free dashboards from Google Analytics or BigQuery. Use Looker Studio. It’s free, it connects natively, and it works.
You have a database and technical users who want open-source. Use Metabase. The visual query builder bridges the gap between SQL and non-SQL users.
Your engineers want raw SQL access with minimal overhead. Use Redash. But be realistic about the long-term maintenance commitment.
The Honest Truth About BI Dashboard Software
No single tool wins across every use case. The best BI dashboard tools are the ones that match how your team actually works — not the ones with the longest feature list.
If you’re spending more time configuring your BI tool than actually reading your dashboards, you’ve picked the wrong one. Start with what you have. If that’s a spreadsheet, you don’t need an enterprise BI platform. You need something that turns that spreadsheet into a dashboard you’ll actually check every morning.