Excel dashboards are something you can build in an afternoon. Power BI dashboards are something you plan for a quarter. That gap tells you almost everything you need to know about when to pick each one.
Power BI vs Excel: The Real Difference
Both tools come from Microsoft. Both connect to data. Both produce charts. But that’s where the similarity ends.
Excel is a spreadsheet that happens to have charts. Power BI is a business intelligence platform that happens to connect to spreadsheets. The distinction matters because it shapes who can use each tool, how long setup takes, and what the output looks like.
An Excel dashboard is a worksheet with pivot charts, slicers, and conditional formatting arranged to tell a story. You build it yourself, cell by cell. The ceiling is lower, but you hit the floor immediately.
A Power BI dashboard is a collection of visuals backed by a data model, connected to live sources, published to a web service, and managed through a governance layer. The ceiling is much higher. The floor is also much higher — in time, cost, and skill required.
Where Excel Dashboards Win
Speed to first dashboard. If your data is already in a spreadsheet, an Excel dashboard takes minutes. No setup, no admin console, no data model design. Pivot table, pivot chart, slicer. Done.
Familiarity. Everyone knows Excel. Not everyone knows it well, but well enough to read a chart and filter by date range. You won’t need to train your team to view an Excel dashboard.
Flexibility with data. Excel lets you edit underlying data directly. Spot an error in row 47? Fix it. Need to add a calculated column? Add it. Power BI doesn’t let end users touch the source data — which is a feature for governance but a pain when you just need to correct a typo.
Cost. Excel comes with Microsoft 365. If your company already pays for Office, dashboards in Excel cost nothing extra. Power BI Pro is $10/user/month on top of that. For a 20-person team that needs view access, that’s $200/month for something Excel does for free.
Offline access. Excel works without internet. Power BI dashboards live in the cloud. If you’re presenting to a client in a building with terrible WiFi, the Excel file wins.
Where Power BI Dashboards Win
Data modeling. Power BI’s data model (built on DAX and Power Query) handles relationships between tables, calculated measures, and time intelligence functions that would require ugly workarounds in Excel. If you need year-over-year growth calculated dynamically across three related tables, Power BI handles that cleanly. Excel will fight you.
Scale. Excel starts struggling around 500,000 rows. Power BI handles tens of millions without visible performance issues. If your dataset is large, this isn’t a close call.
Sharing and collaboration. Publishing a Power BI dashboard to your organization is straightforward — a URL, role-based access, automatic refresh schedules. Sharing an Excel dashboard means emailing a file or putting it on SharePoint and hoping nobody breaks the formulas.
Automatic refresh. Power BI connects to databases, APIs, and cloud services, then refreshes on a schedule. Excel can do some of this with Power Query, but it’s clunky and requires the workbook to be open.
Visual quality. Power BI’s built-in visuals look better out of the box. Custom visuals from the marketplace extend this further. Excel charts look like Excel charts. You can improve them, but you’re always starting from a lower baseline.
Power BI vs Excel Dashboard: The Hidden Costs
The licensing math on Power BI trips people up. Power BI Desktop is free. But publishing to the Power BI Service — which is where dashboards actually become useful — requires Pro ($10/user/month) or Premium ($20/user/month). And every person who views the dashboard needs a license too, unless you’re on Premium Per Capacity, which starts at $4,995/month.
For a small team, this adds up fast. A 5-person marketing team that wants a shared dashboard is suddenly paying $600/year just to view charts.
Excel has hidden costs too. They’re just measured in time. Building a polished Excel dashboard takes hours of formatting. Maintaining it — updating ranges when data grows, fixing broken references, keeping the layout intact — takes more hours every month. Nobody budgets for this, but everyone pays for it.
And then there’s the skill gap. Power BI requires DAX knowledge to build anything beyond basic visuals. DAX is not intuitive. The learning curve is steep enough that most teams either hire a specialist or send someone to training. That’s a real cost that rarely shows up in the comparison spreadsheet.
When Neither Tool Is the Right Answer
Here’s what both Power BI and Excel have in common: they assume you have time to build the dashboard yourself.
Power BI assumes you have time to design a data model, write DAX measures, choose visuals, and configure refresh schedules. Excel assumes you have time to build pivot tables, format charts, and maintain the workbook as data changes.
If you have that time and those skills, both tools work well. Many teams don’t.
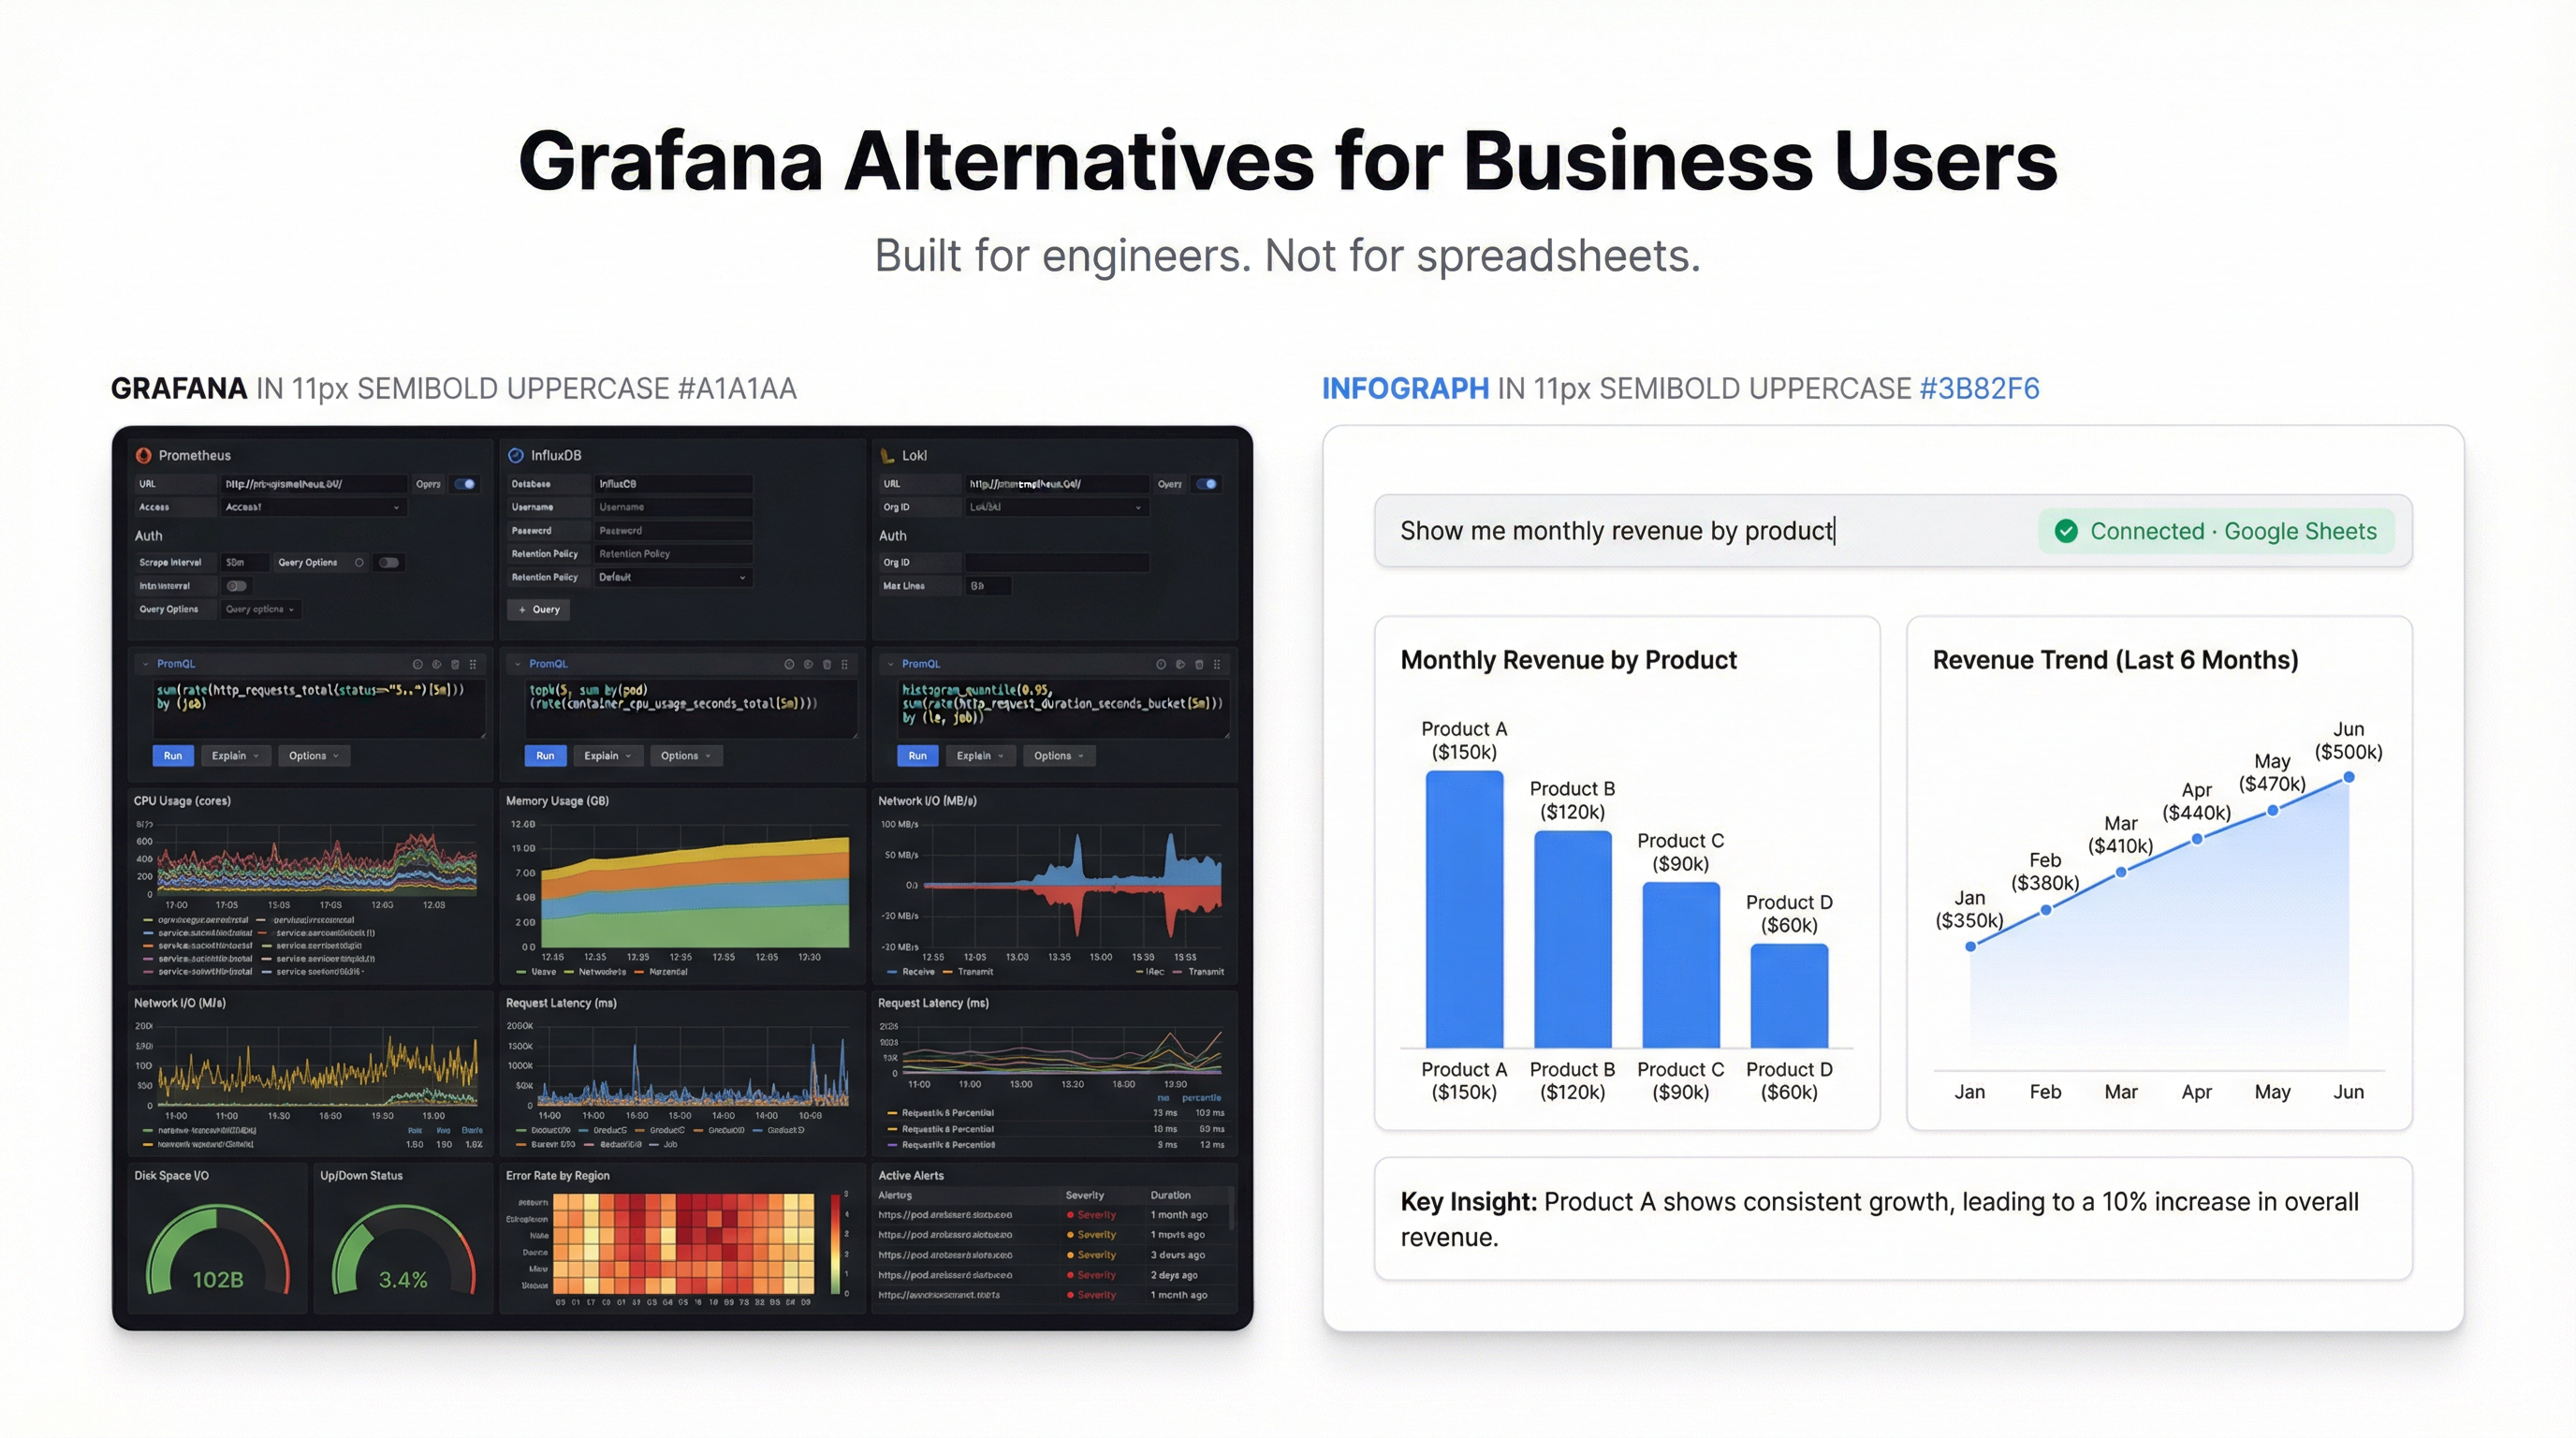
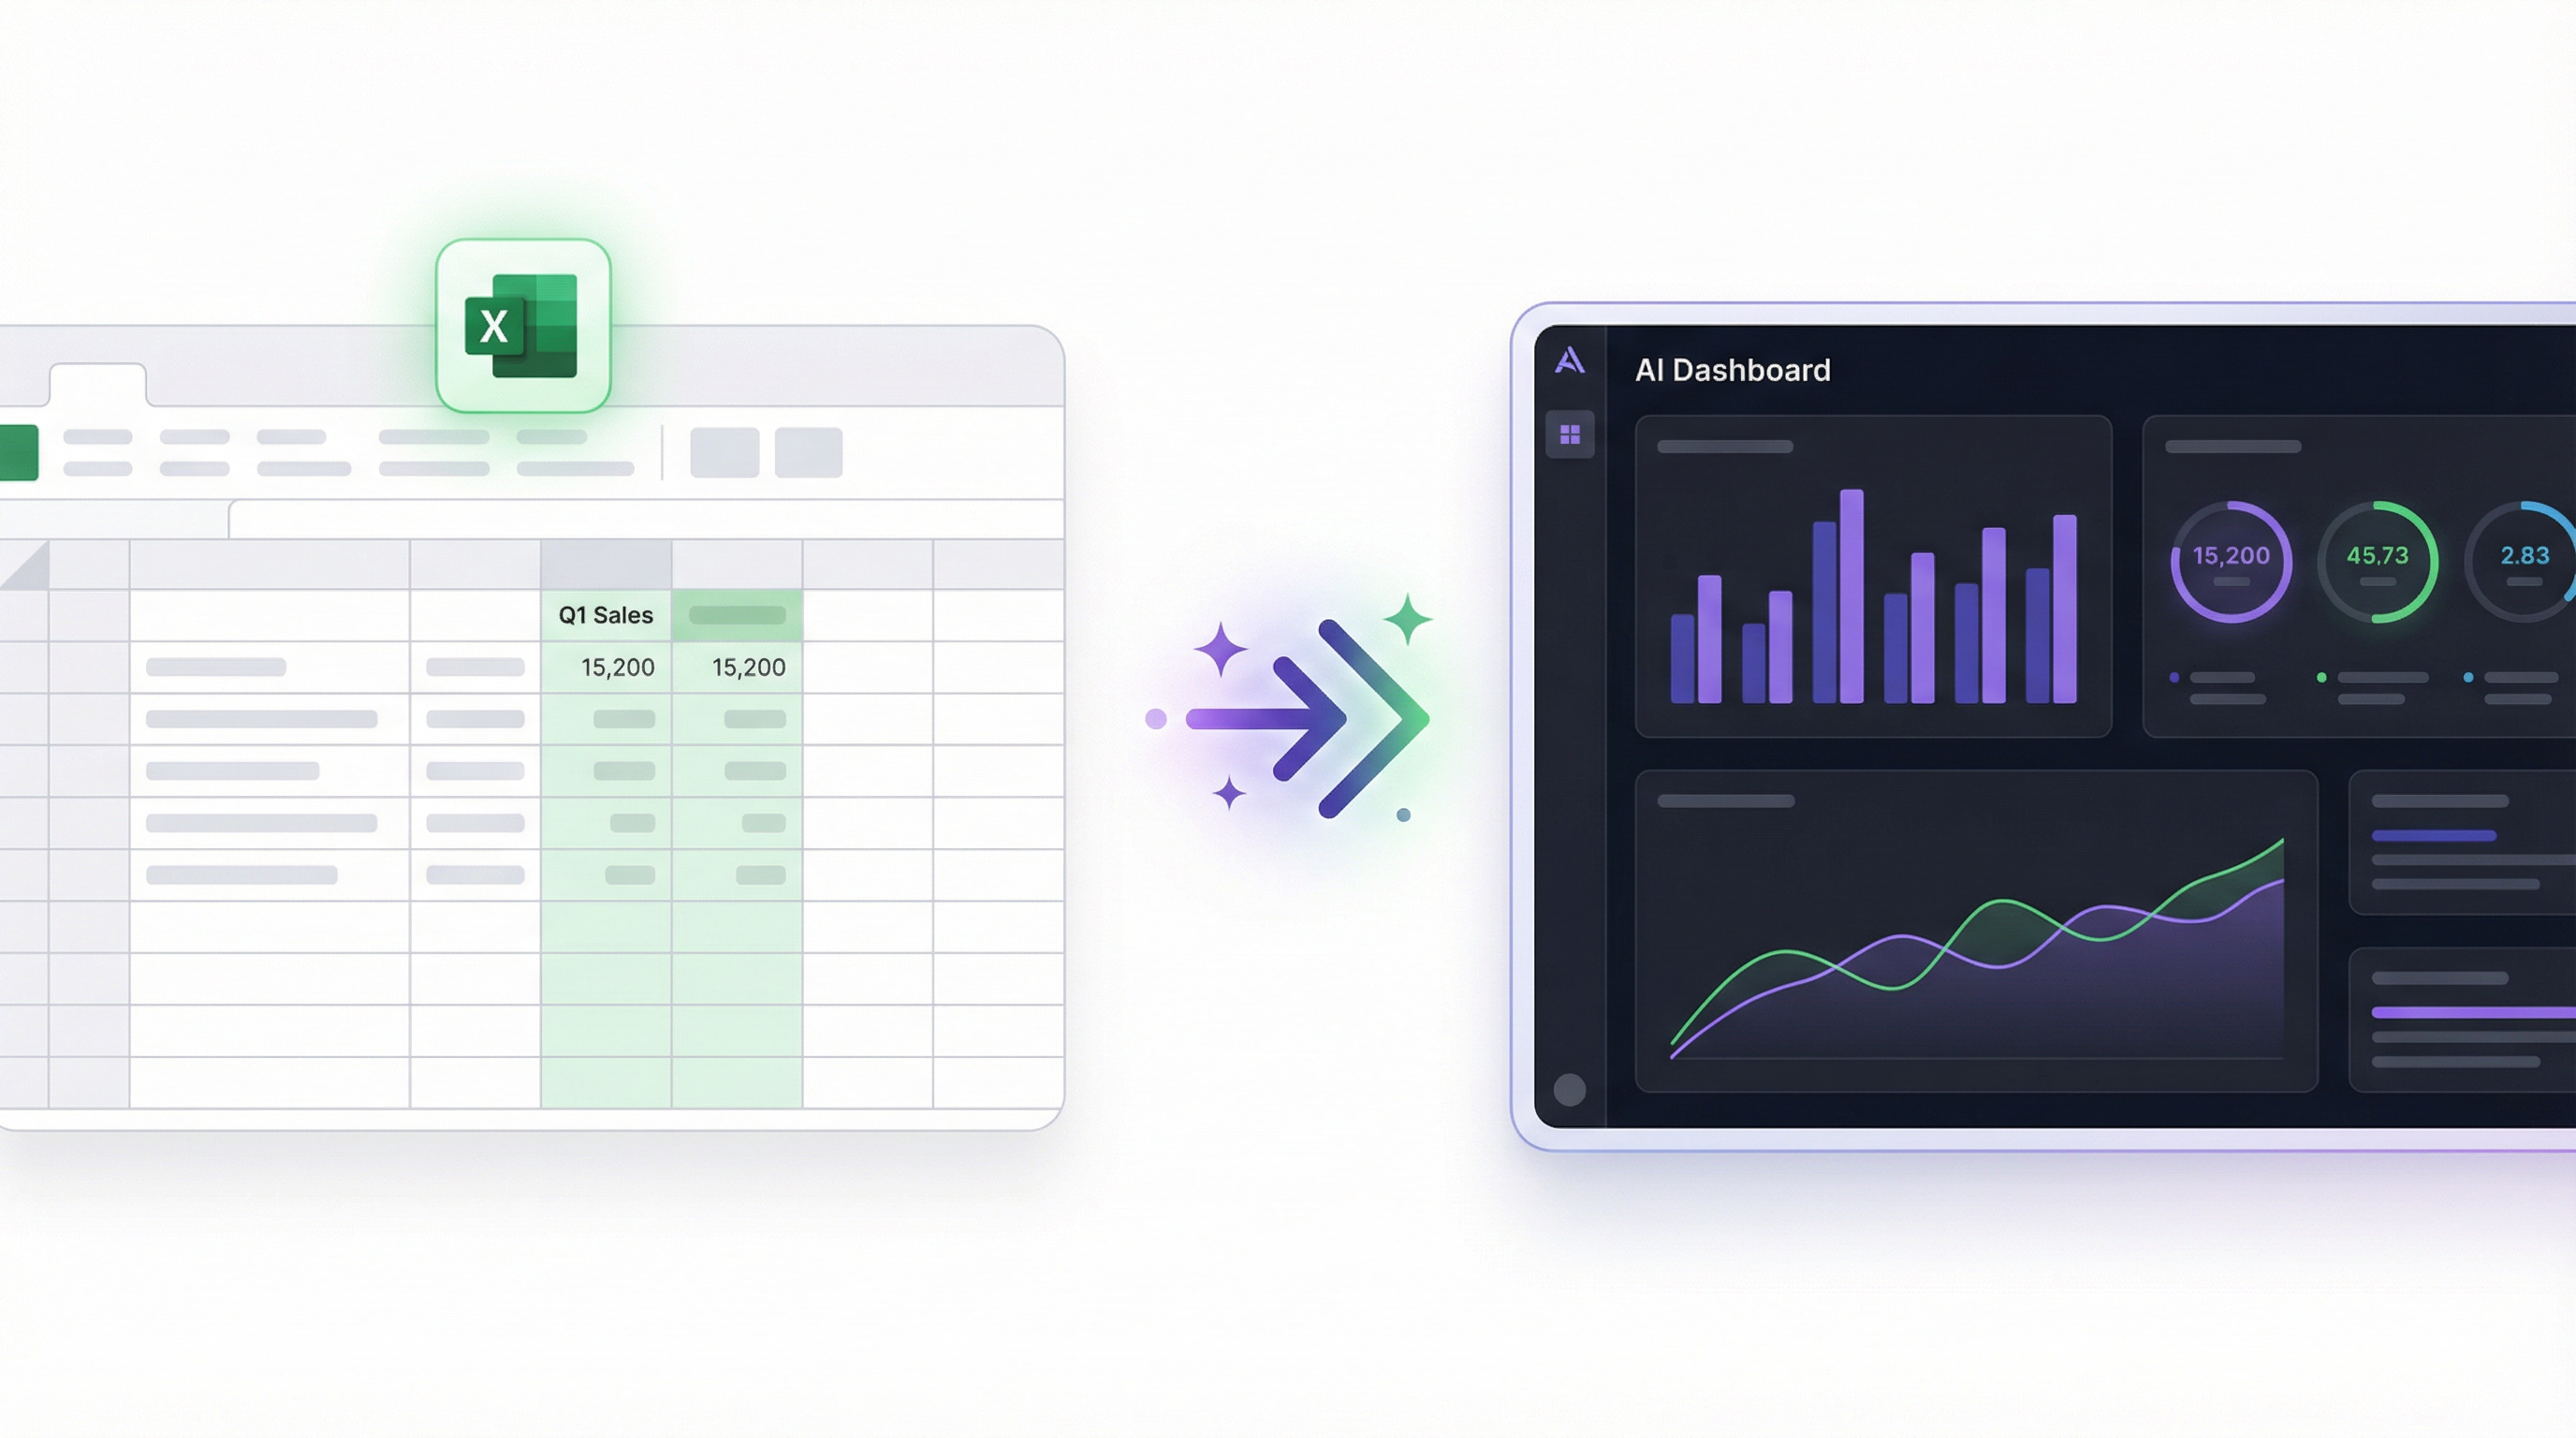
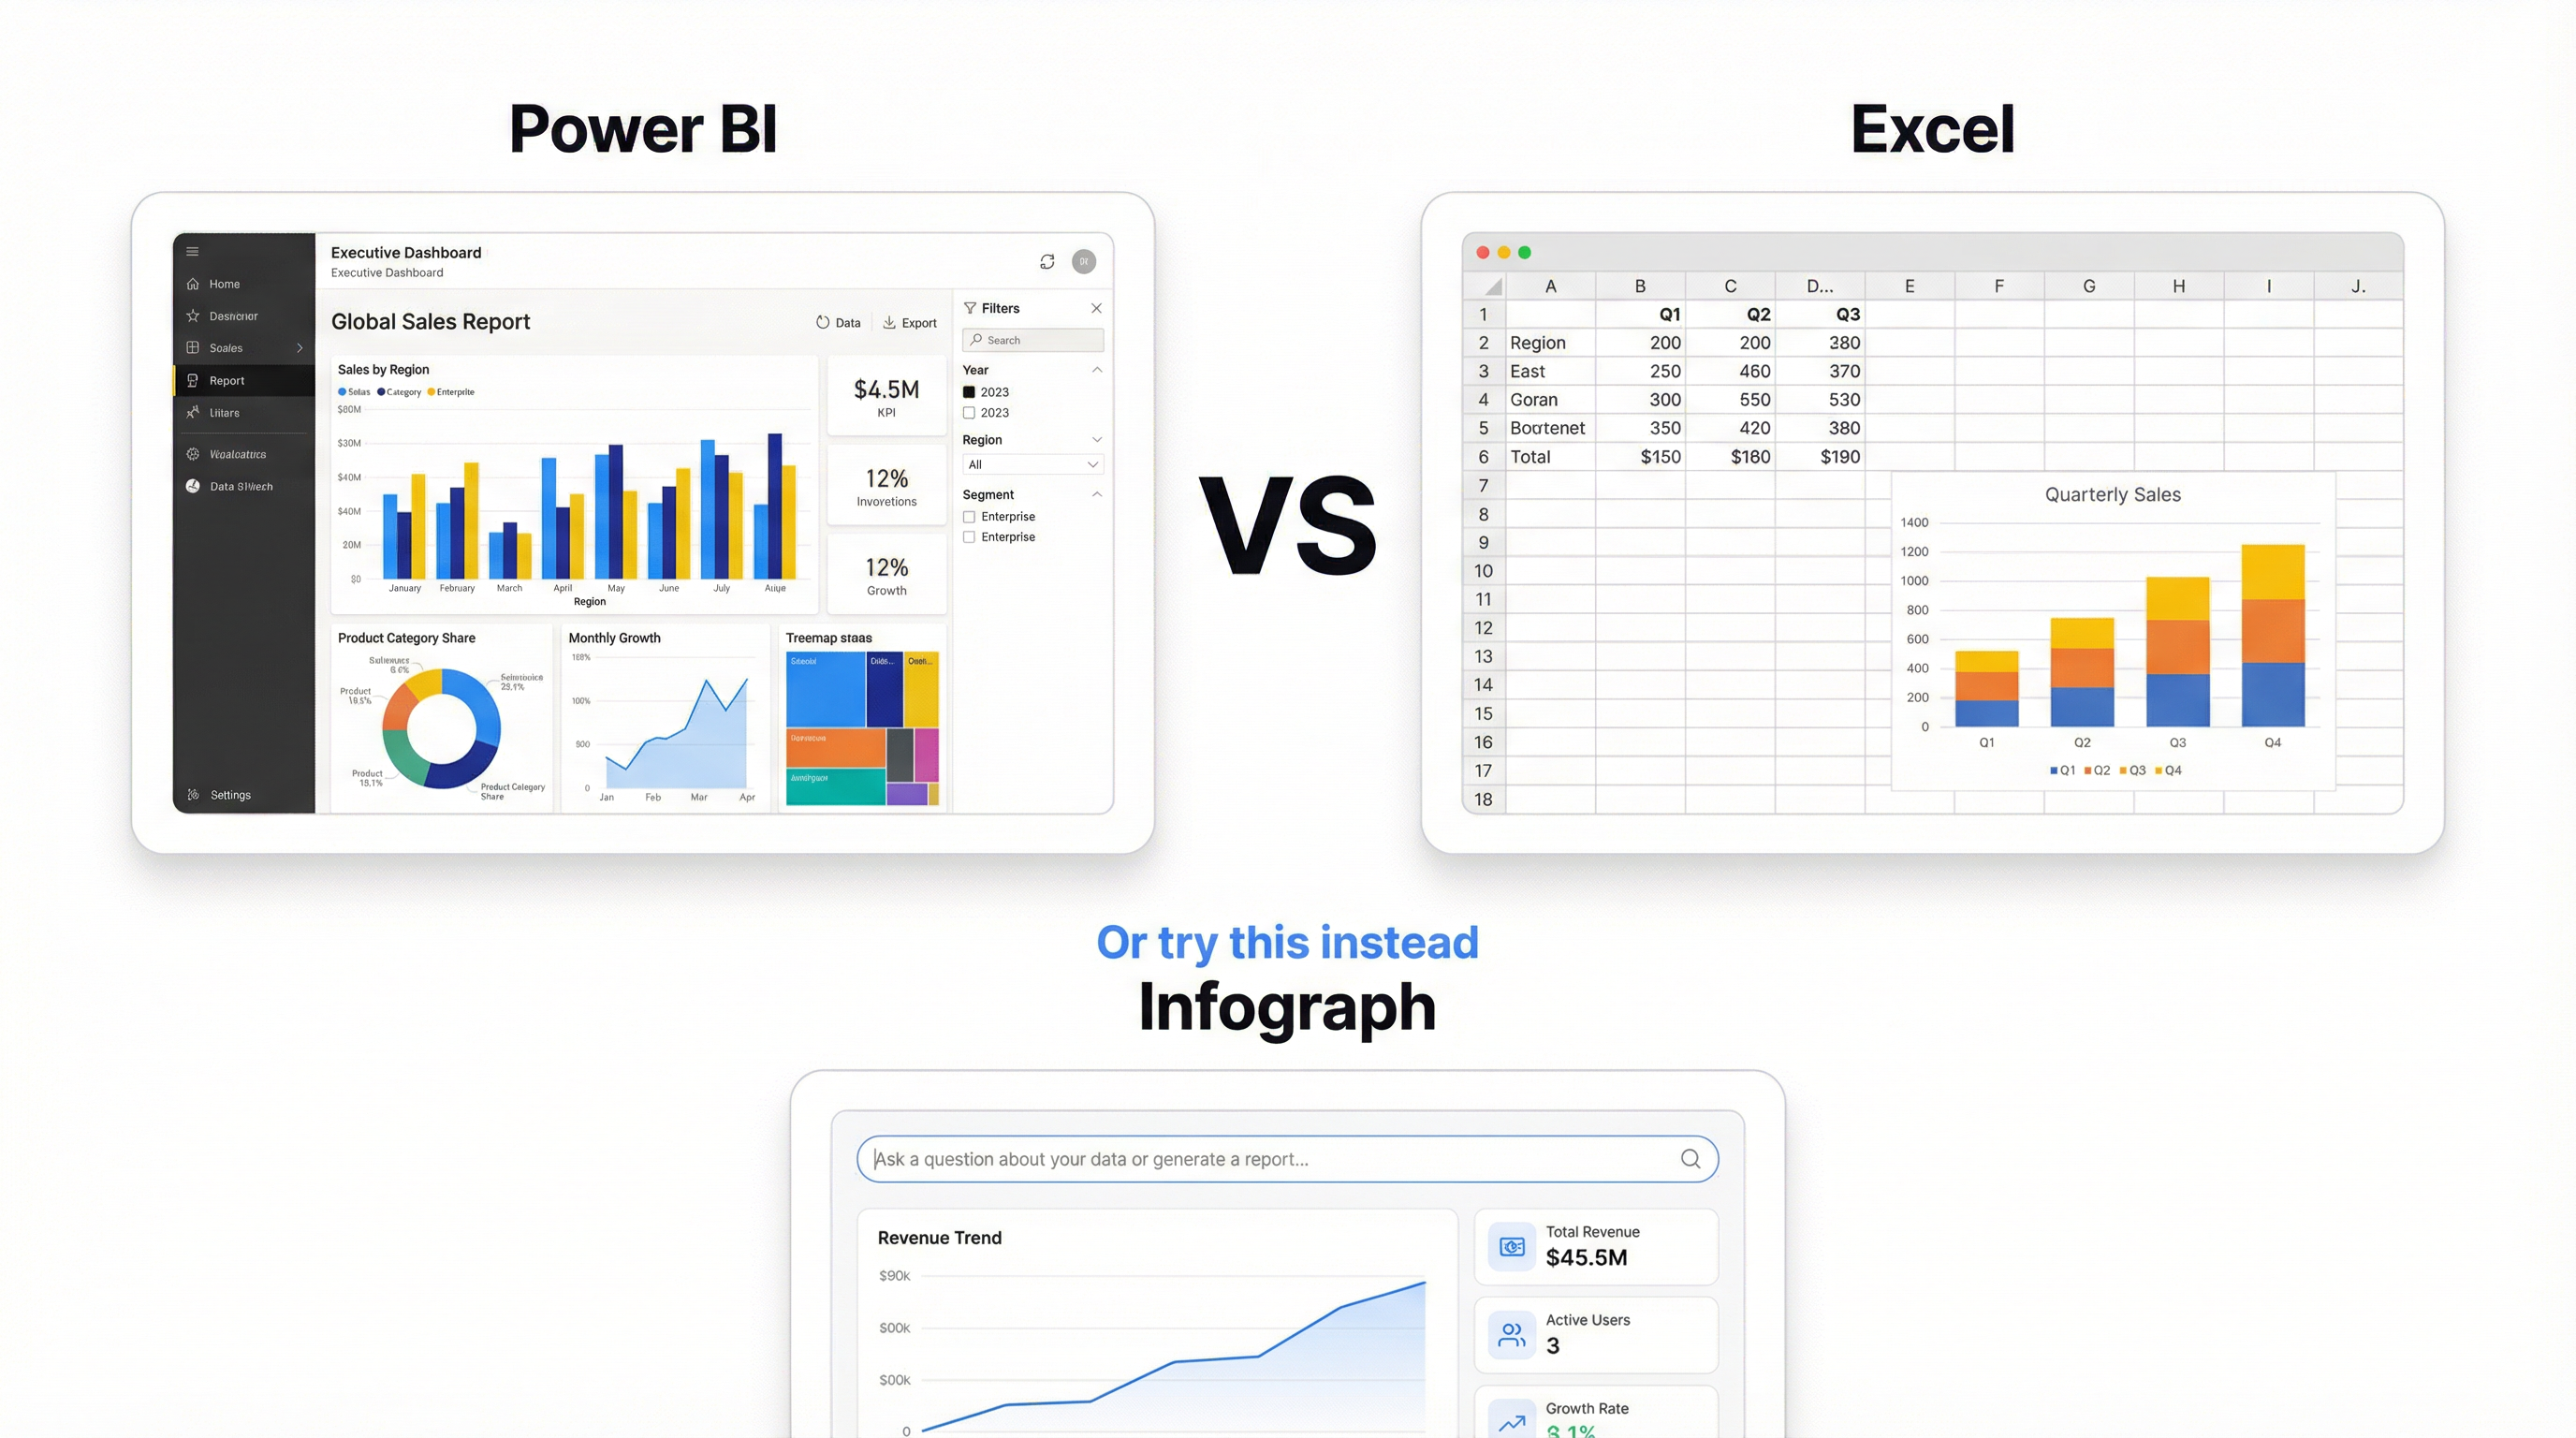
The fastest path from “data in a spreadsheet” to “dashboard someone can actually use” isn’t either of these tools. It’s describing what you want and having AI build it.
Infograph works like this: upload an Excel file or connect a Google Sheet or Excel Online workbook. Describe your dashboard in plain language — “show monthly revenue by region with a comparison to last year.” The AI reads your data, picks the right chart types, and builds the dashboard.
No DAX. No pivot tables. No dragging fields into wells. You prompt, it builds.
The live connection matters here. Connect an Excel Online file, and when the spreadsheet updates, the dashboard updates automatically. That’s the Power BI automatic-refresh experience without the Power BI setup.
Free tier gets you one dashboard at no cost. Pro is $19.99/month for five dashboards with live connections. Teams is $49.99/month. Compared to Power BI’s per-user licensing, the math is different — especially for teams where multiple people need to view dashboards but only one person builds them.
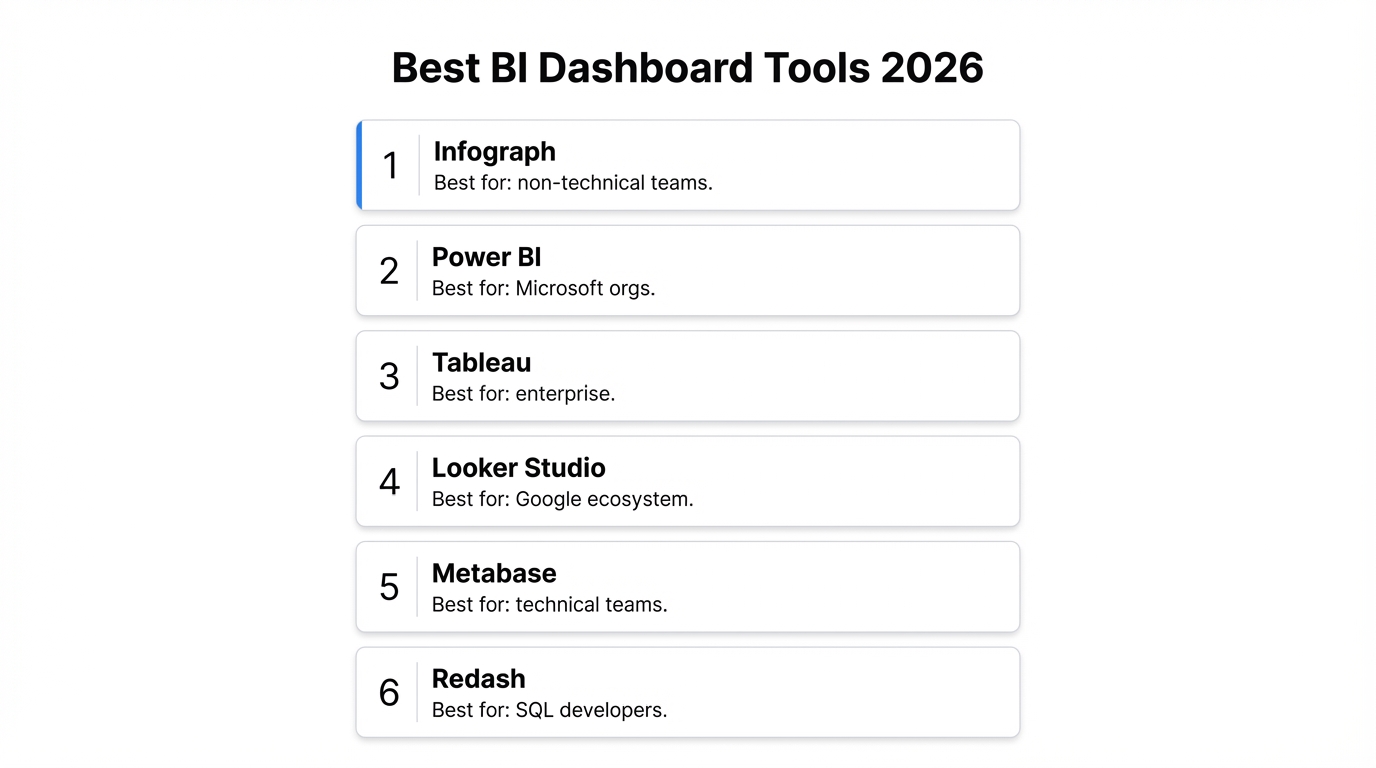
The Decision Framework
Use Excel dashboards when:
- Your data is small (under 100,000 rows)
- You need something today, not next week
- Your audience already has Excel
- You’re the only person maintaining it
- Budget is zero
Use Power BI dashboards when:
- You’re joining multiple data sources
- Your dataset is large
- You need scheduled refresh from databases or APIs
- Your organization has IT governance requirements
- Someone on the team knows DAX (or will learn it)
Use an AI dashboard tool when:
- You want a dashboard in minutes, not hours
- Nobody on the team knows DAX or wants to learn it
- Your data lives in spreadsheets
- You need live updates without manual maintenance
- You’d rather describe what you want than configure it yourself
The Power BI vs Excel dashboard debate has been running for years. But the question was always slightly wrong. It was never about which tool is better — it was about how much time and skill you have available. If the answer is “not much,” neither tool is the right starting point.
Build your first dashboard free — no credit card, no setup →