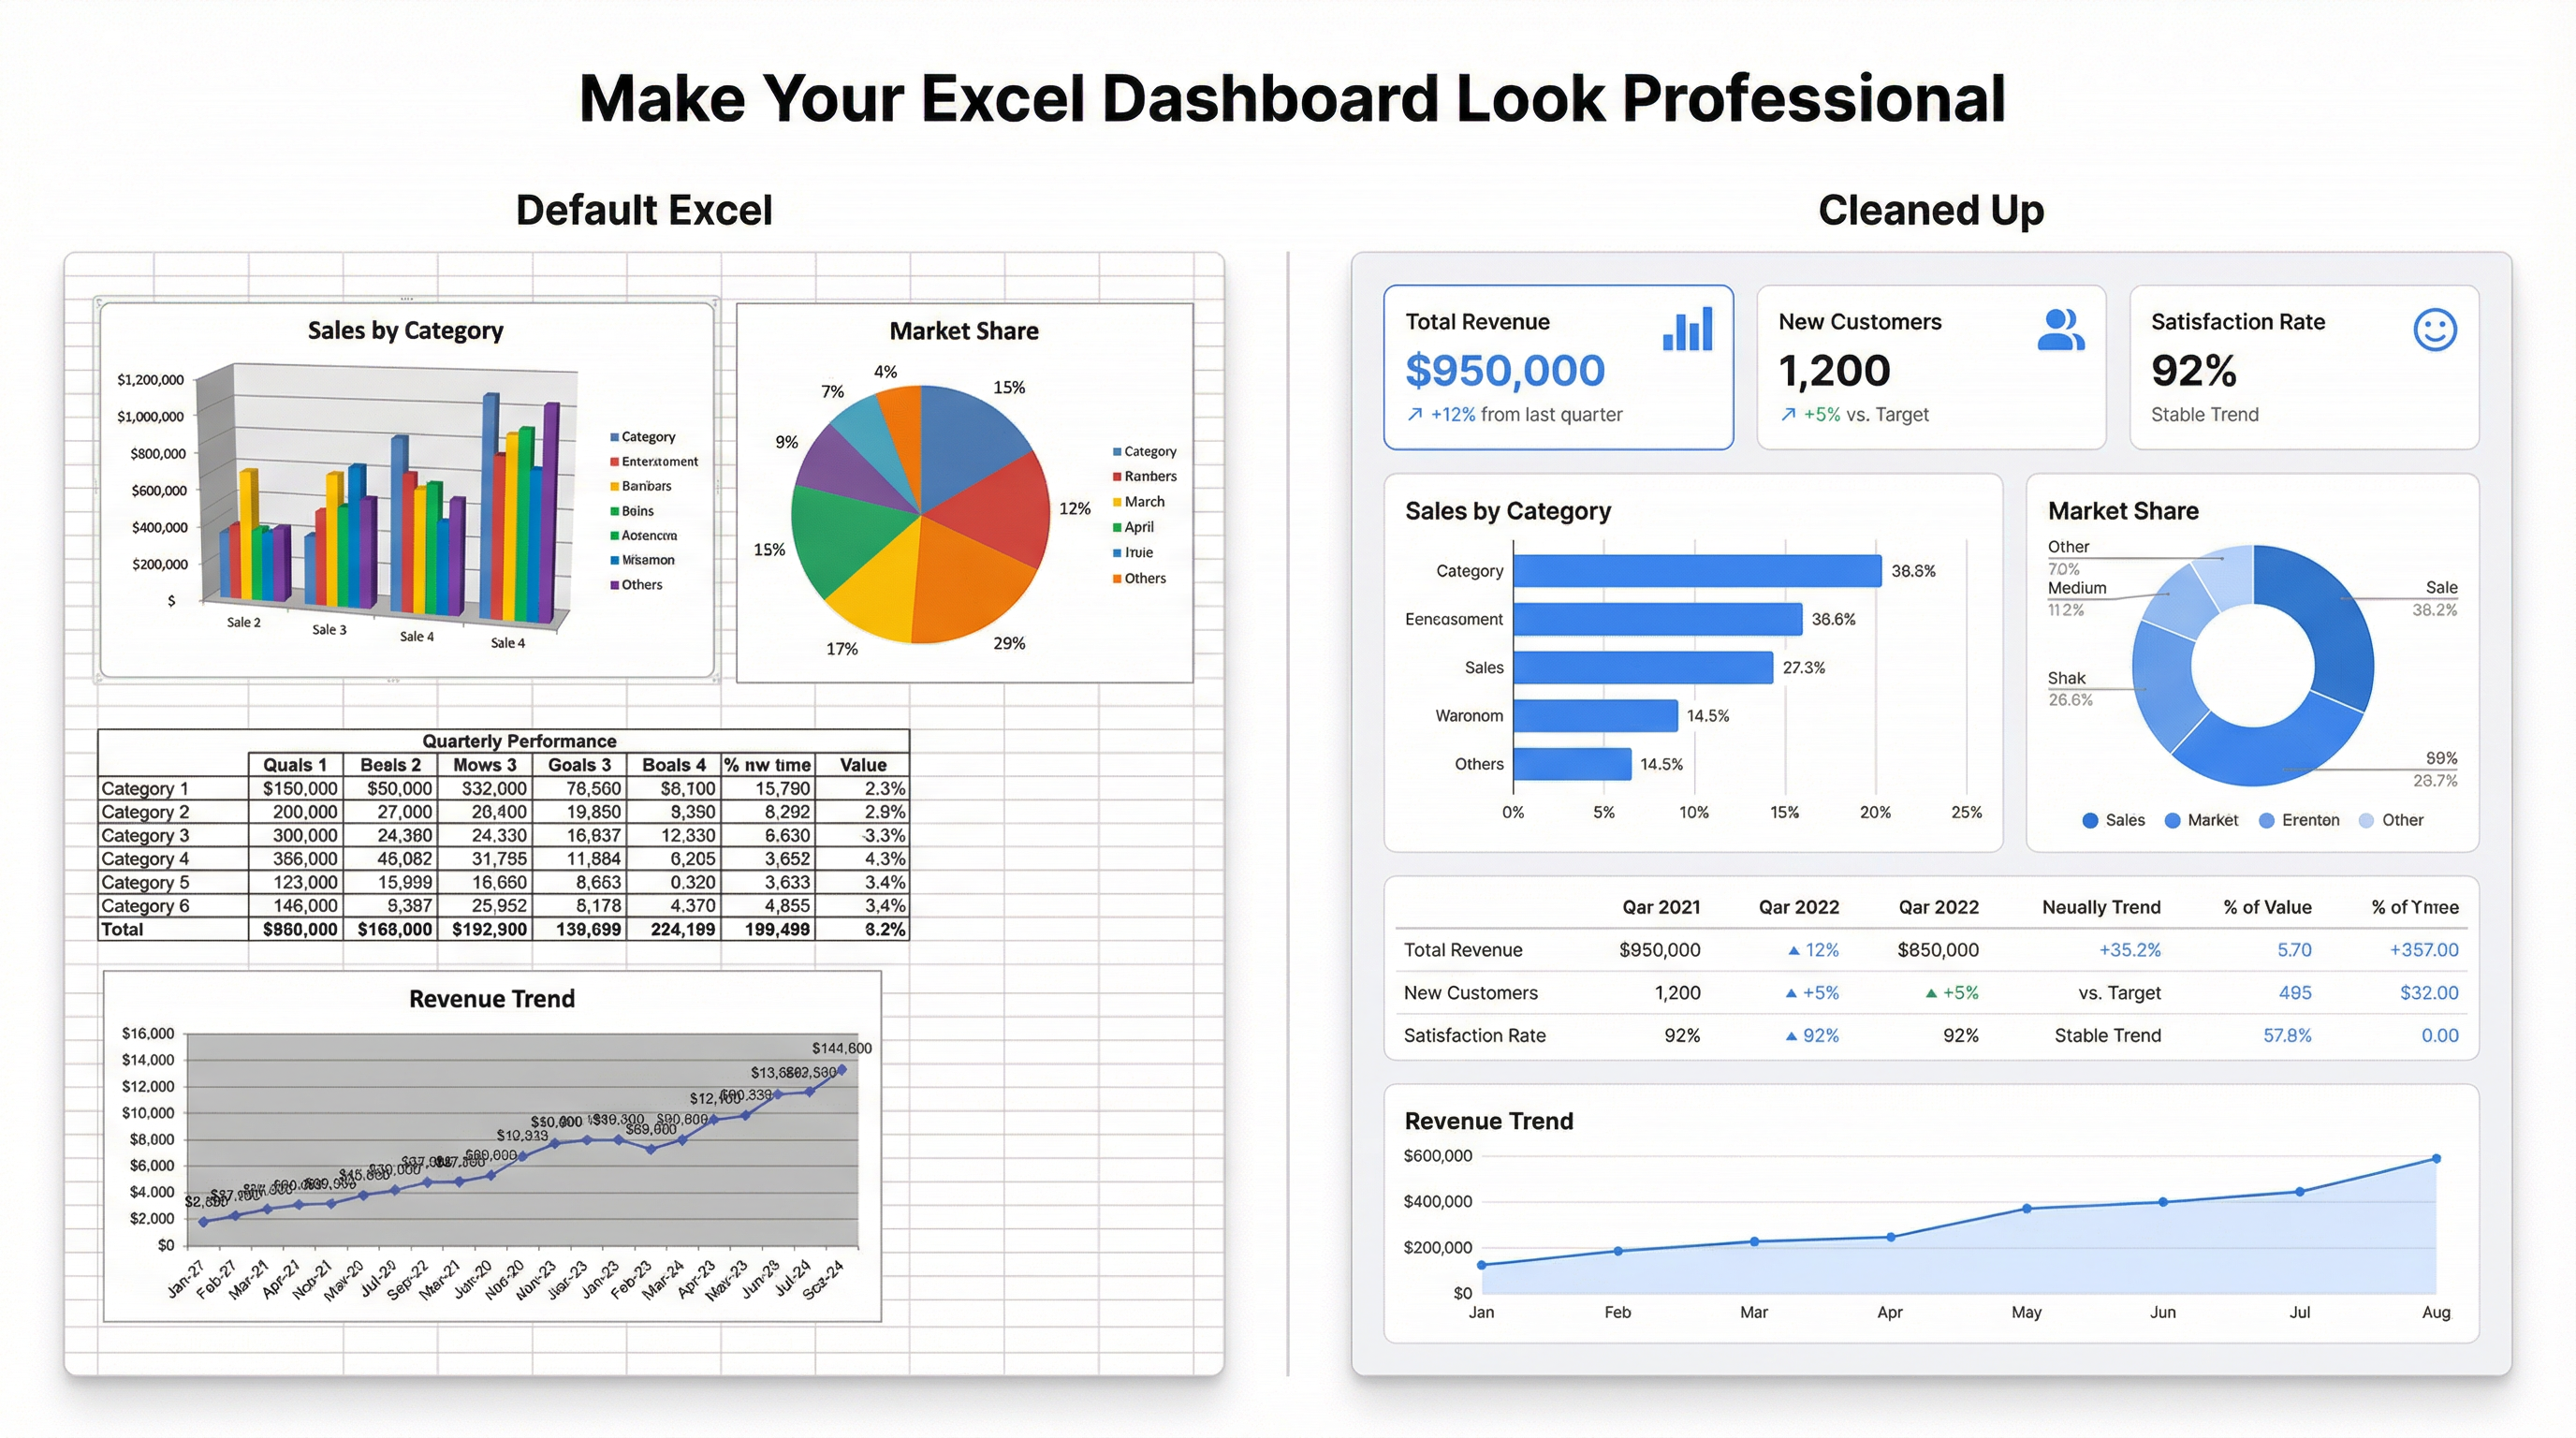
Most Excel dashboards look like spreadsheets. Coloured cell backgrounds doing the work of actual design. Gridlines visible everywhere. Charts with default blue bars and Excel’s grey background, untouched since they were inserted. Text crammed into cells with no breathing room.
You can do better than that. Here’s how — without spending your whole week on it.
Start by Hiding the Grid
Before anything else: View → Gridlines → uncheck. Every Excel dashboard should have its gridlines off. The grid is for data entry. A dashboard is for reading.
While you’re there, hide the row and column headers too (View → Headings). They’re orientation tools for a spreadsheet, not design elements for a report.
You’ll be working on a cleaner canvas immediately.
Use a Consistent Color Palette — With Maximum Two Accent Colors
The default Excel chart palette uses six or seven colours with no visual logic. Swap all of it for two colors: one primary for the main data series, one secondary for comparisons or highlights.
A simple palette that works: #3B82F6 (blue) as your primary, #E4E4E7 (light grey) for background elements and secondary data. That’s it. Two colors, applied consistently everywhere.
For chart backgrounds: set them all to white or transparent, not the Excel default grey. It sounds small. The difference is significant.
Fix Your Charts
Excel’s chart defaults are actively bad design decisions. Fix these for every chart you insert:
- Remove the chart border — right-click the chart, Format Chart Area, Border: No line
- Remove the chart background grey — same place, Fill: No fill or solid white
- Remove unnecessary gridlines — right-click gridlines → Delete
- Simplify the legend — if you only have one data series, delete the legend entirely. If you have multiple, move it below the chart instead of the right side
- Direct labels over tooltips — add data labels directly to the bars or line points where the chart allows. Readers shouldn’t have to hover for basic values
The most common mistake is keeping Excel’s default axis scale, which often starts at some arbitrary minimum rather than zero. Bar charts should almost always start at zero — a bar that appears to show a 50% difference because the Y-axis starts at 80 is misleading.
Build Proper KPI Cards
The default way to show a key metric in Excel is a large number in a big cell. That’s fine, but you can do better.
For each KPI: create a small section with a subtle grey fill (#F4F4F5), rounded-looking border (simulate with a thick white border outside and a light grey inside), the metric value in large bold text, the metric label in smaller grey text below it, and optionally a delta indicator (▲ 12% or ▼ 3%) coloured green or red.
This is just cell formatting and text placement — no special features required. But it looks dramatically more intentional than a raw number floating in a cell.
Nail Your Typography
Excel has no great font options by default, but Calibri and Aptos (formerly Calibri) work fine if you use them consistently. The fix is hierarchy:
- Dashboard title: 18-22pt, bold
- Section headers: 12-14pt, bold
- Metric values: 24-32pt, bold
- Labels and supporting text: 10-11pt, normal weight, grey (
#71717A)
Never use font sizes smaller than 10pt on a dashboard. If you’re running out of space, the problem is information density, not font size.
Control Your Layout with Named Rows and Columns
Excel dashboards break when people resize columns to fit data. Instead: use a fixed column grid where some columns are narrow spacers (width 1-2) and real content columns have defined widths. Hide the spacer columns from the print view.
The goal is predictable spacing. A KPI row at the top, a main chart section in the middle, supporting charts below. Once you have a consistent layout, new charts and metrics have an obvious place to go.
When to Stop Trying
Here’s the honest part: there’s a ceiling on what Excel dashboards can look like, and it’s lower than most people want to admit.
You can spend three more hours on formatting and font choices. But you’ll still have a dashboard that requires manual data exports to stay current, breaks when someone changes a column name, and looks like Excel no matter how much you polish it.
If you’re building dashboards for internal use — a weekly review, a personal tracking sheet — the tips above will take you a long way. If you’re building something you want to share with clients, board members, or external stakeholders, you’re fighting the wrong tool.
AI-powered dashboard tools like Infograph build cleaner-looking dashboards from your data without any of the formatting work. Upload your Excel file, describe what you want to see, and the result already looks intentional. Live-connected to your data, shareable with a link, no manual updates required.
The time you’d spend polishing an Excel dashboard is better spent on the decisions the dashboard is supposed to help you make.
Try Infograph free — or keep reading your formatting guides. Both are valid choices.