GA4 is genuinely useful. It’s also genuinely annoying to read. The reports are buried under menus, the default views rarely show what you actually care about, and sharing data with a non-analyst means walking them through where to click every single time.
A Google Analytics dashboard fixes this — not by adding more data, but by surfacing the right data in a format your whole team can actually read.
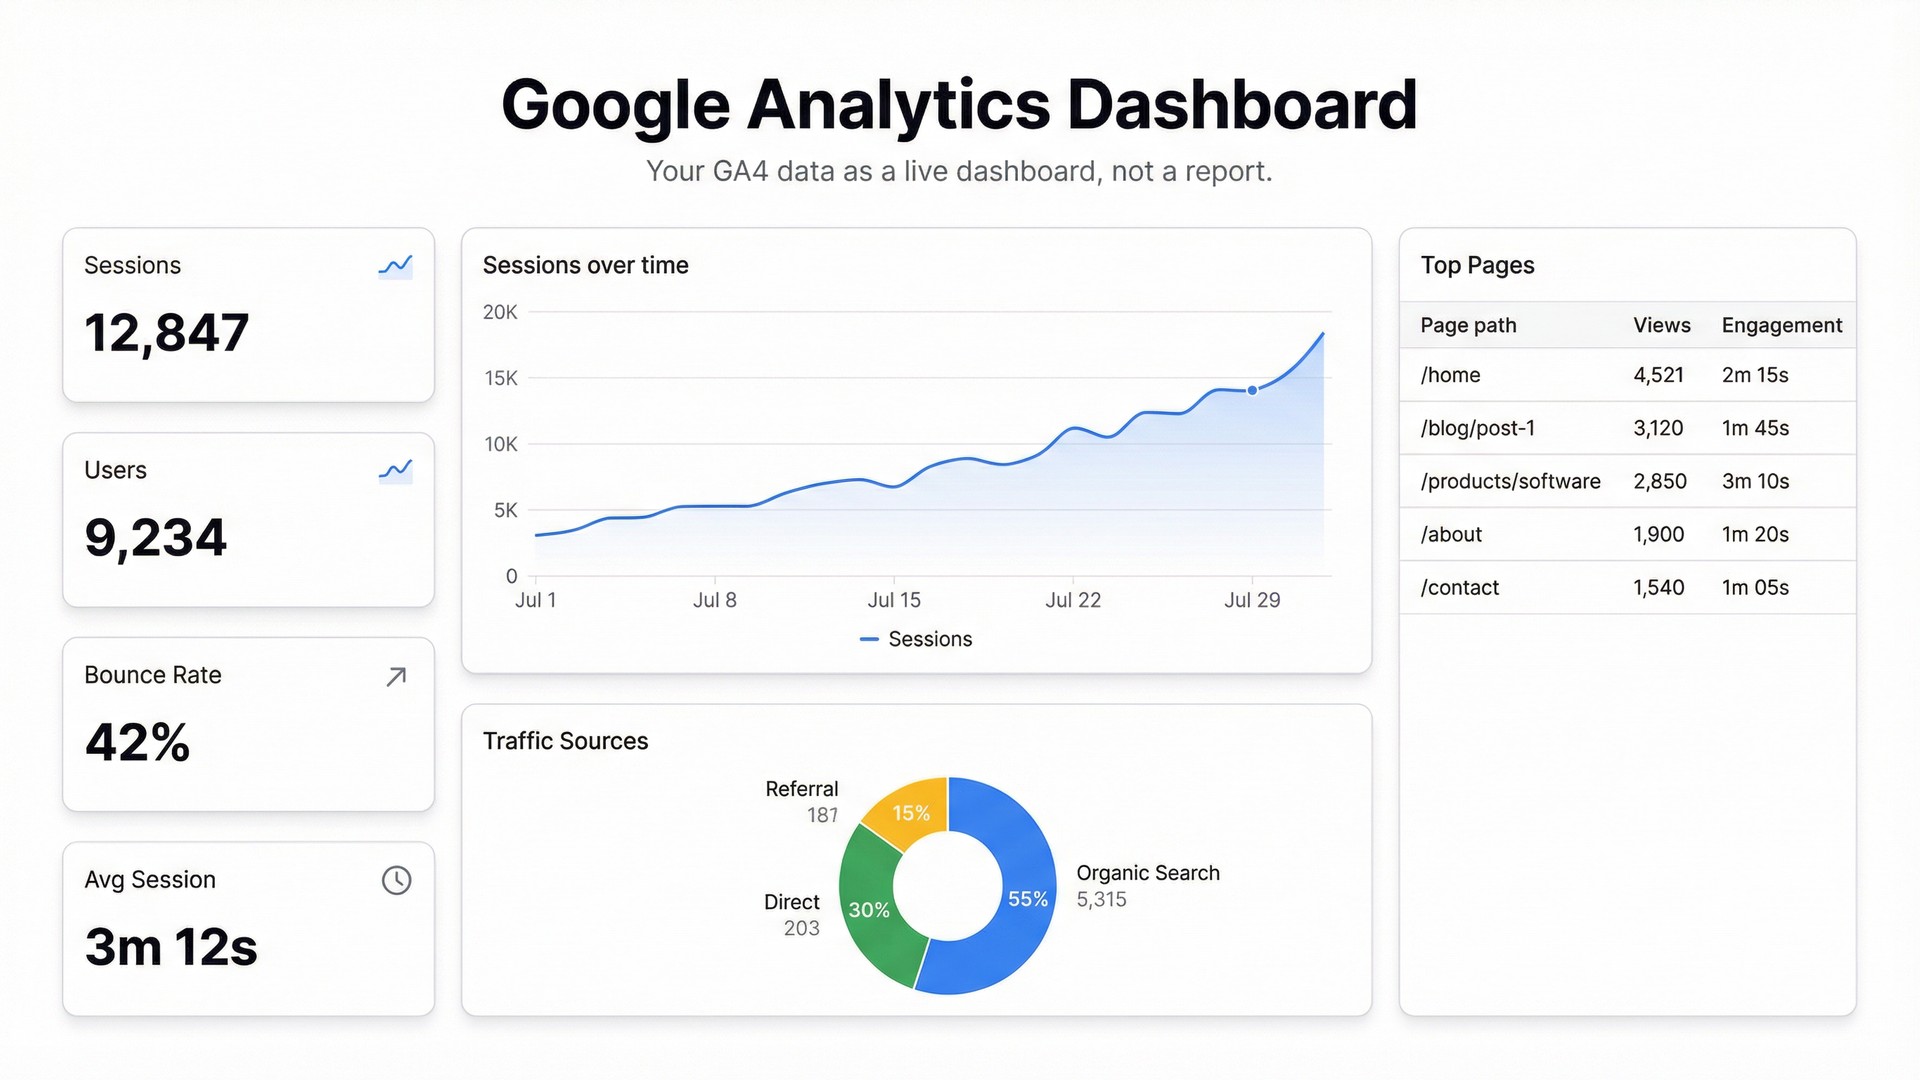
What a Good GA4 Dashboard Shows
The default GA4 interface shows everything. That’s the problem. A dashboard should show the metrics that matter for your specific goals, arranged so you can make a decision in 30 seconds.
For most teams, a useful Google Analytics reporting dashboard covers:
- Traffic trends — daily/weekly sessions, with enough history to see direction
- Top channels — where traffic is coming from (organic, direct, paid, referral)
- Top pages — which content is driving visits and engagement
- Conversion funnel — where users drop off before completing your goal
- Audience — device split, geography, new vs returning
That’s five questions. Your dashboard answers all five at a glance, without clicking into five separate GA4 reports.
Building a GA4 Dashboard in Infograph
Infograph doesn’t connect directly to GA4 yet — the cleanest path right now is exporting your GA4 data to Google Sheets and connecting that.
Here’s the workflow.
Step 1: Export GA4 Data to Google Sheets
Google Analytics has a built-in Sheets export. In GA4, go to any report, click the Share button at the top right, and choose “Export to Google Sheets.” This creates a Google Sheet with your current report data.
For a fuller export — multiple metrics, date ranges, custom dimensions — the Google Analytics add-on for Sheets is the better option. Install it from the Google Workspace Marketplace, then build scheduled reports that automatically refresh on a schedule you set. Daily refresh means your dashboard always shows current data without manual intervention.
The Sheets add-on lets you pull exactly the metrics you want: sessions by channel, page views by URL, conversion events by date. One sheet per report type, all in the same workbook.
Step 2: Connect to Infograph
Sign in to Infograph and create a new dashboard. Choose “Connect data source” and add your Google account. Select the Google Sheet containing your GA4 export.
If you’re using the Sheets add-on with scheduled refreshes, your Infograph dashboard will reflect updated GA4 data automatically. The sheet updates, the dashboard updates. No manual exports.
Step 3: Describe Your Dashboard
Type what you want to see:
“Show weekly sessions as a line chart for the past 90 days. Add a bar chart breaking down sessions by channel. Include a table of the top 20 pages by views this month.”
Infograph reads your column headers — the ones GA4 created when you exported — and builds the charts. You don’t need to map anything manually.
For a conversion funnel, export your key event counts and describe:
“Show a funnel chart: page views → product views → add to cart → purchase. Display the drop-off percentage at each step.”
This is the part that took half a day to build in Looker Studio. Here it takes one prompt.
Step 4: Share With Your Team
Publish the dashboard and send the link. Your marketing team, your product manager, your founder — they can all see what’s happening without needing GA4 access or training.
Lock it behind a password for client reporting, or keep it internal with team-only access. Either way, the link replaces the “can you pull the analytics numbers?” Slack message.
What Teams Actually Use This For
Weekly traffic reviews. The whole team checks the same dashboard before the Monday standup. No one’s pulling numbers from different places and getting different answers.
Client reporting. Agencies use GA4 dashboards to show clients what’s working without giving them full GA4 access. A clean dashboard with branded colors is a better deliverable than a CSV export.
SEO tracking. Organic search is one channel in GA4. A dedicated dashboard focused on organic traffic — sessions, top landing pages, keyword-driven content performance — is more useful than the default acquisition report for anyone doing SEO work.
Content performance. Which blog posts are driving the most traffic? Which pages have high bounce rates? A page-level view sorted by sessions answers this in seconds. The GA4 “Pages and screens” report also answers it, but your content team probably doesn’t know where to find it.
The Free Tier
Infograph’s free plan includes one dashboard and 500 AI credits — no credit card required. That’s enough to build a Google Analytics dashboard and see whether it’s worth making permanent.
The Pro plan ($19.99/month) adds live Google Sheets connections, five dashboards, and access to the latest AI models. For a team that checks analytics weekly, that’s a reasonable trade for eliminating the manual reporting cycle.


