Revenue is the number everyone checks first. And somehow, it’s still the hardest number to actually see clearly.
You’ve got transactions in Stripe, subscriptions in your billing system, channel data spread across spreadsheets, and a finance model someone built eighteen months ago that may or may not be accurate. Every Monday someone asks “what’s our MRR?” and the answer takes fifteen minutes to produce.
A revenue dashboard fixes that. Not someday — this afternoon.
What a revenue dashboard actually needs to show
Before you build anything, get clear on what the dashboard is for. Most revenue dashboards fail because they try to show everything. The useful ones answer a tight set of questions:
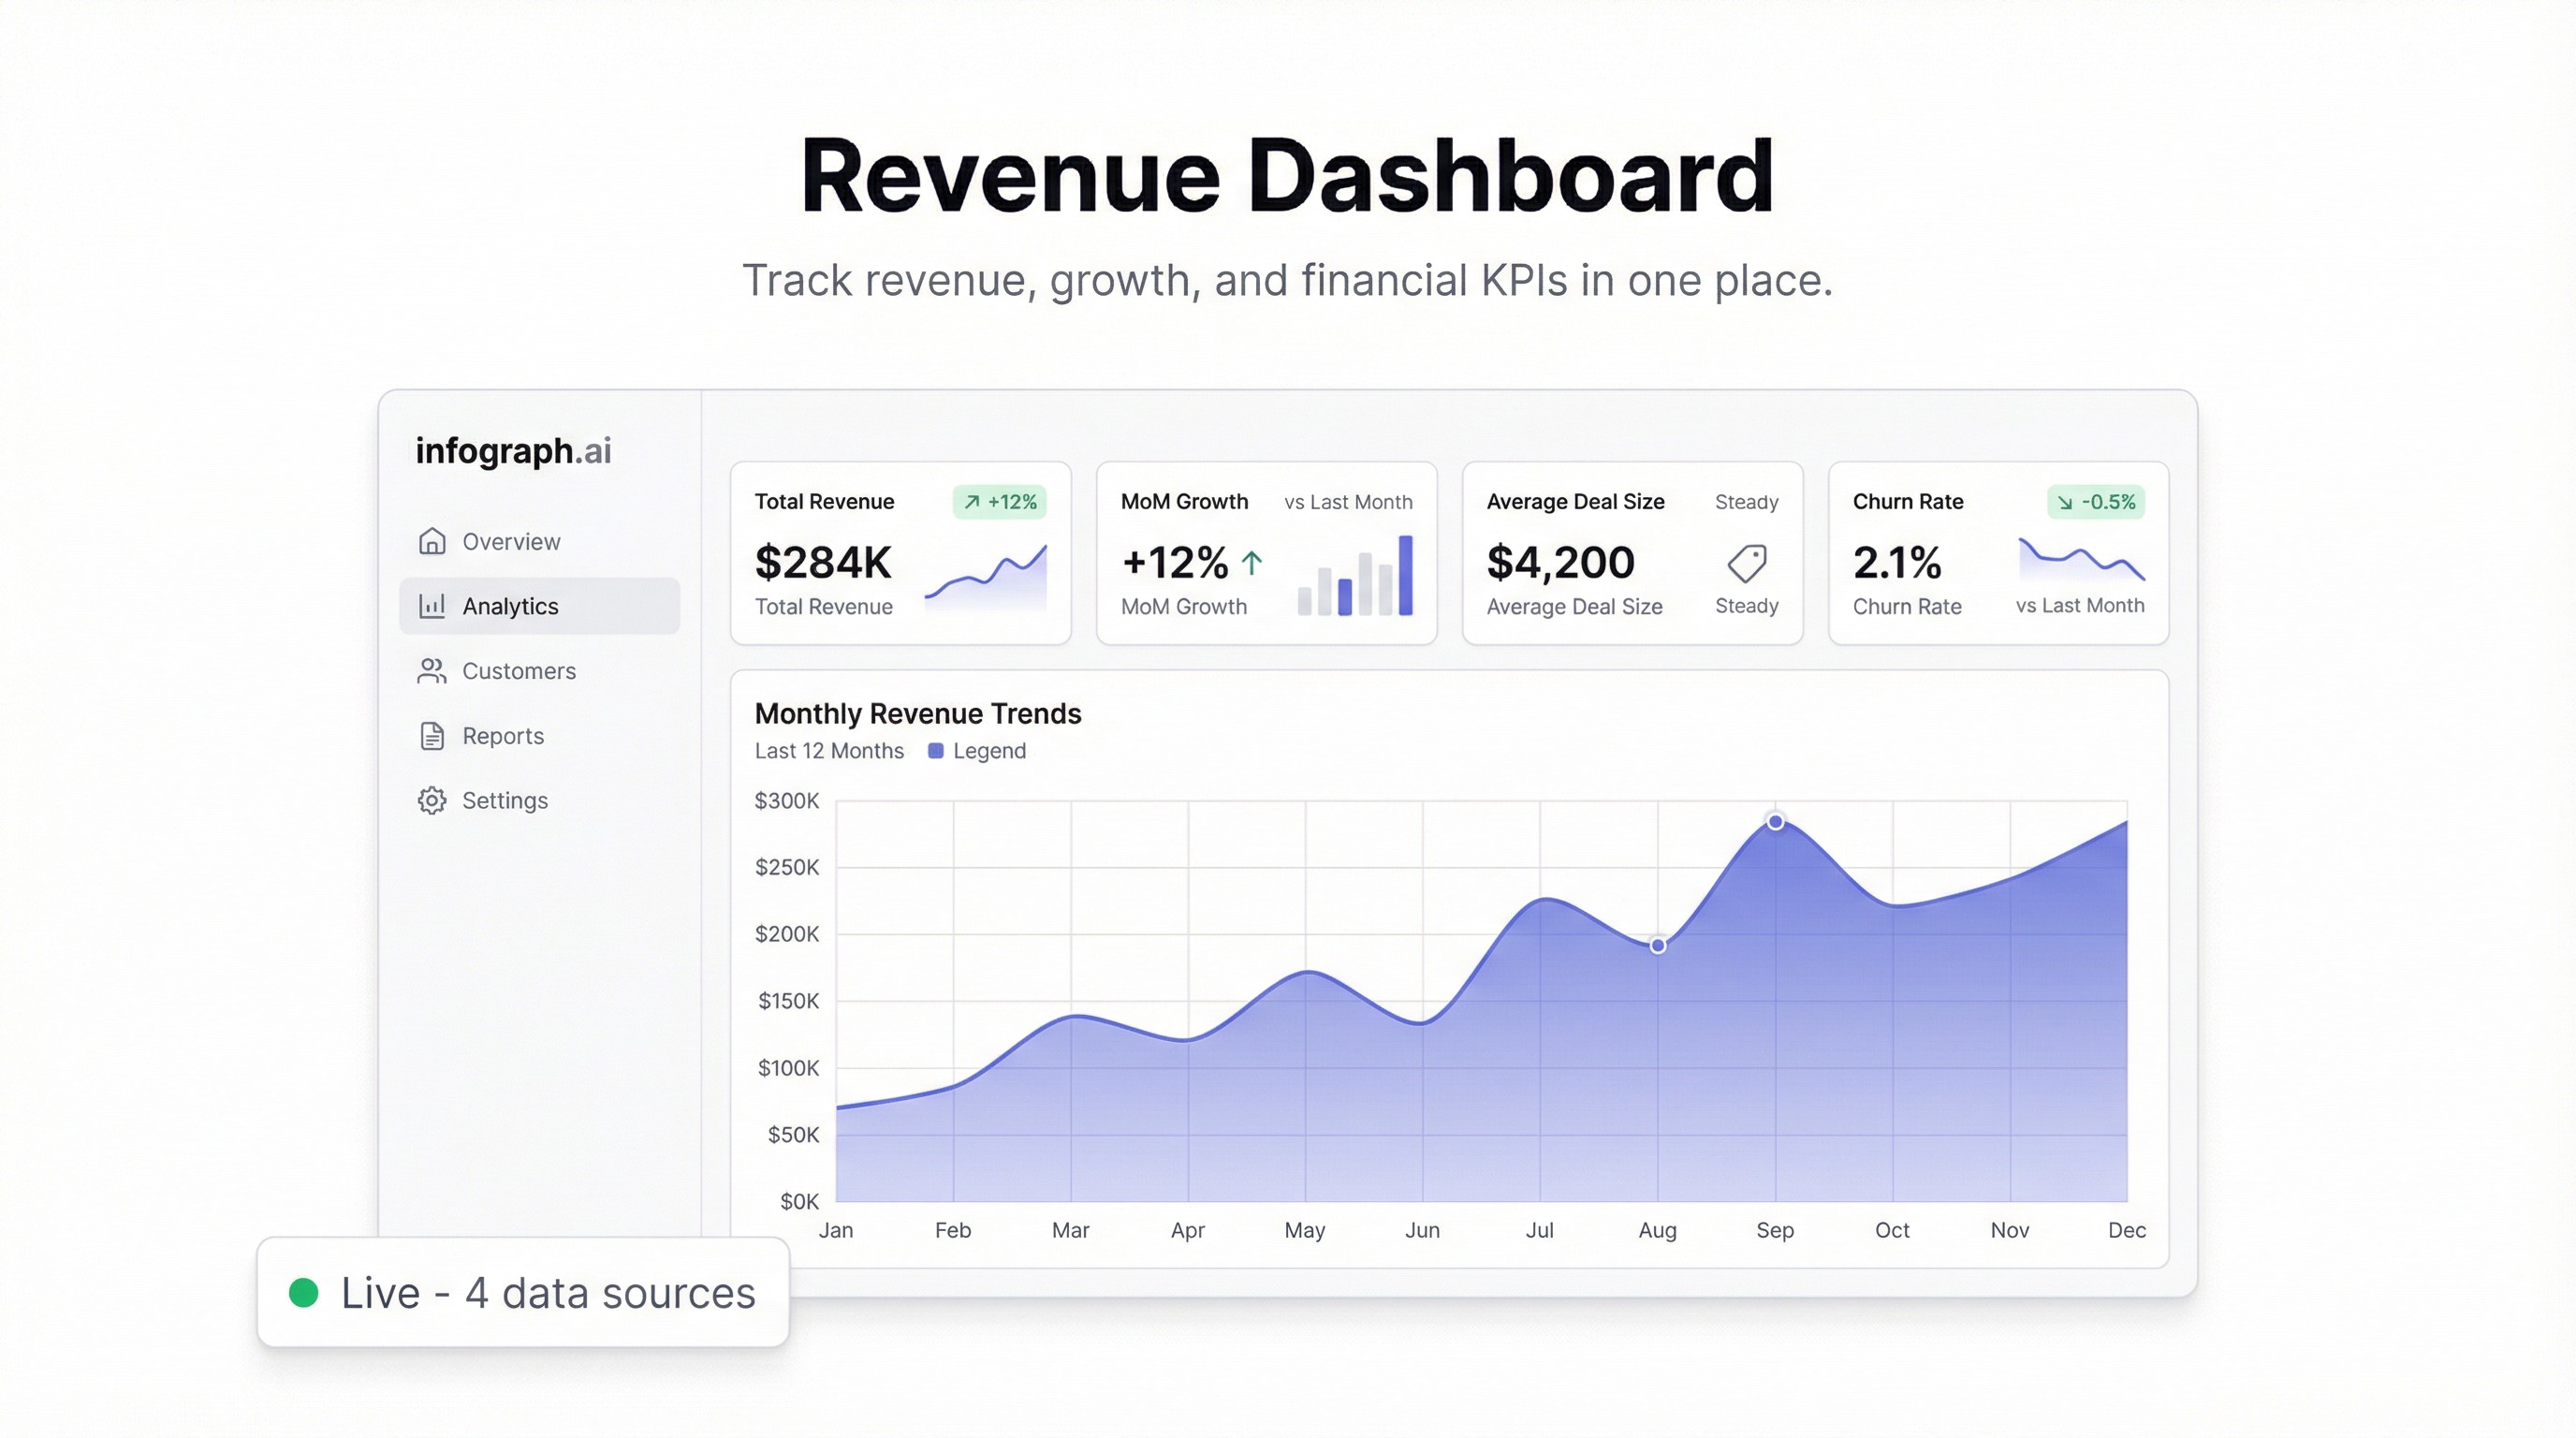
- What’s our MRR right now, and how does it compare to last month?
- Where is revenue coming from? (plan tier, channel, product line)
- What’s the growth rate, and is it accelerating or decelerating?
- What’s ARR trending toward? (MRR × 12 is a start, but cohort-based projections are better)
- What’s the churn picture? (new revenue vs. lost revenue)
If your dashboard answers those five questions at a glance, it’s doing its job.
Setting up your data in Google Sheets
The fastest path to a live revenue dashboard is a Google Sheet that you already maintain — or one you build specifically to feed the dashboard.
A clean revenue sheet has a few key columns:
- Date — the period (month, week, or day depending on how you track)
- MRR — total monthly recurring revenue for that period
- New MRR — revenue from new customers
- Churned MRR — revenue lost to cancellations
- Expansion MRR — revenue from upgrades
- Channel or Plan — a dimension to break down by
If you’re exporting from Stripe, Chargebee, or any billing tool, you can usually download a CSV that maps to these columns with minor cleanup. Paste it into a sheet, keep it updated, and your dashboard stays live.
Building the dashboard in Infograph
Connect your Google Sheet in Infograph and describe what you want:
“Show MRR over time as a line chart. Add a KPI card for current MRR and month-over-month growth. Break down revenue by plan tier as a bar chart. Show ARR as MRR × 12.”
That’s it. Infograph reads your data, understands the columns, and builds the charts.
What used to take a BI analyst three days — defining metrics, writing SQL, setting up chart configs — happens in seconds. The first time you see your revenue laid out cleanly in a dashboard you built from a prompt, it genuinely surprises you.
The metrics that matter most
MRR is your pulse check. But raw MRR hides important signal. Break it into components:
- New MRR shows acquisition health
- Churned MRR shows retention health
- Expansion MRR shows whether existing customers are finding more value
When new MRR > churned MRR + expansion MRR, you’re growing. When that relationship flips, you have a problem worth catching early.
Growth rate is more important than the absolute number at most stages. A company at $10K MRR growing 15% month-over-month is healthier than one at $100K growing 1%. Track it as a trend line, not just a point-in-time.
Revenue by channel matters the moment you have more than one source. If 80% of your revenue comes from one channel and that channel starts to underperform, you want to know before it shows up in total MRR.
Keeping it live
The point of connecting Google Sheets (rather than uploading a CSV once) is that the dashboard updates automatically when your data changes. Update the sheet at the end of each month — or weekly if you track at that cadence — and the charts reflect it instantly.
No re-uploading. No rebuilding. The dashboard you shared with your team still works, still shows the right numbers.
What to share and with whom
A revenue dashboard is typically shared with:
- The founding team / exec team — weekly or always-on
- Investors — monthly, often as a snapshot
- Finance — live access to the source sheet + dashboard
Infograph lets you share with password protection, team-only access, or publicly. For investor updates, snapshot mode is useful — it captures the state at reporting time and doesn’t change when your data does.
The alternative
Before you build this in Infograph, consider the alternative: you could wire up Stripe to a Redshift instance, build a dbt model for revenue, set up a Metabase dashboard, and maintain all of it. That takes weeks, needs ongoing engineering support, and still produces a dashboard that needs someone to explain it.
Or you can upload a CSV, describe what you want, and be looking at your revenue in five minutes.
The numbers don’t get better or worse based on how you look at them. But the decisions you make about them definitely depend on how clearly you can see them.
Build the dashboard.


