Every Monday morning, someone on your team spends two hours pulling numbers from three different spreadsheets, pasting them into a PowerPoint, formatting a table that broke when they changed the font size, and exporting a PDF that will be opened by four people and actually read by zero.
This is the report. This is the process. And it is a complete waste of time.
Not because reporting doesn’t matter — it does. But because the way most teams build reports has nothing to do with insight and everything to do with busywork. Manual data pulls. Stale screenshots. Formatting hell. A PDF attached to a Slack message that nobody clicks.
An AI report generator changes this. Not by automating the same broken process, but by replacing it entirely.
What People Think an AI Report Generator Does
Most people imagine an AI report generator as a smarter export button. You dump your data in, and out comes a nicer-looking PDF. Maybe the AI picks a chart type for you or writes a one-line summary at the top.
That’s not what a good AI report generator does. That’s just automation layered on top of a process that was already broken.
The real shift is from static documents to live dashboards. From something you build once and send to something that updates automatically and anyone can explore on their own.
Why Static Reports Are the Wrong Format
PDFs and PowerPoints are presentation tools. They’re designed for a moment in time — a meeting, a handoff, a checkpoint. The second you export one, it starts going stale. The numbers you pulled on Thursday are wrong by Friday. The chart that looked great in the deck is useless when someone asks “what happened in Q1 last year?”
Static reports also do something insidious: they flatten data. You take a living dataset with thousands of rows and squeeze it into five bullet points and a bar chart. The nuance disappears. The questions that come up in the meeting — “can we break this down by region?” “what does this look like month-over-month?” — can’t be answered without going back to the spreadsheet.
Nobody who receives a PDF report is actually getting what they need. They’re getting what fit on a slide.
What Infograph Does Instead
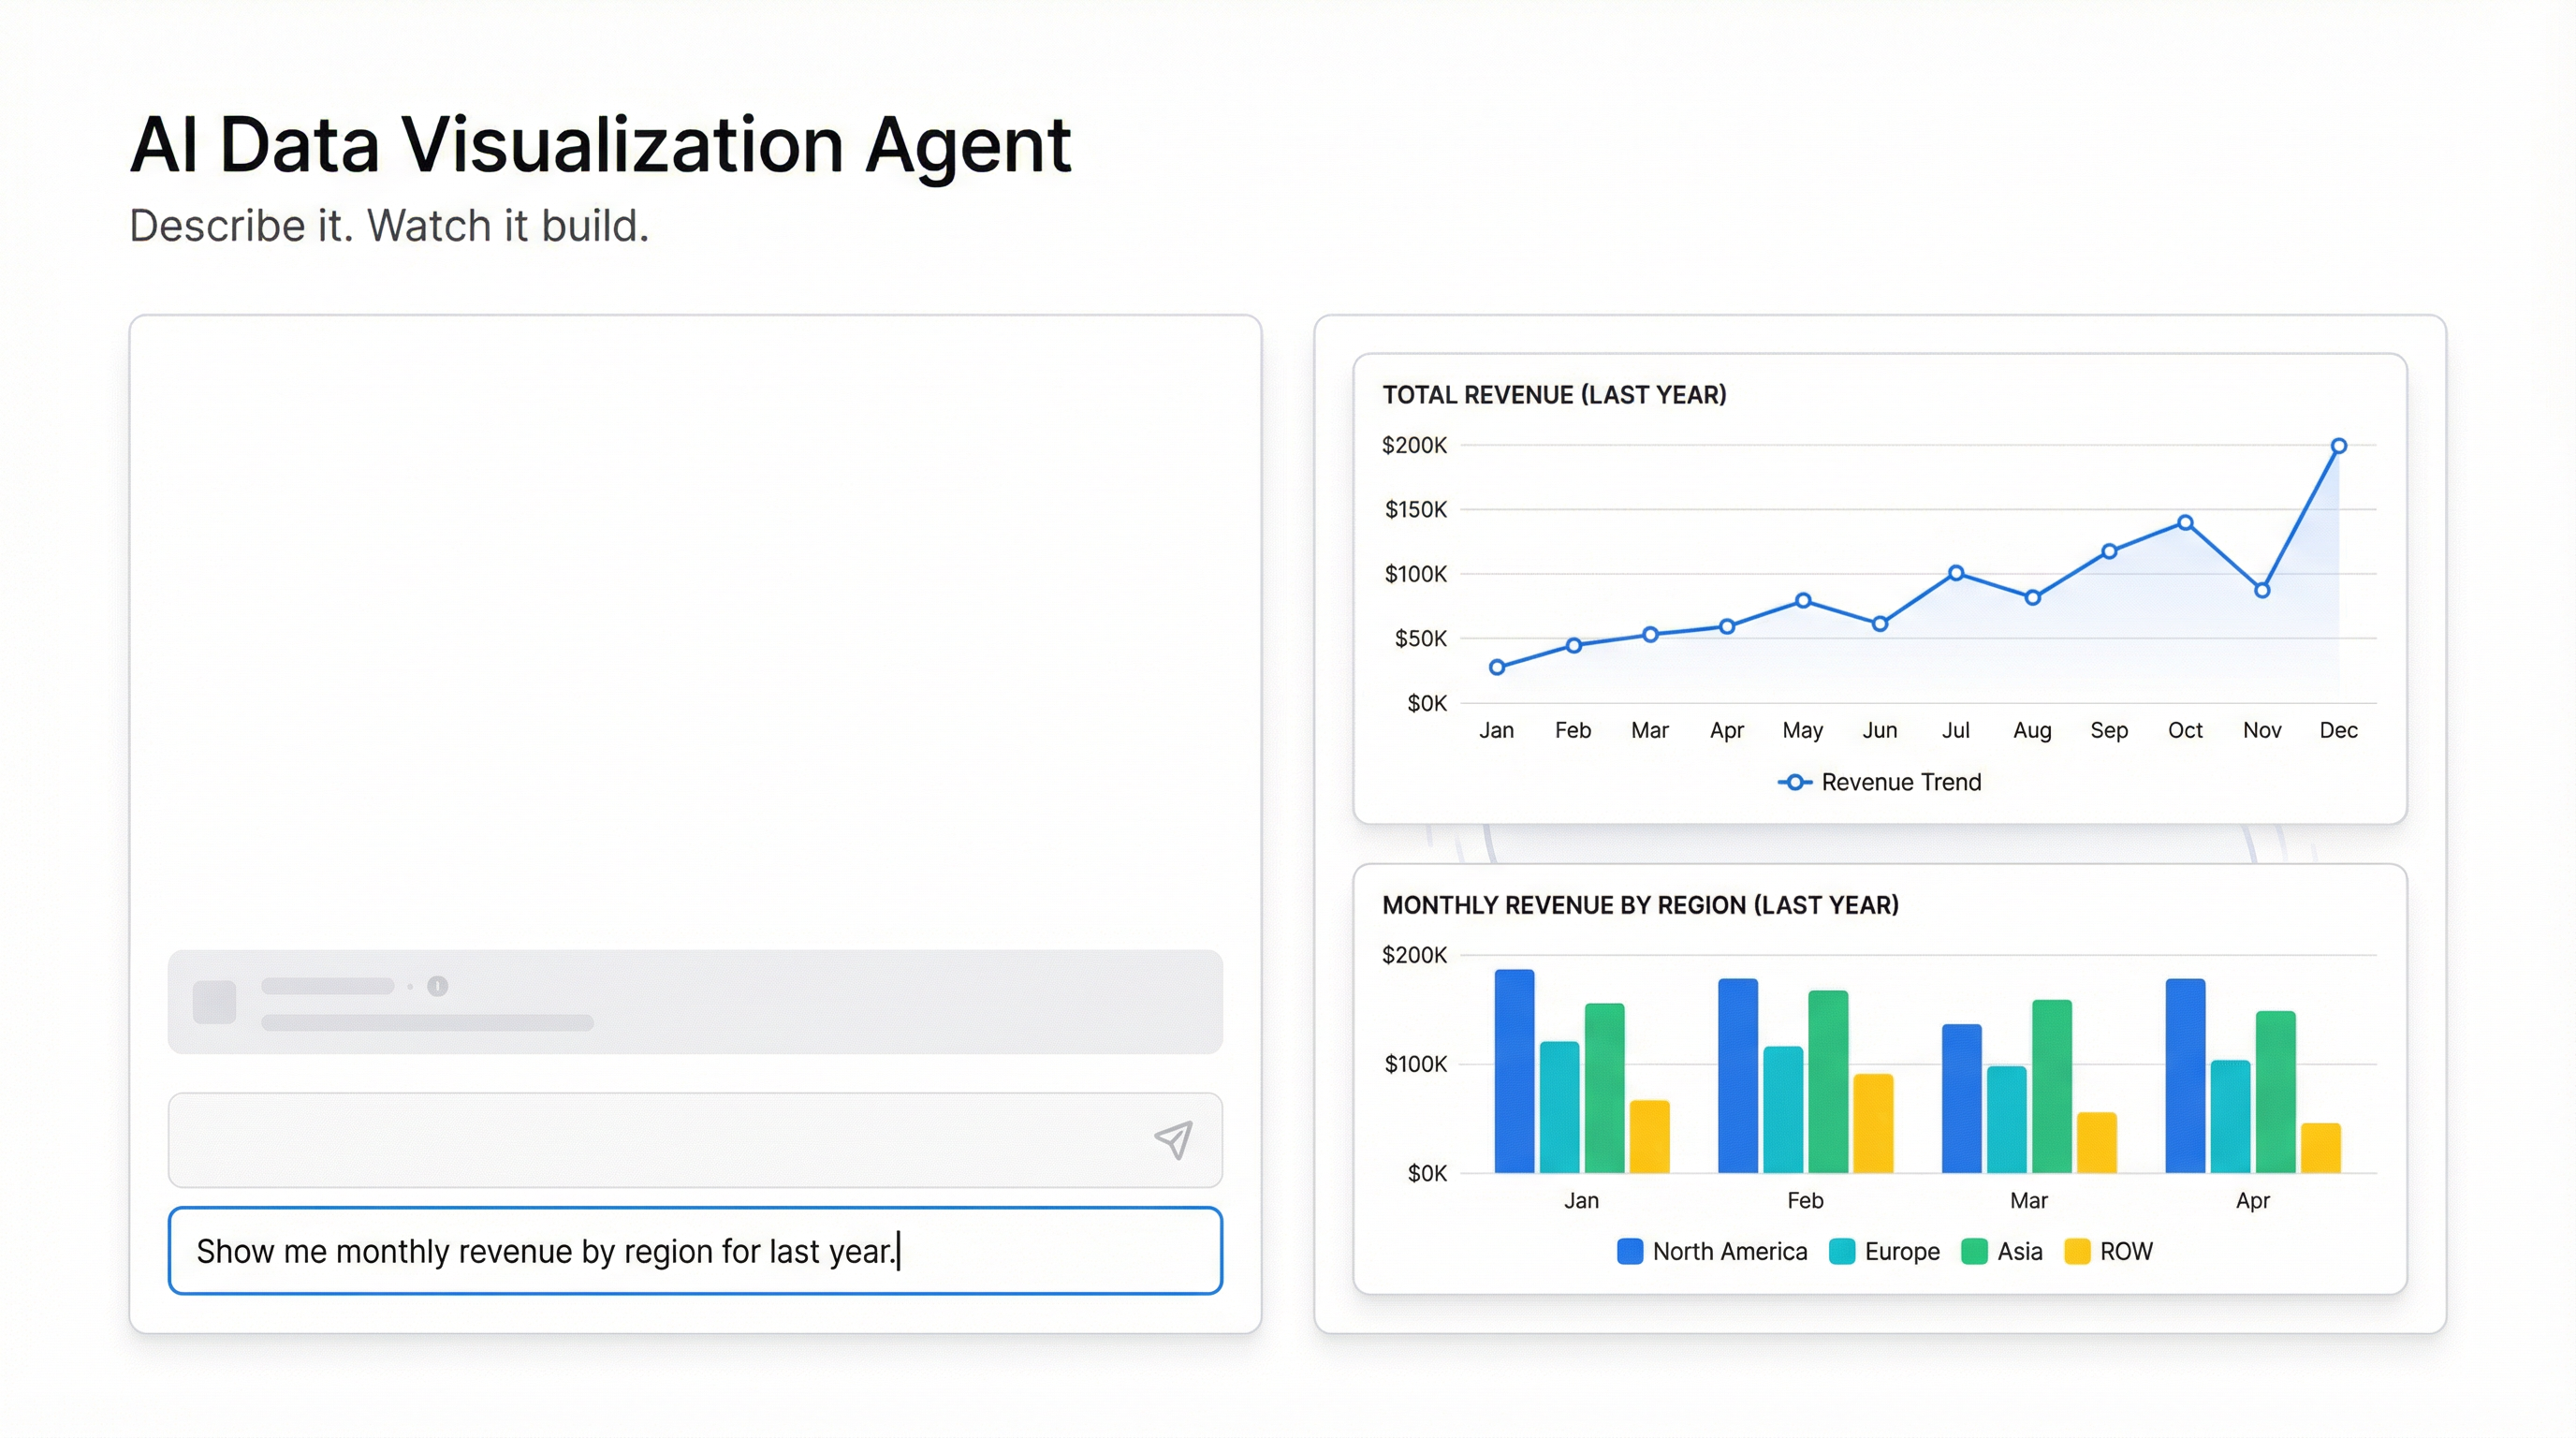
Infograph is an AI report generator built around interactive dashboards. The core mechanic is simple: you describe the report you want in plain language, connect your data, and the AI builds it.
Not a PDF. A dashboard — live, explorable, and always current.
Here’s what that looks like in practice:
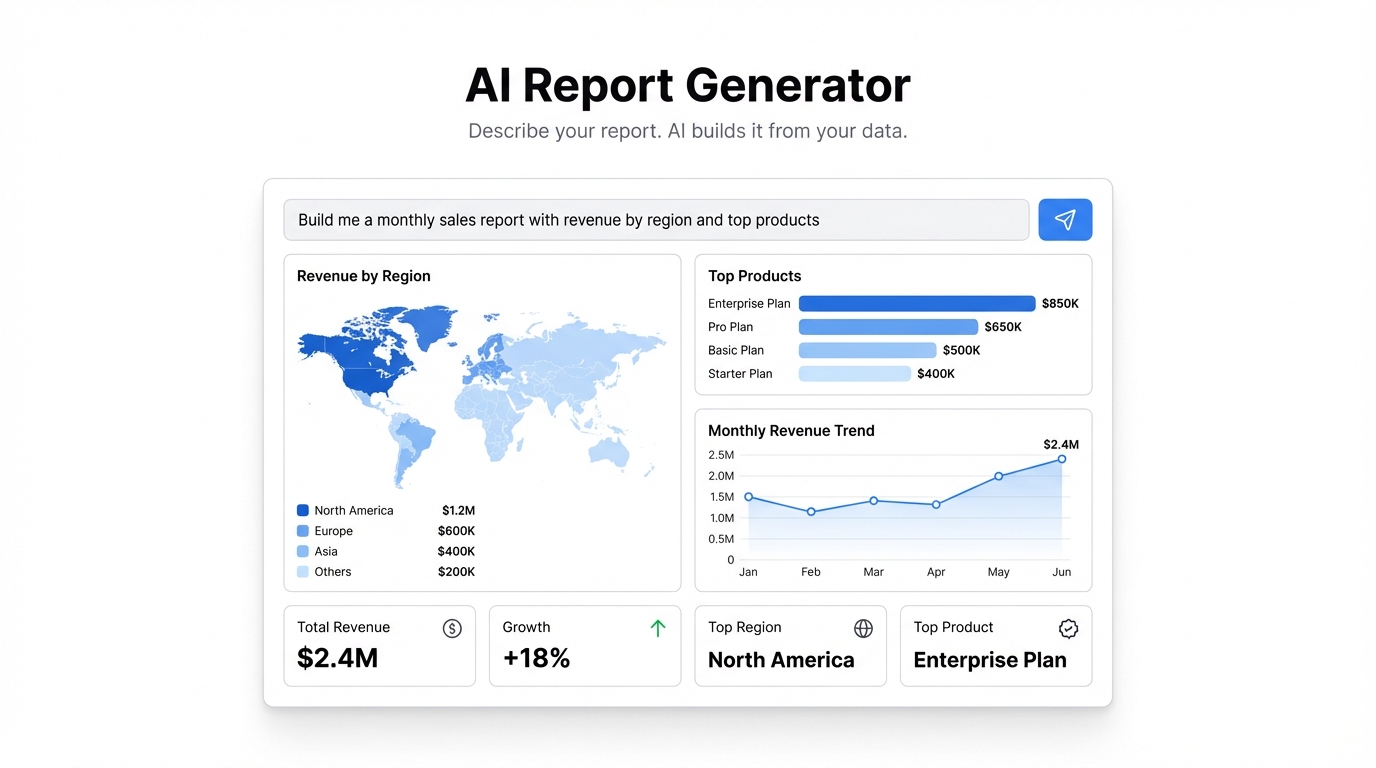
You type: “Build me a monthly sales report with revenue by region, top products by units sold, and a trend line showing MRR over the last 12 months.”
Infograph reads your data — whether that’s a CSV, an Excel file, or a live Google Sheet — and generates the report: a map chart showing revenue by region, a bar chart for top products, a line chart for MRR, and KPI cards at the top showing the numbers that matter. The whole thing takes seconds.
No formula writing. No chart formatting. No pivot table archaeology.
Live Data: Reports That Update Themselves
The version of this that actually changes how teams work is the live data connection.
Connect your Google Sheet or Excel Online file to Infograph, and your dashboard pulls from it directly. When your data changes — when the sales team logs new deals, when marketing updates the campaign spend, when operations closes out the month — your report updates automatically.
You build the report once. After that, it just works.
This is the real difference between an AI report generator and a document tool. Documents require maintenance. A live dashboard doesn’t. The Monday morning report that used to take two hours now takes zero, because it was already done before anyone got to their desk.
Three Reports Teams Actually Use This For
Weekly Sales Report
Connect your CRM export or Google Sheet. Ask for revenue by rep, pipeline by stage, deals closed this week vs last week, and a running total against monthly target. Share the link with the team. Everyone sees the same numbers, in real time, without anyone having to send anything.
Monthly Marketing Report
Pull in your campaign data — spend, impressions, clicks, conversions. Ask Infograph to show cost per acquisition by channel, total spend vs budget, and conversion rate trends over the last 90 days. Instead of a deck that takes an afternoon to build, you have a dashboard that’s ready whenever someone asks.
KPI Summary Dashboard
This is the one that gets the most use. A single dashboard showing your core business metrics — MRR, churn, active users, NPS, whatever matters to your business — connected to the spreadsheets or exports your team already maintains. Update the source data, and the dashboard reflects it immediately. Pin it to your team’s homepage. Stop sending weekly updates that nobody reads.
Sharing Without the Friction
Building a report is only half the problem. Getting it in front of the right people is the other half.
With a static PDF, your options are: email attachment, Slack message, or uploading to a shared drive that nobody has bookmarked. Every option involves someone tracking down a file, and none of them stay current.
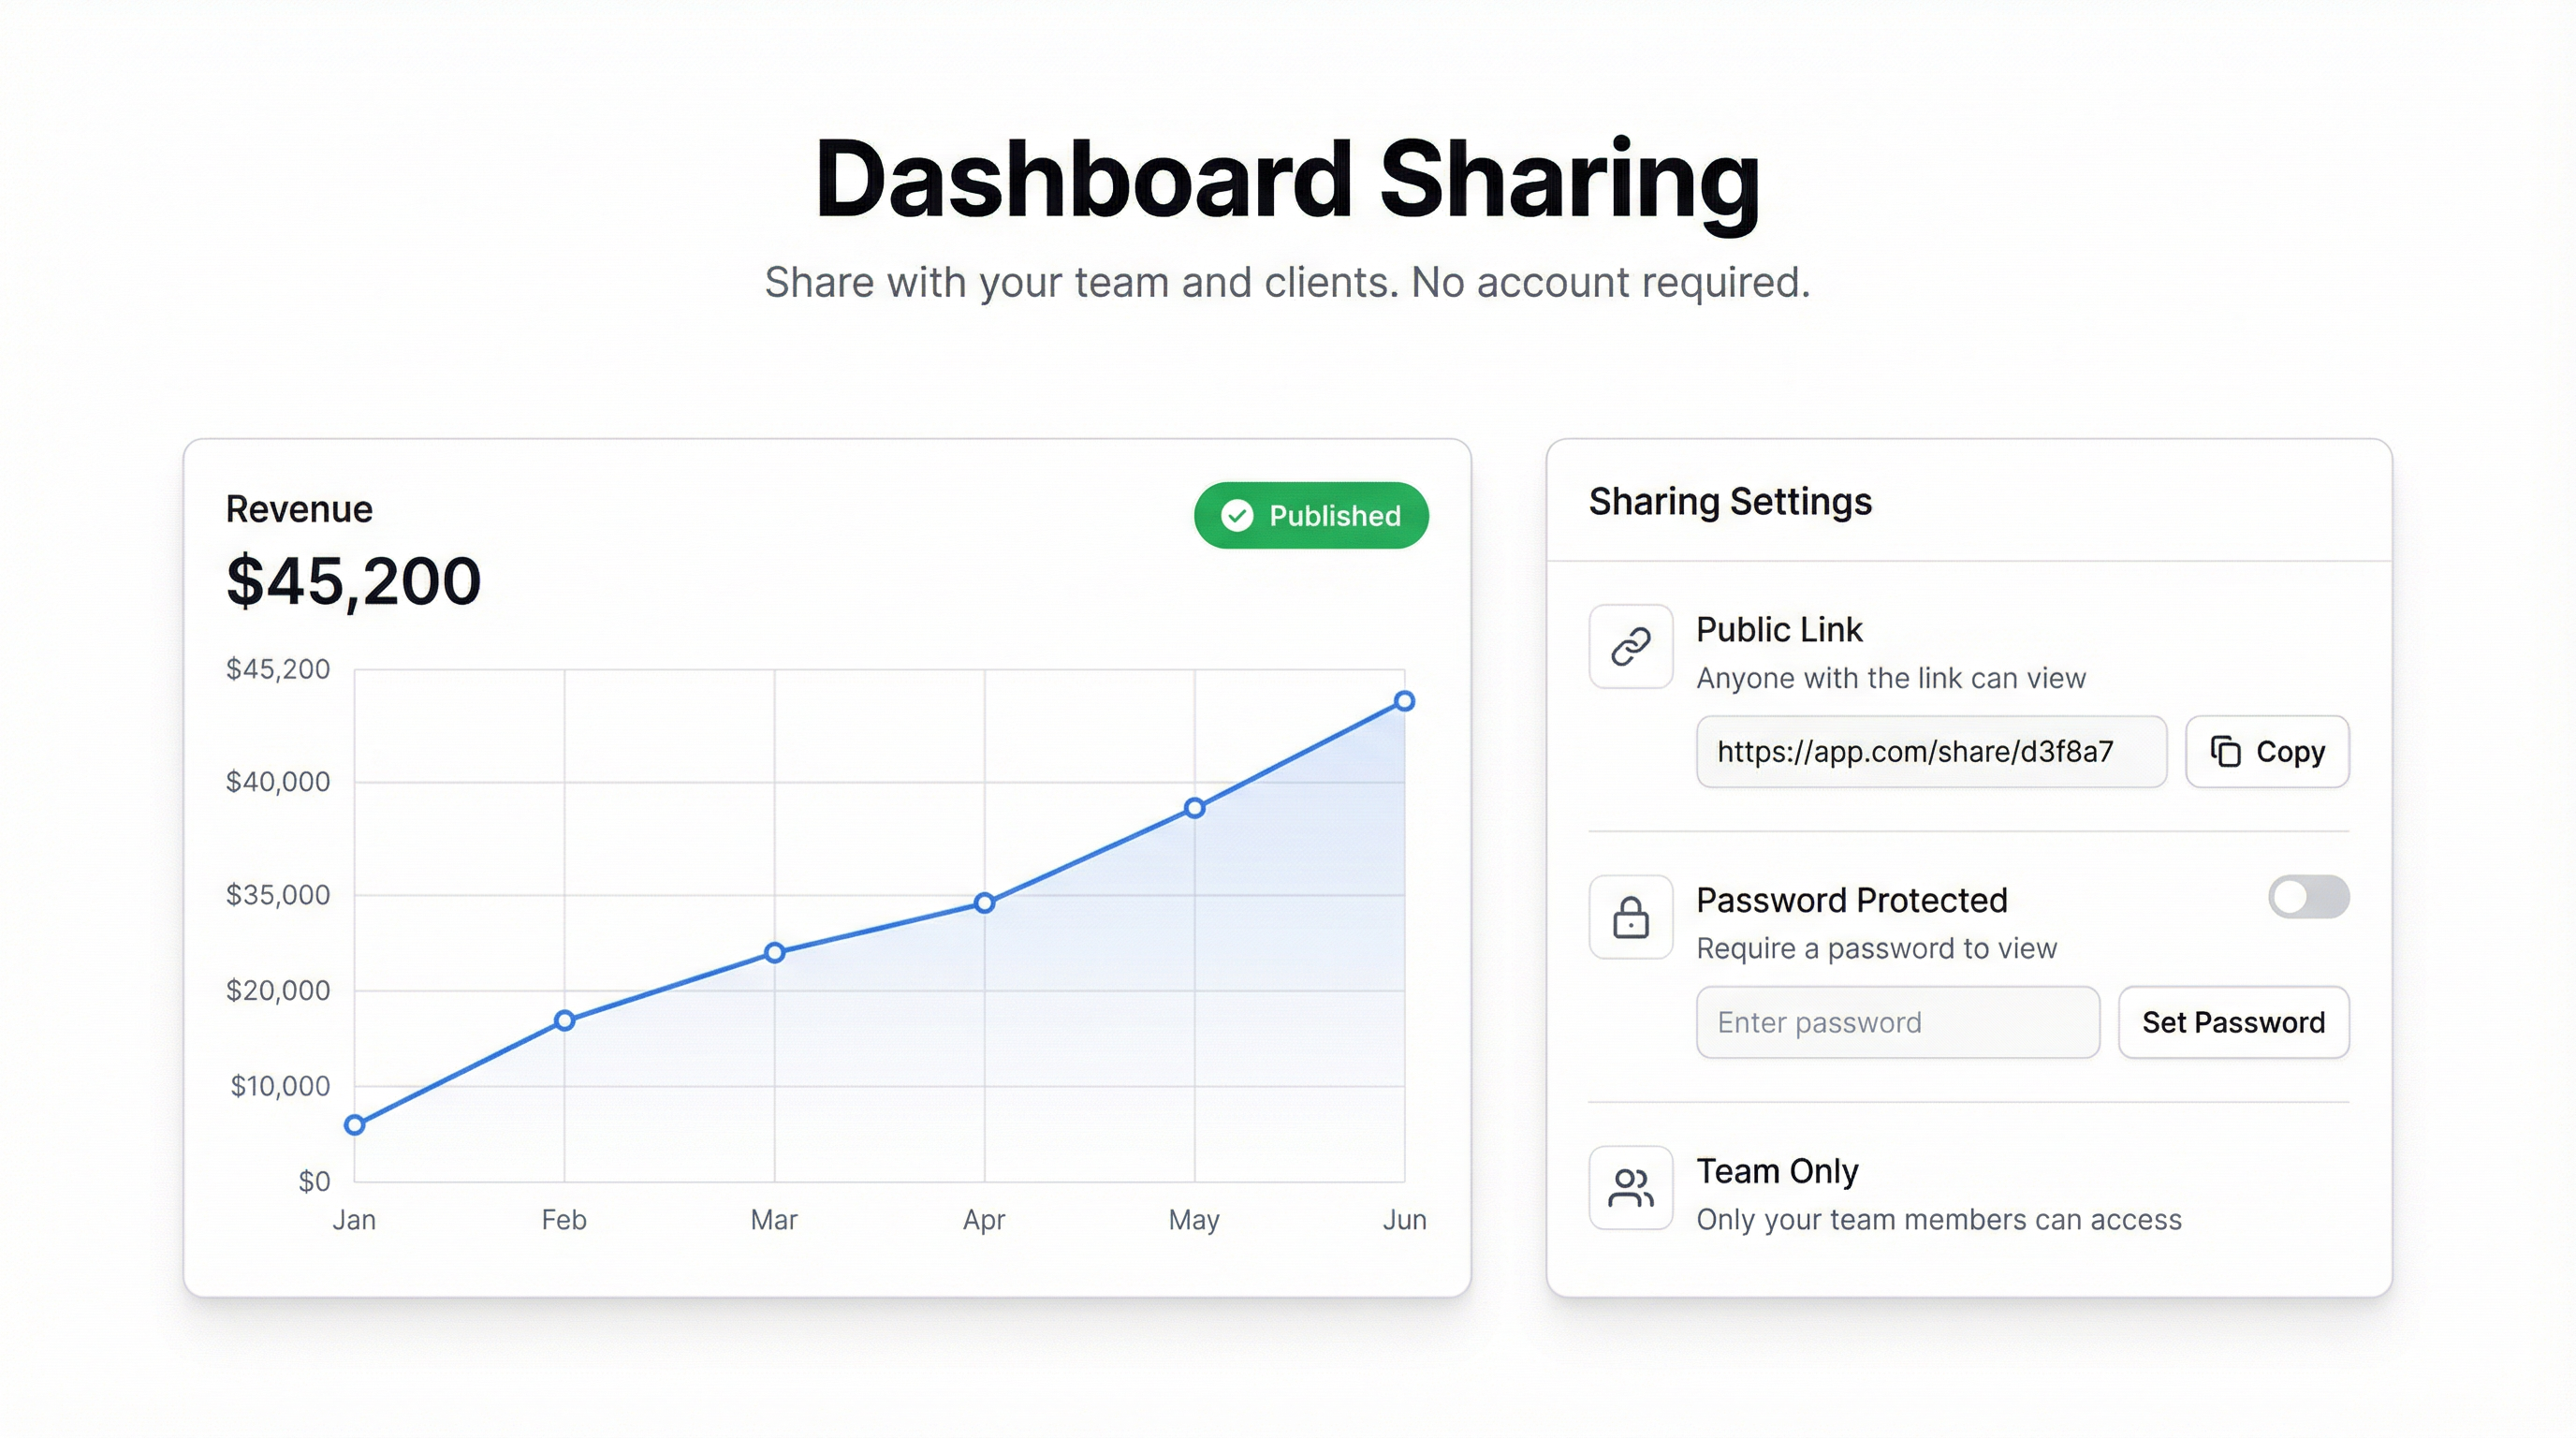
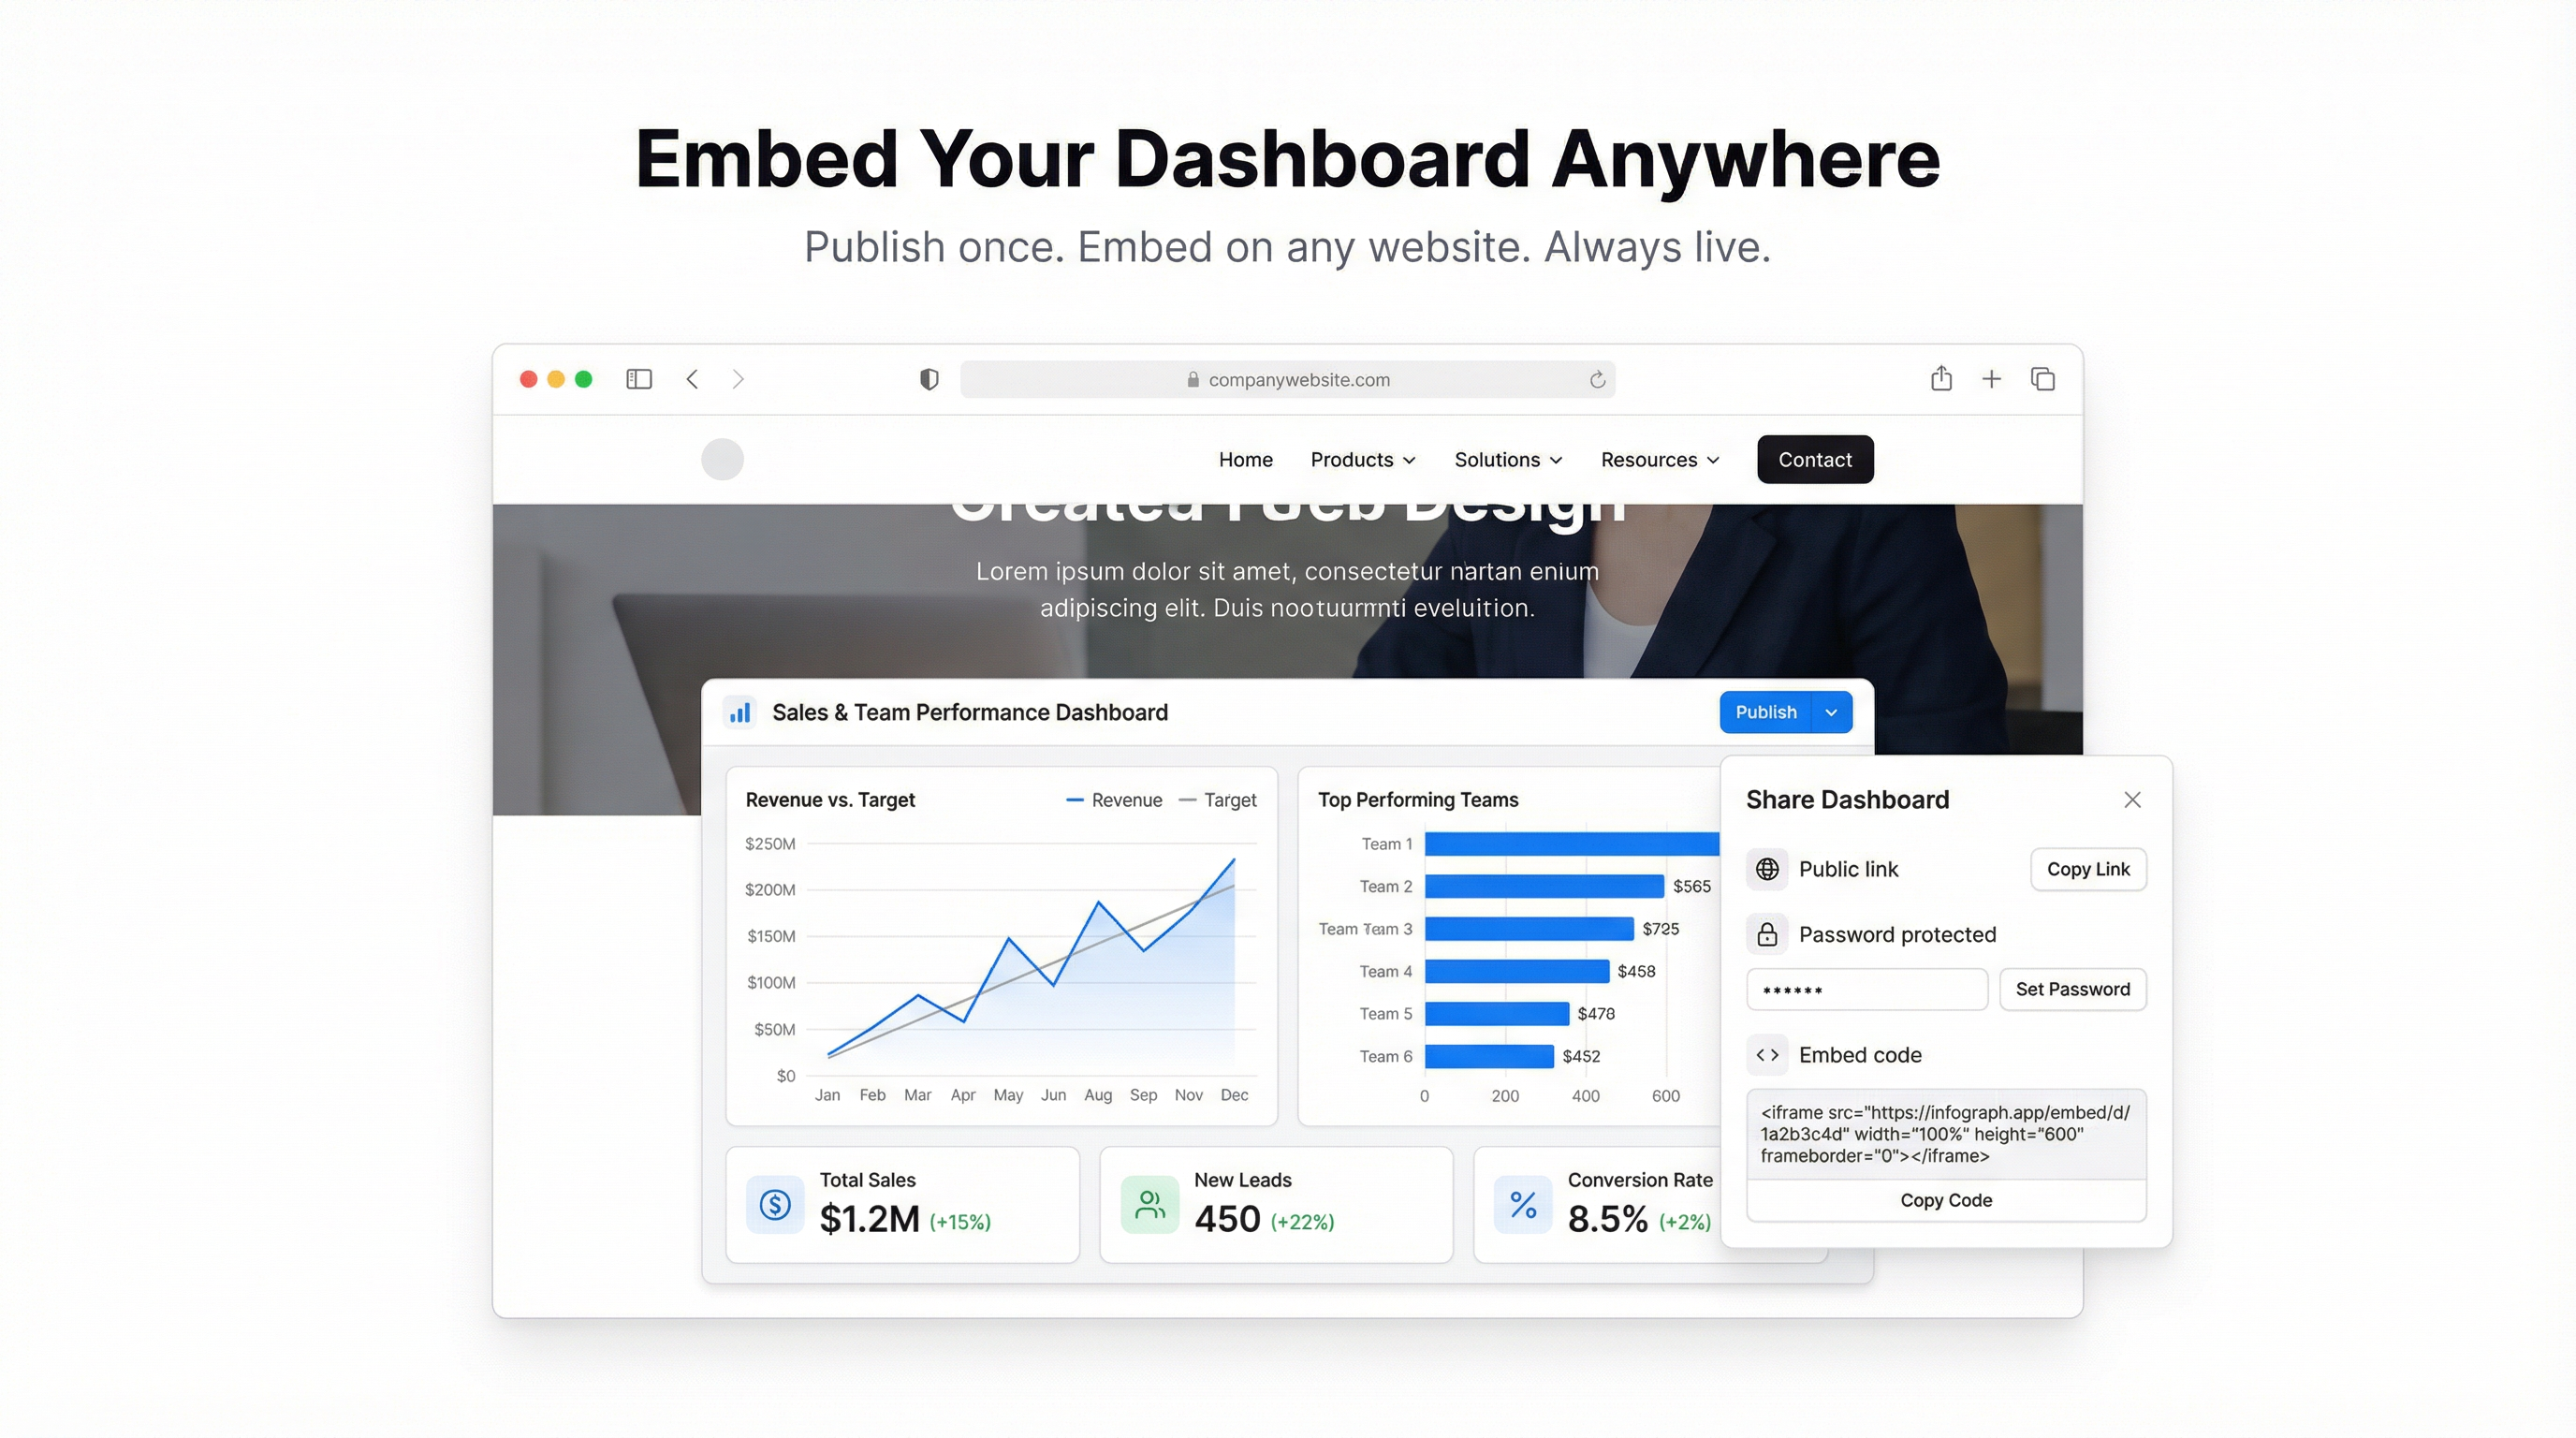
With Infograph, you click publish and get a link. Share that link with your team, your manager, your client — whoever needs to see it. They open a browser and see the current state of the data. No file download. No “wait, is this the latest version?”
You can also control access. Keep it private, restrict it to your team’s account, or make it public. The dashboard can be live (updates as the data changes) or a snapshot (frozen at a point in time for historical reference). Both are one click.
What the AI Actually Does
When you describe a report in Infograph, the AI is doing real data work — not just picking chart templates. It reads the structure of your data, identifies the right fields to use, writes the queries needed to pull the right aggregations, and builds the visual layout.
That means you don’t need to know which column maps to which chart axis. You don’t need to write a SUMIF or a VLOOKUP. You describe what you want to see, and the AI figures out how to get there.
This works across different data shapes. Flat transaction tables. Multi-tab spreadsheets. Exports from your CRM or analytics tools. The AI handles the translation from raw data to insight.
Why This Matters More Than You Might Think
The reason manual reporting is so painful isn’t that the tools are bad — Excel and Google Sheets are genuinely powerful. The problem is that most people who need reports aren’t analysts. They’re sales managers, marketing leads, operations people, founders. They know what questions they need to answer. They don’t want to spend their time figuring out how to answer them in a spreadsheet.
An AI report generator closes that gap. The expertise required to build a clean, accurate, well-structured report drops to near zero. If you can describe what you want, you can build it.
That changes who can have good data. Right now, access to clean dashboards usually requires either a data analyst or a lot of time with BI tools that assume you already know SQL. Infograph removes both of those dependencies.
Getting Started
If you’re still building reports manually — still exporting PDFs, still reformatting slides, still sending attachments — try the alternative.
Go to app.infograph.ai, upload your data or connect your Google Sheet, and describe the report you’ve been building by hand. See how long it takes.
The free plan includes one dashboard and enough AI credits to build several reports. No credit card required.
The Monday morning report that used to take two hours takes about thirty seconds. That time goes somewhere better.