Your dashboard is built. The charts are clean, the KPIs are sharp, and the data tells a story. Now what — screenshot it and paste it into a PDF?
No. You can do better.
With Infograph, you can embed your dashboard directly into any website, client portal, internal wiki, or public page. It stays live. It updates automatically. And anyone visiting the page sees it exactly as it is right now — not as it was last Tuesday when you exported it.
Here’s everything you need to know.
Why Embedding Beats Screenshots (and PDFs)
Screenshots are static. The moment you take one, it starts going stale. By the time someone reads a PDF report, the numbers inside it may already be out of date.
Embedded dashboards solve this completely:
- Live data — the chart on your webpage reflects the latest figures from your data source, not a frozen snapshot from export day
- Interactive — viewers can hover over data points, read tooltips, and engage with the visuals
- No extra work — once the embed is set up, you never need to re-export or re-upload anything. Update your Google Sheet, and the embedded dashboard updates with it
- Credibility — a live dashboard on your website or client portal looks professional in a way a PDF never will
If you’re running client reporting, publishing public data, or keeping your team aligned on company metrics, embedding is the right move.
Infograph’s Sharing Options
Before we get to the embed code, it’s worth understanding the full range of sharing options Infograph offers. They cover every use case — from fully public to tightly locked down.
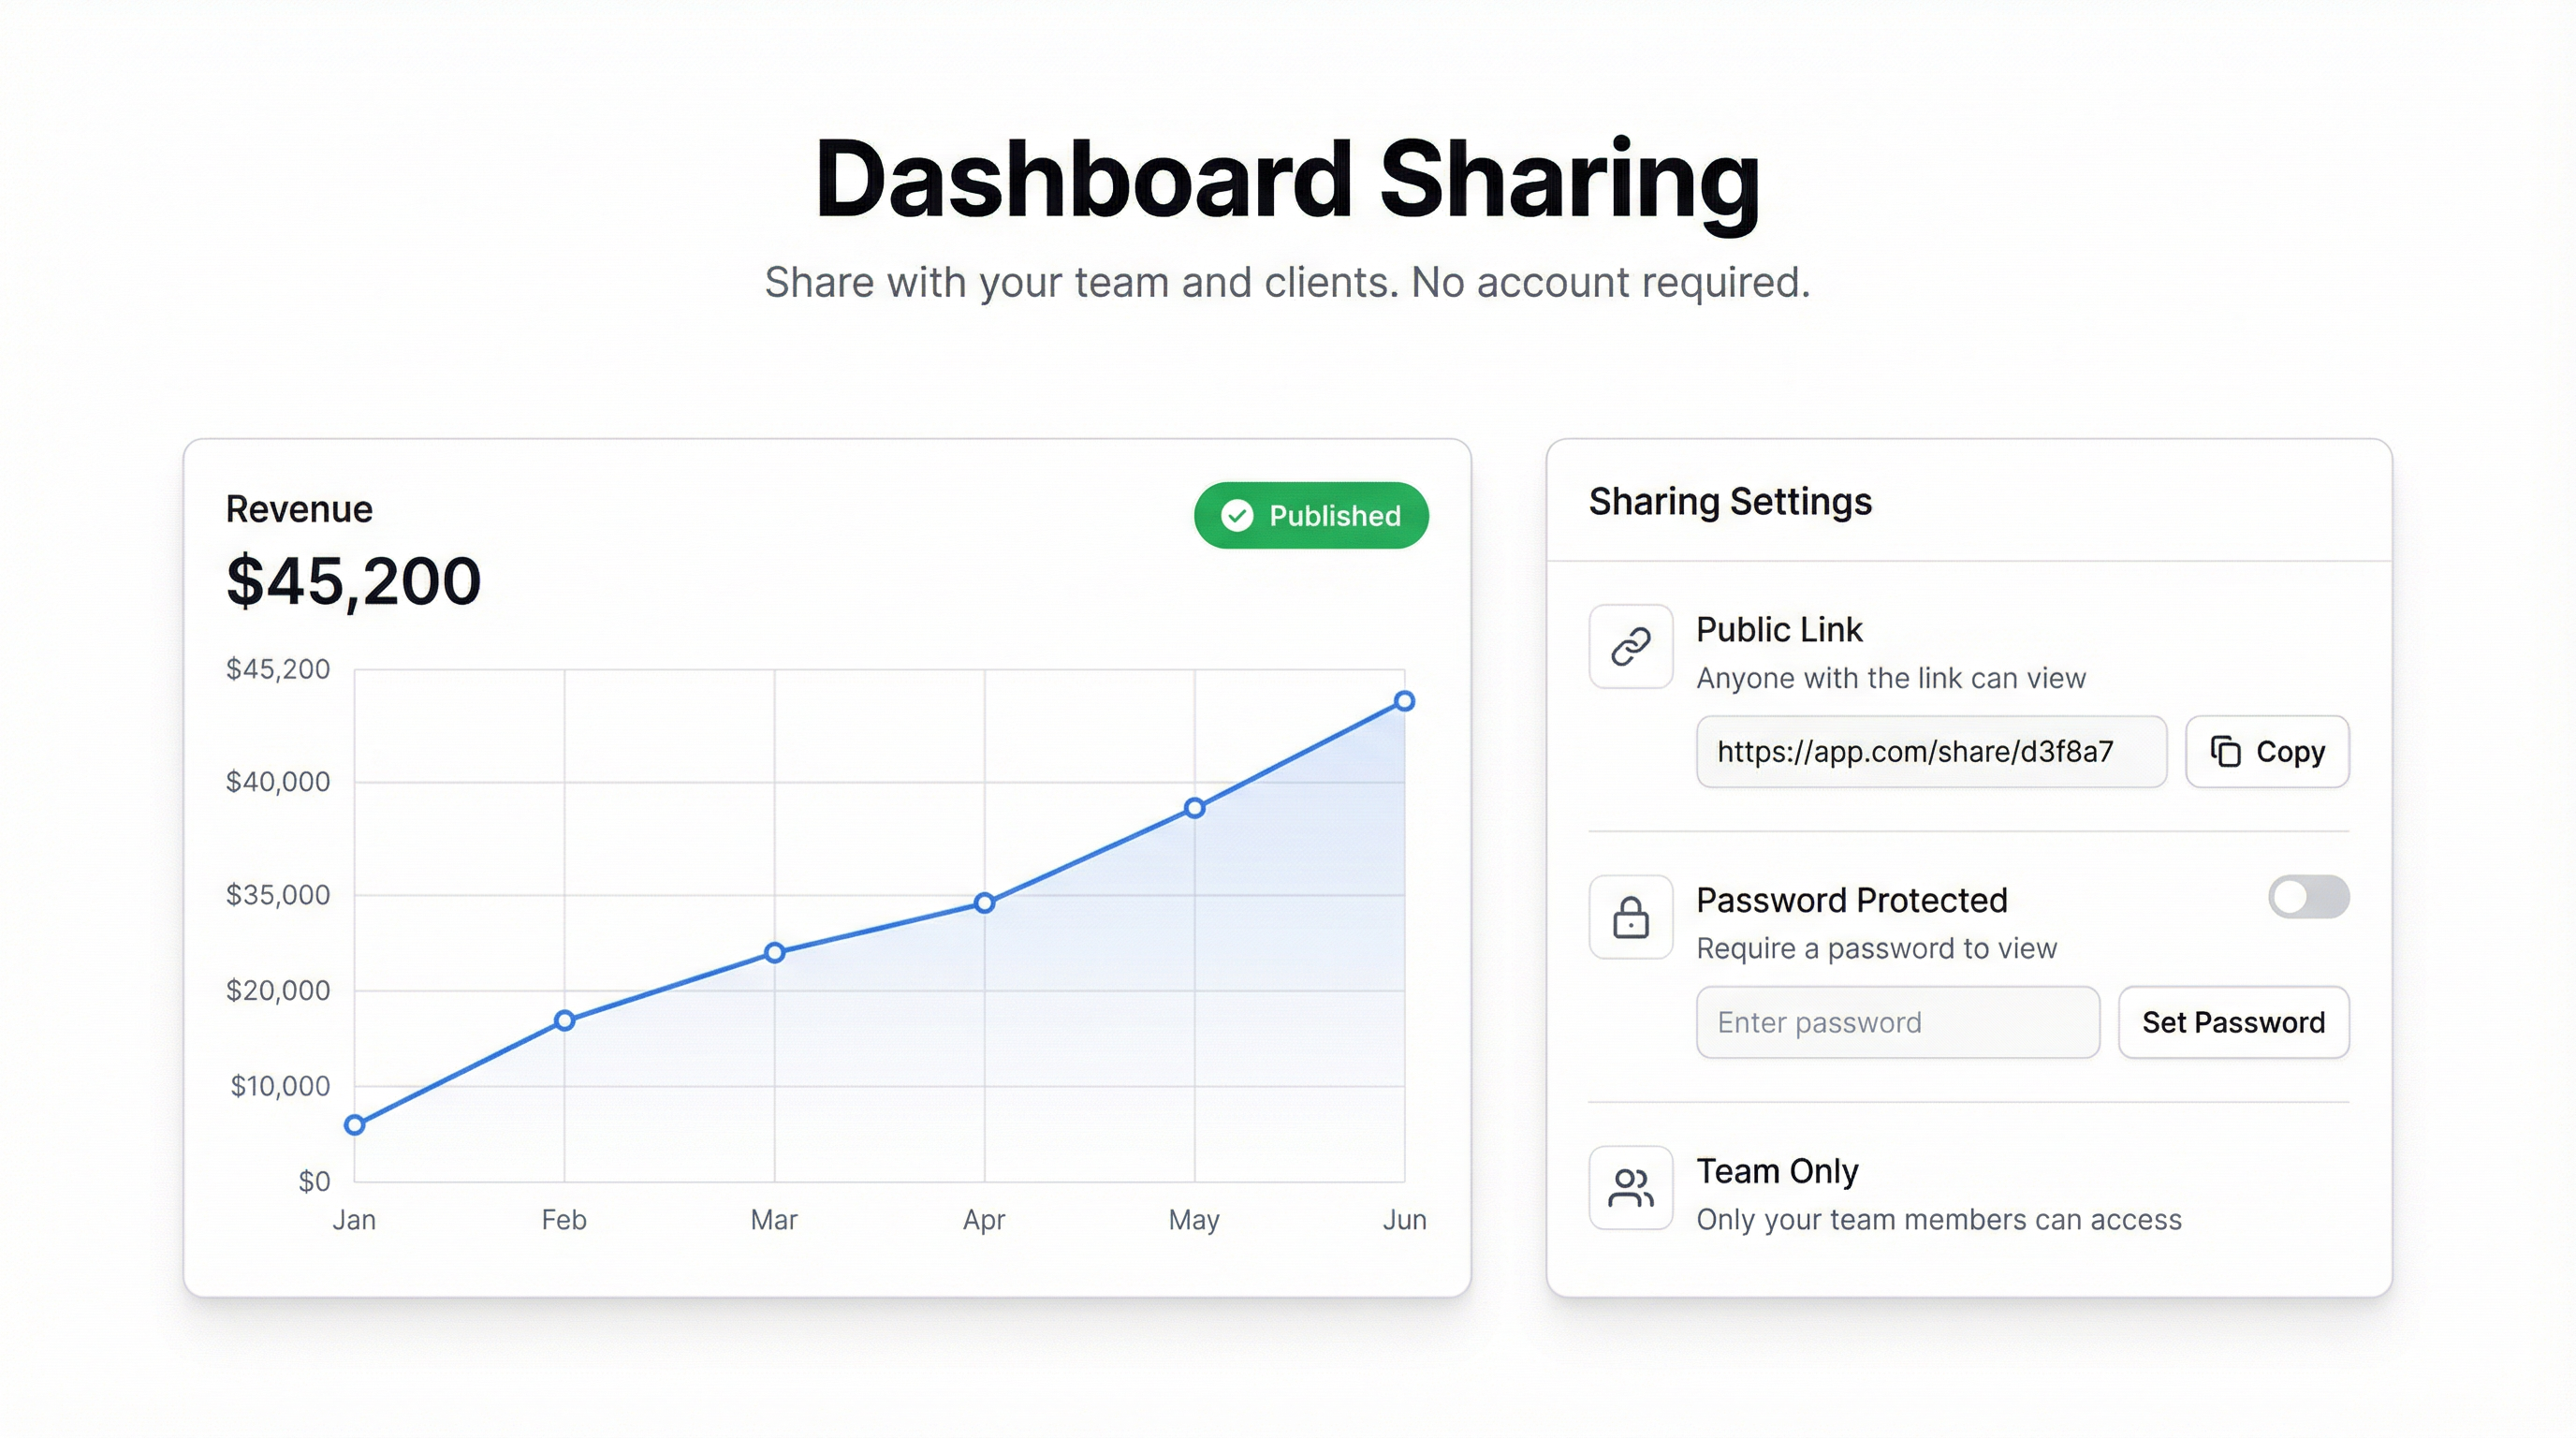
Public Link
Share your dashboard with anyone via a simple URL. No login required. Great for public-facing data journalism, marketing metrics, or anything you want the world to see.
Password Protected
Publish the dashboard publicly, but require a password to view it. Perfect for client reporting where you want easy access without requiring the client to create an account.
Team-Only
Restrict the dashboard to members of your Infograph team. Only colleagues on your Teams plan account can view it. No external access, no accidental leaks.
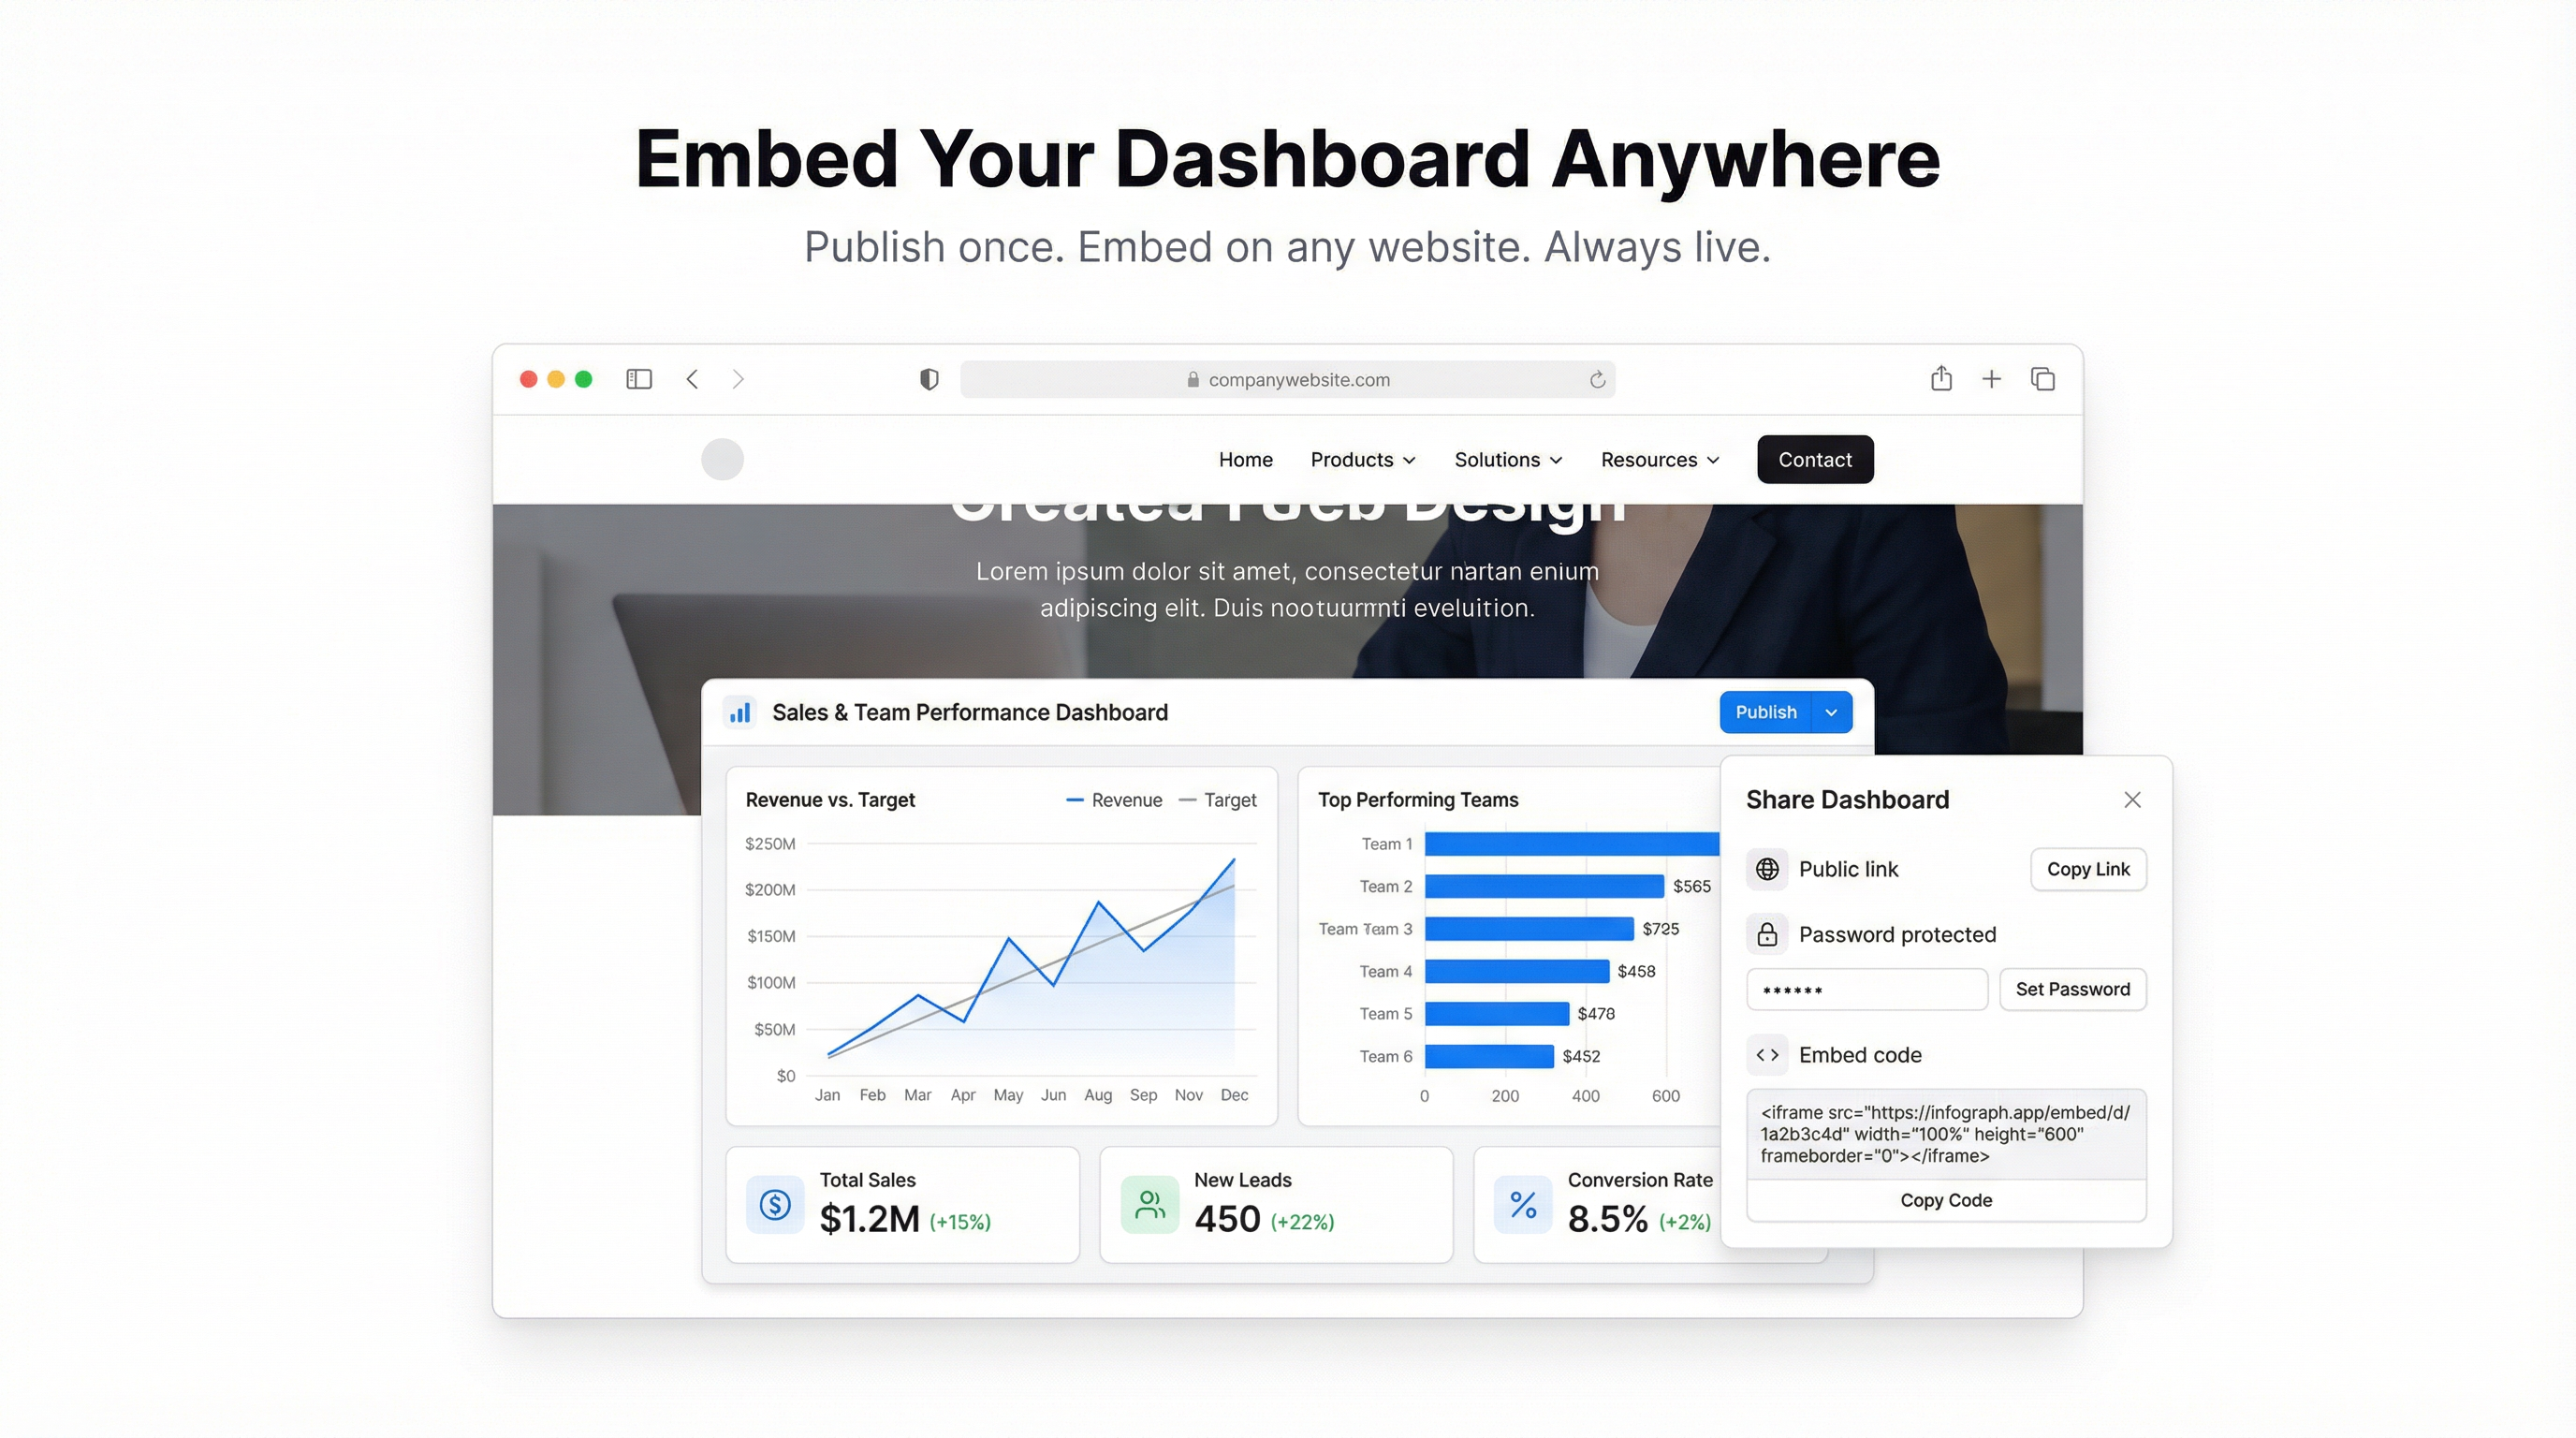
Embed Code
Generate an <iframe> snippet and paste it into any webpage. The dashboard renders inline — live, interactive, and always current. This is what we’ll focus on for the rest of this post.
Live vs Snapshot Embedding
When you publish a dashboard for embedding, you choose one of two modes:
Live — The embed reflects your dashboard in real time. If you add a new chart, update the layout, or change a color, the embedded version updates automatically. Your data also stays current — if you’re connected to a Google Sheet or Excel Online file that gets updated, those changes flow through to the embed.
Snapshot — The visual design of your dashboard is frozen at the point of publishing. Layout changes won’t appear in the embed. However, if you have live data connections (Google Sheets, Excel Online), the underlying data can still update — only the dashboard’s visual layout is locked, not the numbers themselves.
For most use cases — client portals, internal dashboards, live reporting pages — you want Live mode. Use Snapshot if you need to lock in a specific version of a dashboard for a particular audience while continuing to iterate on your own copy.
How to Publish and Get Your Embed Code
Getting your embed code takes less than a minute. Here’s the step-by-step:
Step 1: Open Your Dashboard
Log into Infograph and open the dashboard you want to embed. Make sure it’s complete — once you publish, the embed is live.
Step 2: Click “Publish”
In the top-right corner of the dashboard editor, you’ll see the Publish button. Click it.
Step 3: Choose Your Sharing Settings
A share panel will appear with your options:
- Set visibility to Embed (or configure public/password-protected access first if you also want a shareable link)
- Choose Live or Snapshot mode
- Optionally set a password if you want to restrict who can view the embed
Step 4: Copy the Embed Code
Once published, Infograph generates a short <iframe> snippet. It looks something like this:
<iframe
  src="https://app.infograph.ai/embed/your-dashboard-id"
  width="100%"
  height="600"
  frameborder="0"
  allowfullscreen>
</iframe>
Copy it. That’s your embed code.
Step 5: Paste It Into Your Website
Open your website’s HTML, CMS editor (Webflow, WordPress, Notion, Confluence — all support raw HTML embeds), or wiki page. Paste the snippet. Save. Done.
Your dashboard is now live on your site.
Real-World Use Cases
Client Reporting Portal
Agencies and consultants: stop sending monthly PDF reports. Build a dashboard for each client, embed it on a private page in their portal, and protect it with a password. When the data updates, the portal updates. No emails, no re-exports, no version confusion.
Your client logs in, sees their KPIs live, and comes back whenever they want a current view. That’s the kind of reporting that builds trust.
Internal Company Dashboard
Embed key company metrics — revenue, user growth, support volume, whatever matters — directly on your internal wiki or intranet. Every team member who visits the page sees the latest numbers without needing an Infograph account.
One dashboard, one source of truth, embedded everywhere it’s needed.
Public Data Journalism
Publishing a data-driven story? Embed the dashboard directly in your article. Readers don’t just see a static chart — they can explore the data themselves, hover over specific points, and draw their own conclusions.
This is how modern data journalism works. Static images are yesterday’s approach.
Product or Marketing Pages
Showcasing your product’s growth? Embed a dashboard on your public-facing metrics page. It signals transparency, updates automatically, and looks significantly better than a screenshot with a “last updated” disclaimer.
Tips for Clean Embeds
A few things that make embedded dashboards look great:
- Match the width to your page layout — set
width="100%"to fill the container, or a fixed pixel width if you need precise control - Set height explicitly — dashboards with many charts look better at 800px or taller; KPI-focused layouts can work at 400–500px
- Use Live mode by default — unless you have a specific reason to freeze the layout, Live mode ensures your embed is never out of date
- Test on mobile — Infograph dashboards are responsive, but always preview the embed on a mobile viewport before publishing
Start Embedding in Under a Minute
If your dashboards are already built, you’re one click away from having them live on your website. Open your dashboard, hit Publish, grab the embed code.
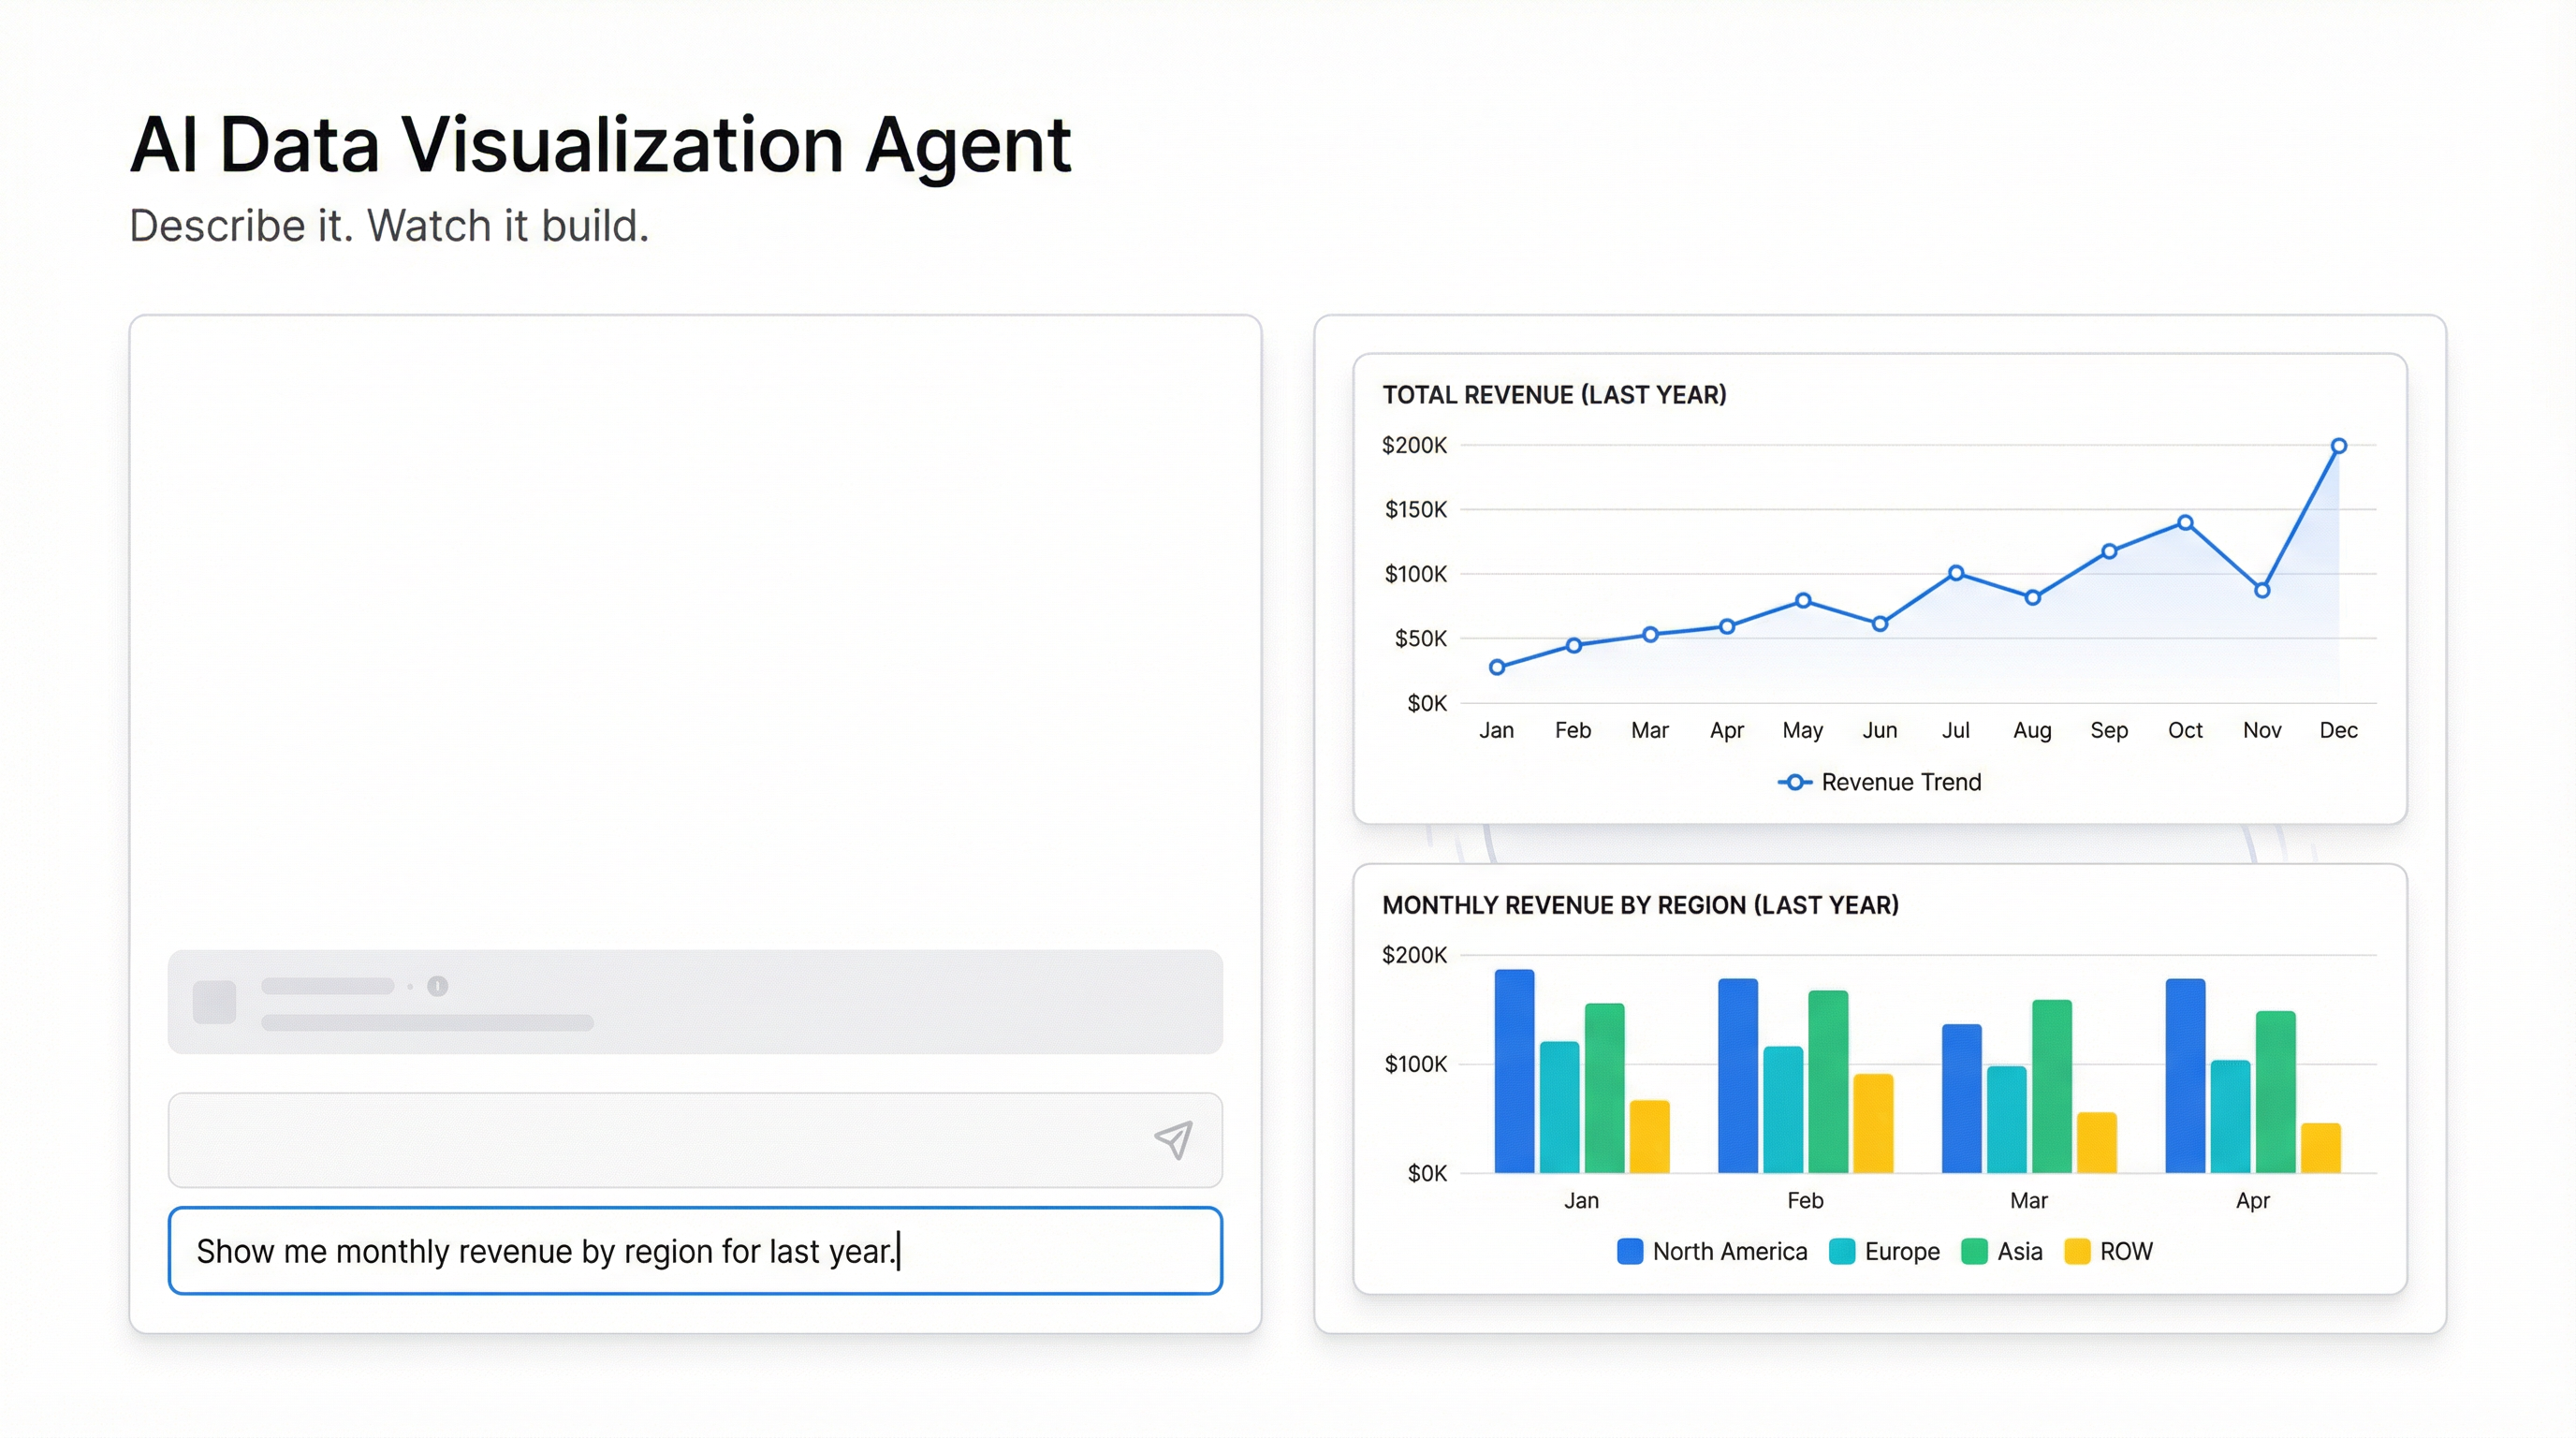
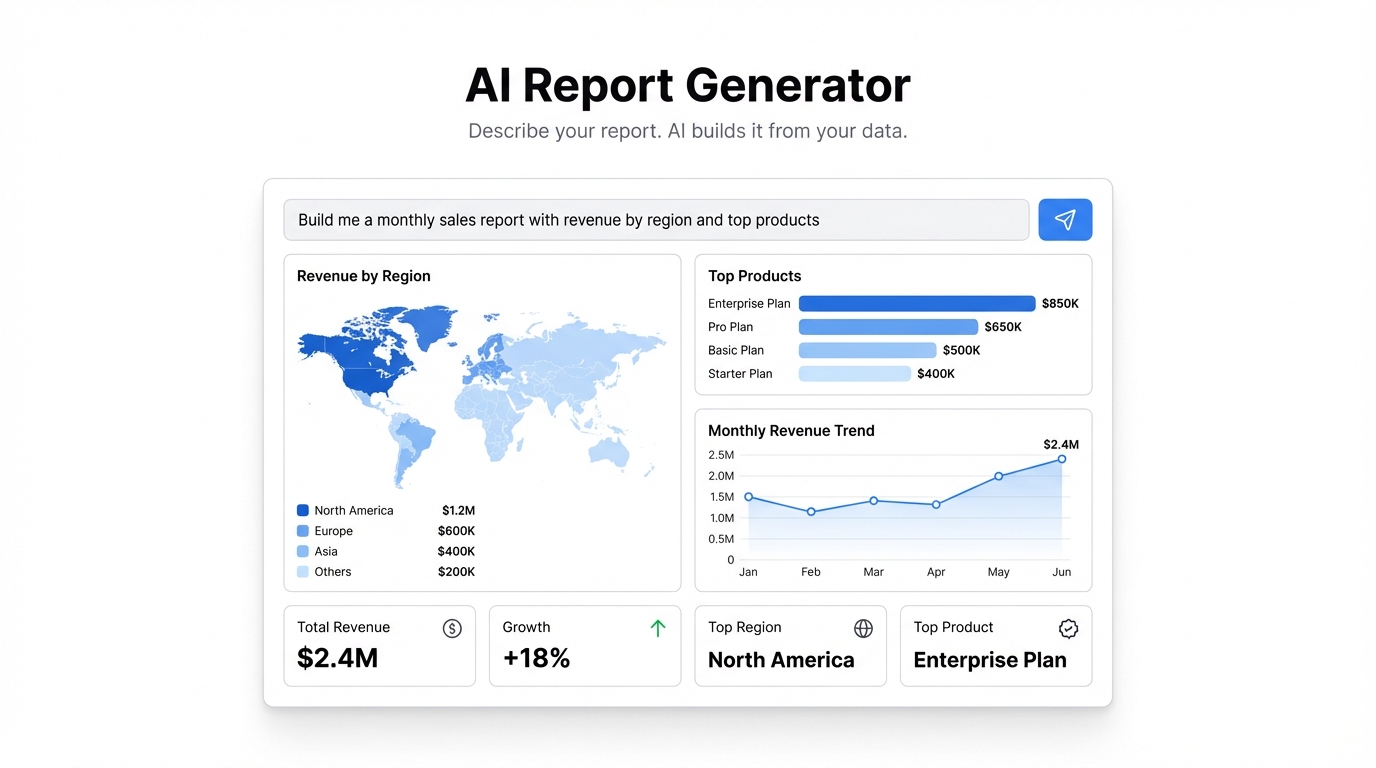
If you haven’t built your dashboard yet — start now at app.infograph.ai. Upload a CSV, connect your Google Sheet, describe what you want to see, and watch Infograph build it. Then embed it.
Screenshots are static. PDFs go stale. Your dashboard doesn’t have to.