Most people searching for “AI data visualization” end up on a listicle. Tableau. Power BI. Looker. Maybe a newer tool with a chat interface bolted on. The listicle calls them AI-powered because they have some autocomplete in the chart editor or a button that suggests a chart type.
That’s not an agent. That’s a tool with better UX.
The difference matters if you’re trying to understand why something happened in your data — not just see it.
Tool vs. agent: what actually changes
A visualization tool, even a good one, is a means of expression. You know what you want to show. The tool helps you show it. You pick the chart type. You map the columns. You configure the axes. The tool executes your instructions.
An agent starts from what you want to understand. You don’t know yet whether you need a bar chart or a scatter plot or a table. You know you want to see which product categories are driving Q4 revenue relative to last year. The agent figures out the right visual for that question. It reads your data, decides what transformation is needed, picks the chart form that answers the question most clearly, and builds it.
The output might be one chart. It might be six. It might include a table alongside a trend line because your data has both a distribution story and a time-series story worth telling.
You didn’t specify any of that. You just described what you were trying to understand.
Why this matters more than it sounds
The practical effect is that the bottleneck shifts. With a visualization tool, the bottleneck is skill — someone needs to know how to use the tool, how to model the data correctly, which chart type makes sense. That’s why most organizations have a “data person” who builds dashboards for everyone else.
With an agent, the bottleneck becomes the question. Can you articulate what you’re trying to understand? If you can, the agent handles everything else. The marketing manager who doesn’t know what a pivot table is can build a dashboard that shows conversion rate by traffic source and campaign for the last 90 days. She just has to know what she wants to know.
That’s a real shift. Most BI adoption problems aren’t about price or features. They’re about the gap between the people who have questions and the people who can answer them with data. An agent narrows that gap.
What describing a dashboard looks like
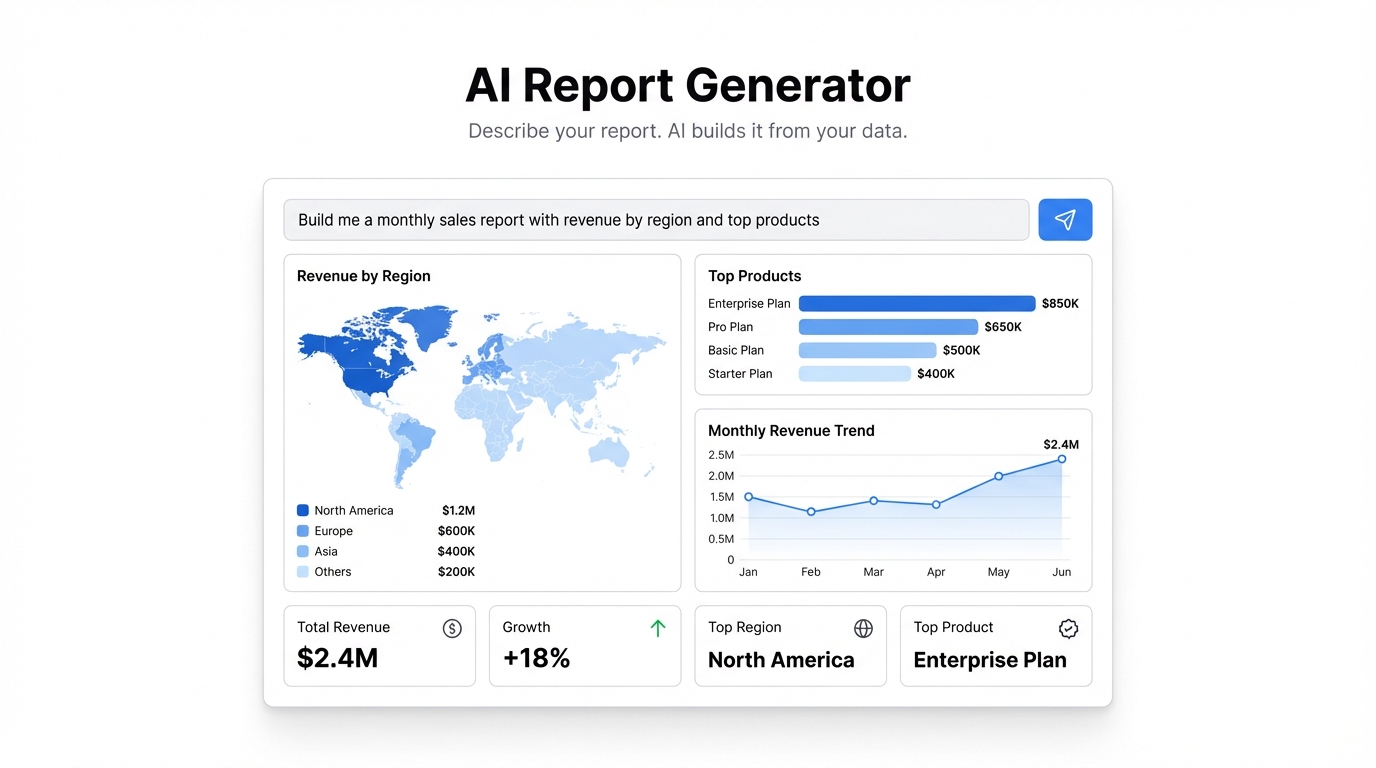
In Infograph, you upload your data file — CSV, Excel, Google Sheet, JSON, whatever format it’s in — and then you describe what you want.
Not: “Create a bar chart using column C, grouped by column A, filtered to 2025.”
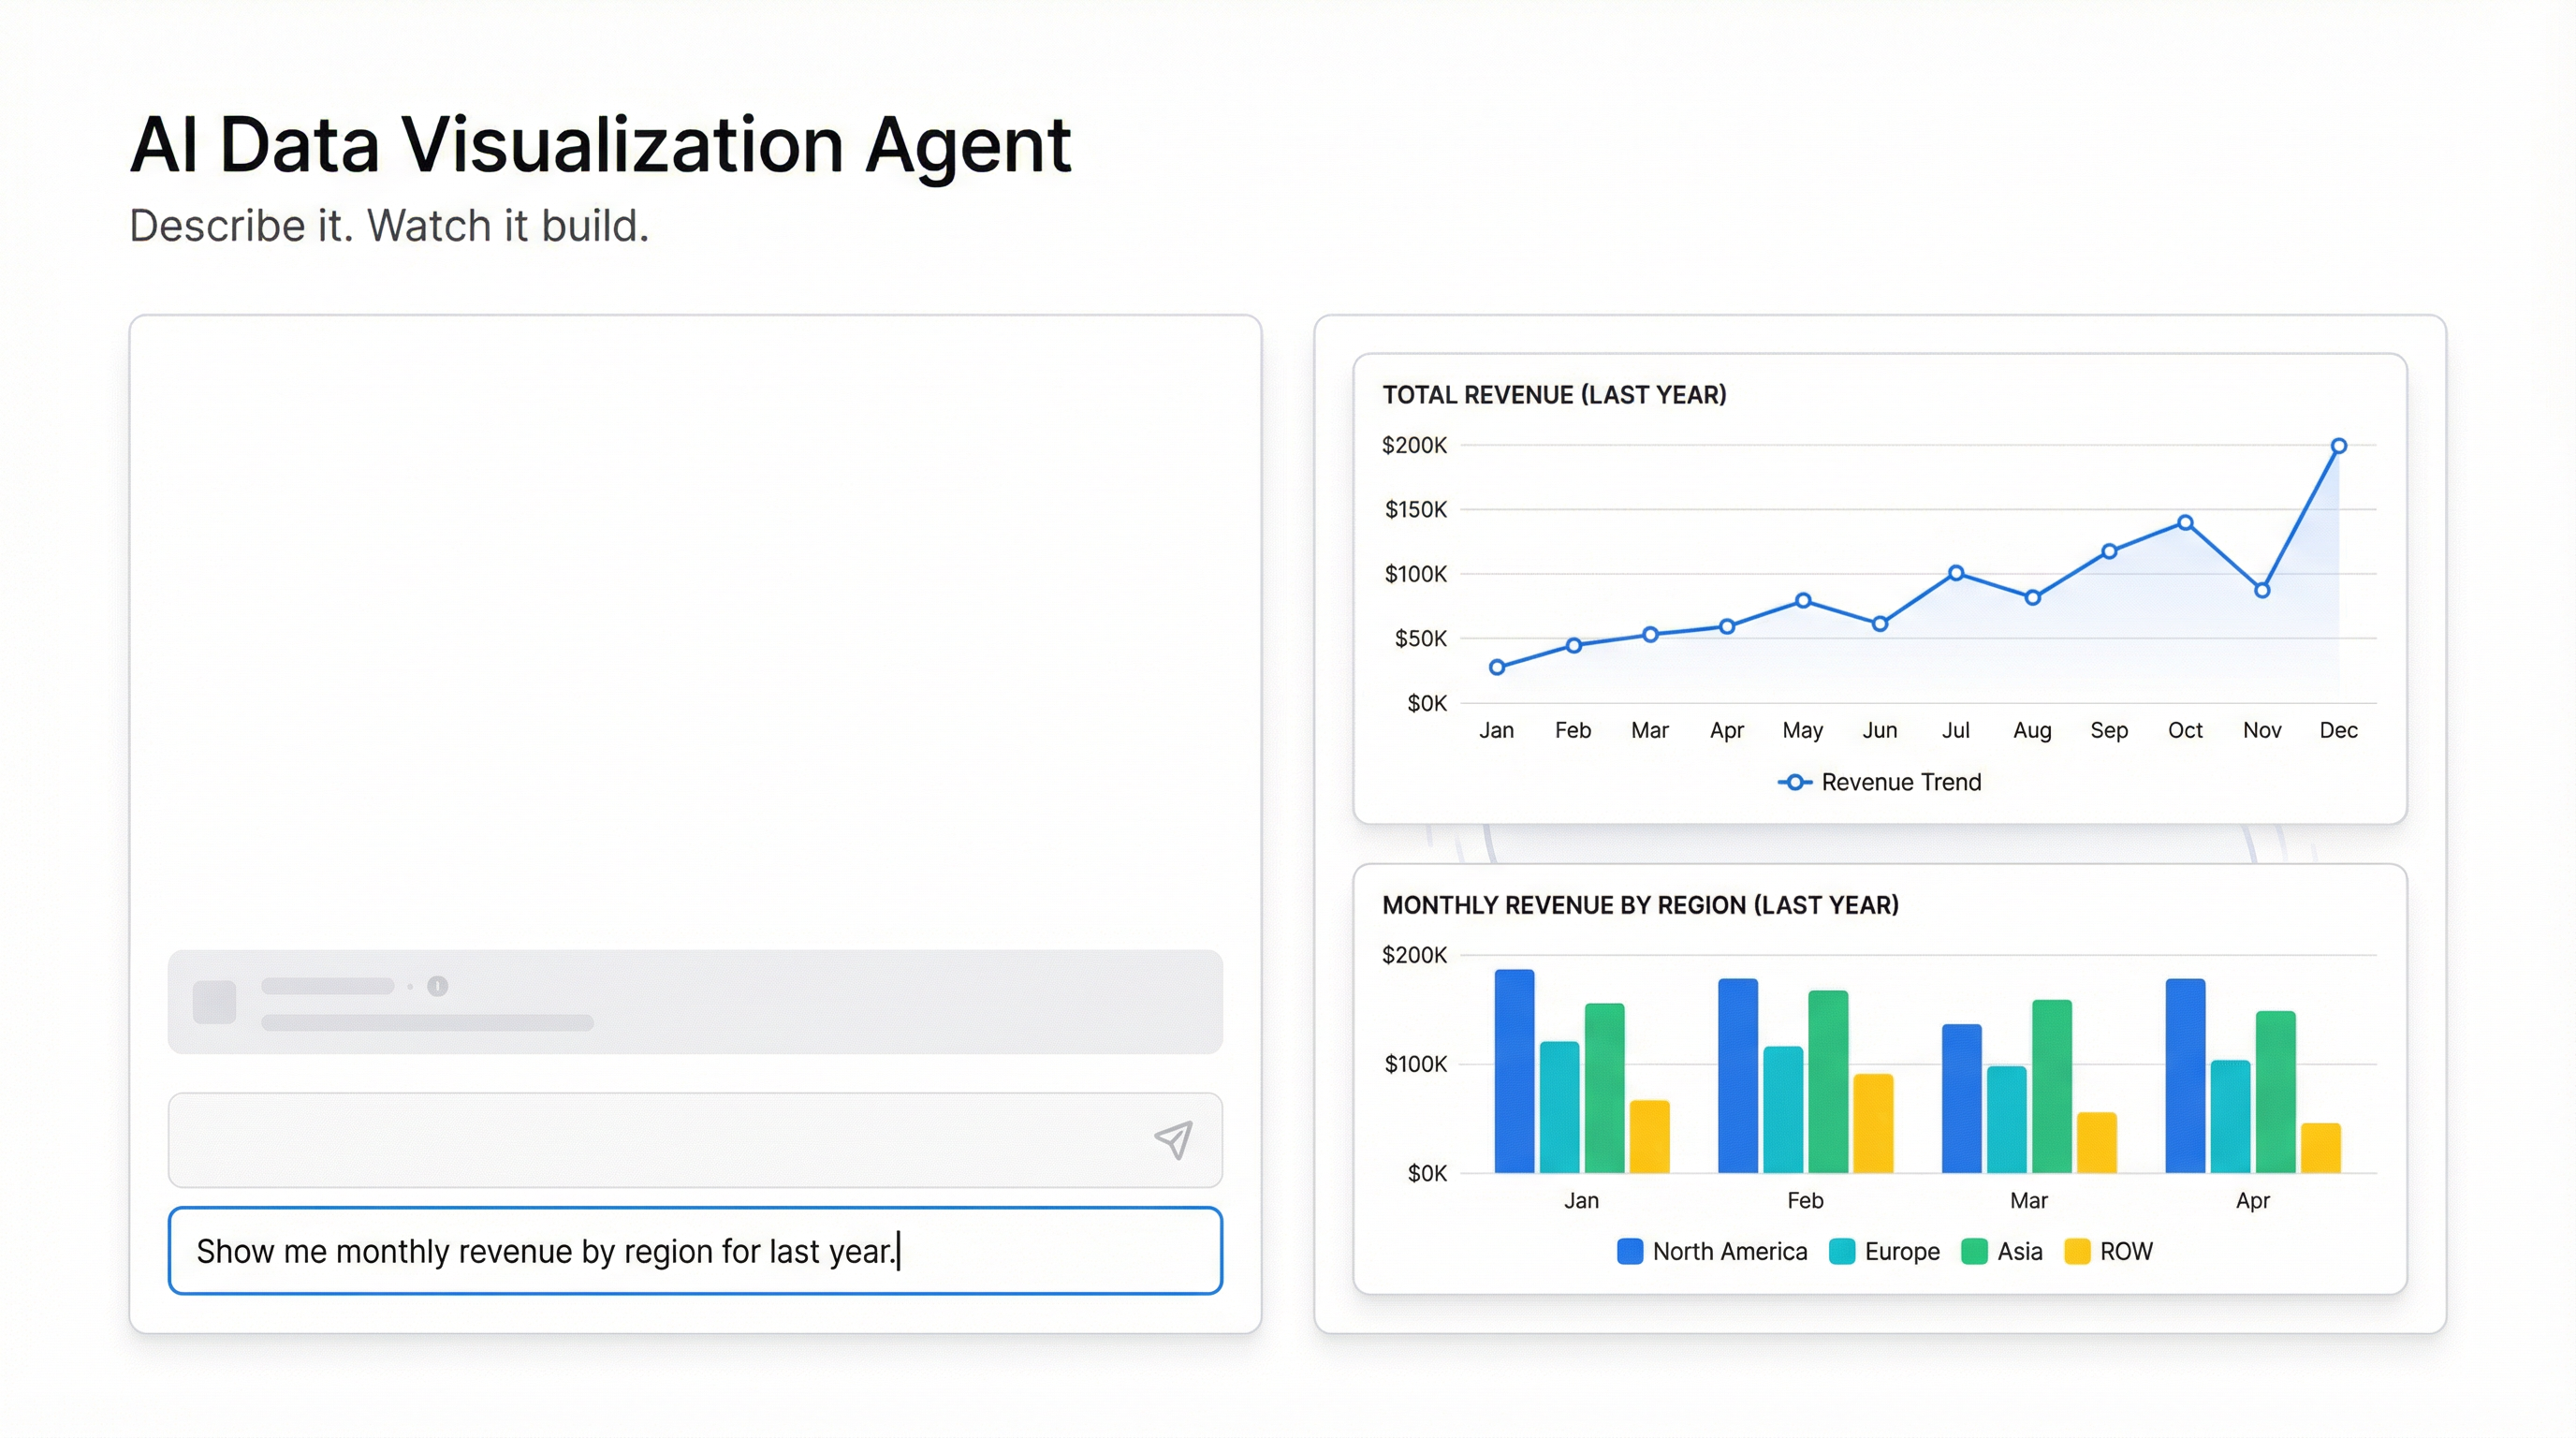
More like: “Show me monthly revenue by region for last year, and highlight which months had below-average performance.”
Or: “I want to understand our customer churn. I have a CSV with signup dates, cancellation dates, plan type, and company size.”
The agent reads the data, understands the structure, and builds a dashboard that answers the prompt. It handles the data transformations. It picks the chart forms. It labels everything clearly.
If what it builds isn’t quite right, you describe the adjustment. “Break that down by plan tier instead.” “Show the percentage instead of raw count.” “Add a trend line.” You’re in a conversation with the data, not a configuration screen.
What Infograph actually does with your prompt
When you submit a prompt in Infograph, a few things happen that aren’t visible but matter:
Data understanding — the AI reads your file structure, identifies column types, detects date formats, finds categorical vs. numerical fields. This is what makes it possible to describe your data loosely and have it still work correctly.
Query generation — based on your prompt and the data structure, it generates the queries needed to answer your question. If you ask for “monthly revenue,” it figures out which column is a date, which is revenue, and how to group accordingly.
Visualization selection — it picks chart types that fit the data shape and the question. Time series → line chart. Part-to-whole → pie or stacked bar depending on the number of categories. Correlation → scatter plot. Distribution → histogram. It doesn’t always pick perfectly, but it picks sensibly, and you can redirect it.
Dashboard assembly — it arranges the resulting charts into a coherent layout. Related metrics go together. Summary stats appear at the top. Breakdowns and trends sit below.
All of this from one text input.
The things an agent gets right that tools don’t
There’s a class of dashboard problem that’s tedious with traditional tools and almost trivial with an agent.
Cross-dataset questions — “Show me sales data next to support ticket volume by month.” In a traditional tool, you’re joining datasets, building relationships, hoping the keys match. In Infograph, you upload both files and describe what you want to see. It handles the join.
Exploratory questions — “What’s unusual about this month’s data?” Traditional tools show you what you configured. An agent can look at the data fresh and surface patterns that weren’t in your original question.
Non-standard data shapes — your data rarely comes in the exact format a BI tool expects. Dates in the wrong format, columns that need splitting, headers in row 3 instead of row 1. An agent handles normalization as part of understanding the data. A tool usually requires you to clean it first.
The honest limits
An agent isn’t magic. It’s very good at building dashboards from structured data when you can describe what you want in plain language. It’s less good when the question is genuinely ambiguous or when the data requires complex domain-specific transformations that aren’t obvious from the file itself.
If you need to model cohort retention with a specific methodology your team defined three years ago, you’ll need to guide it carefully. If your data has encoding issues or extremely non-standard structure, there may be some cleanup first.
But for the large majority of business dashboard use cases — “show me this metric, broken down by these dimensions, over this time period” — the agent approach beats the tool approach in almost every way. Faster to build. More accessible to non-technical users. Easier to iterate on.
The question isn’t whether AI visualization tools are useful. They are. The question is whether the thing you’re using is actually an agent — or just a chart builder with a chat window.