The dashboard looks great. Your data is in order, the charts tell the right story, and you know the numbers cold. Now someone asks: “Can you share that with the team?”
This is where most dashboard tools quietly disappoint you.
Sharing sounds simple. It isn’t. The way you share a dashboard with an internal analyst is different from how you share it with a client who has no idea what BI software you use. Sharing a snapshot of last month’s numbers is different from sharing a live view that updates as the data changes. And sending a PDF is not sharing a dashboard — it’s sending a picture of a dashboard, which is a meaningfully different thing.
Here’s how to think about it properly.
The Four Sharing Scenarios
1. Sharing with your own team
The most common case. A colleague needs to see the same dashboard you built, without rebuilding it themselves. The right answer here is access control — they should be able to view (or edit) the dashboard inside your tool without a separate onboarding process.
In Infograph, team members on a Teams plan can access shared dashboards directly within your organisation’s account. One dashboard, multiple people, no duplication.
2. Sharing with external clients or stakeholders
This is where things get complicated. Your client doesn’t have an account in your dashboard tool. They shouldn’t need one. What they need is a link — something they can open in a browser, see the numbers, and not have to configure anything.
The ideal experience: you click “Share”, copy a link, send it. They open it. Done.
The wrong experience: “Please create an account, verify your email, accept the terms, and ask your admin to grant you Viewer access to this workspace.”
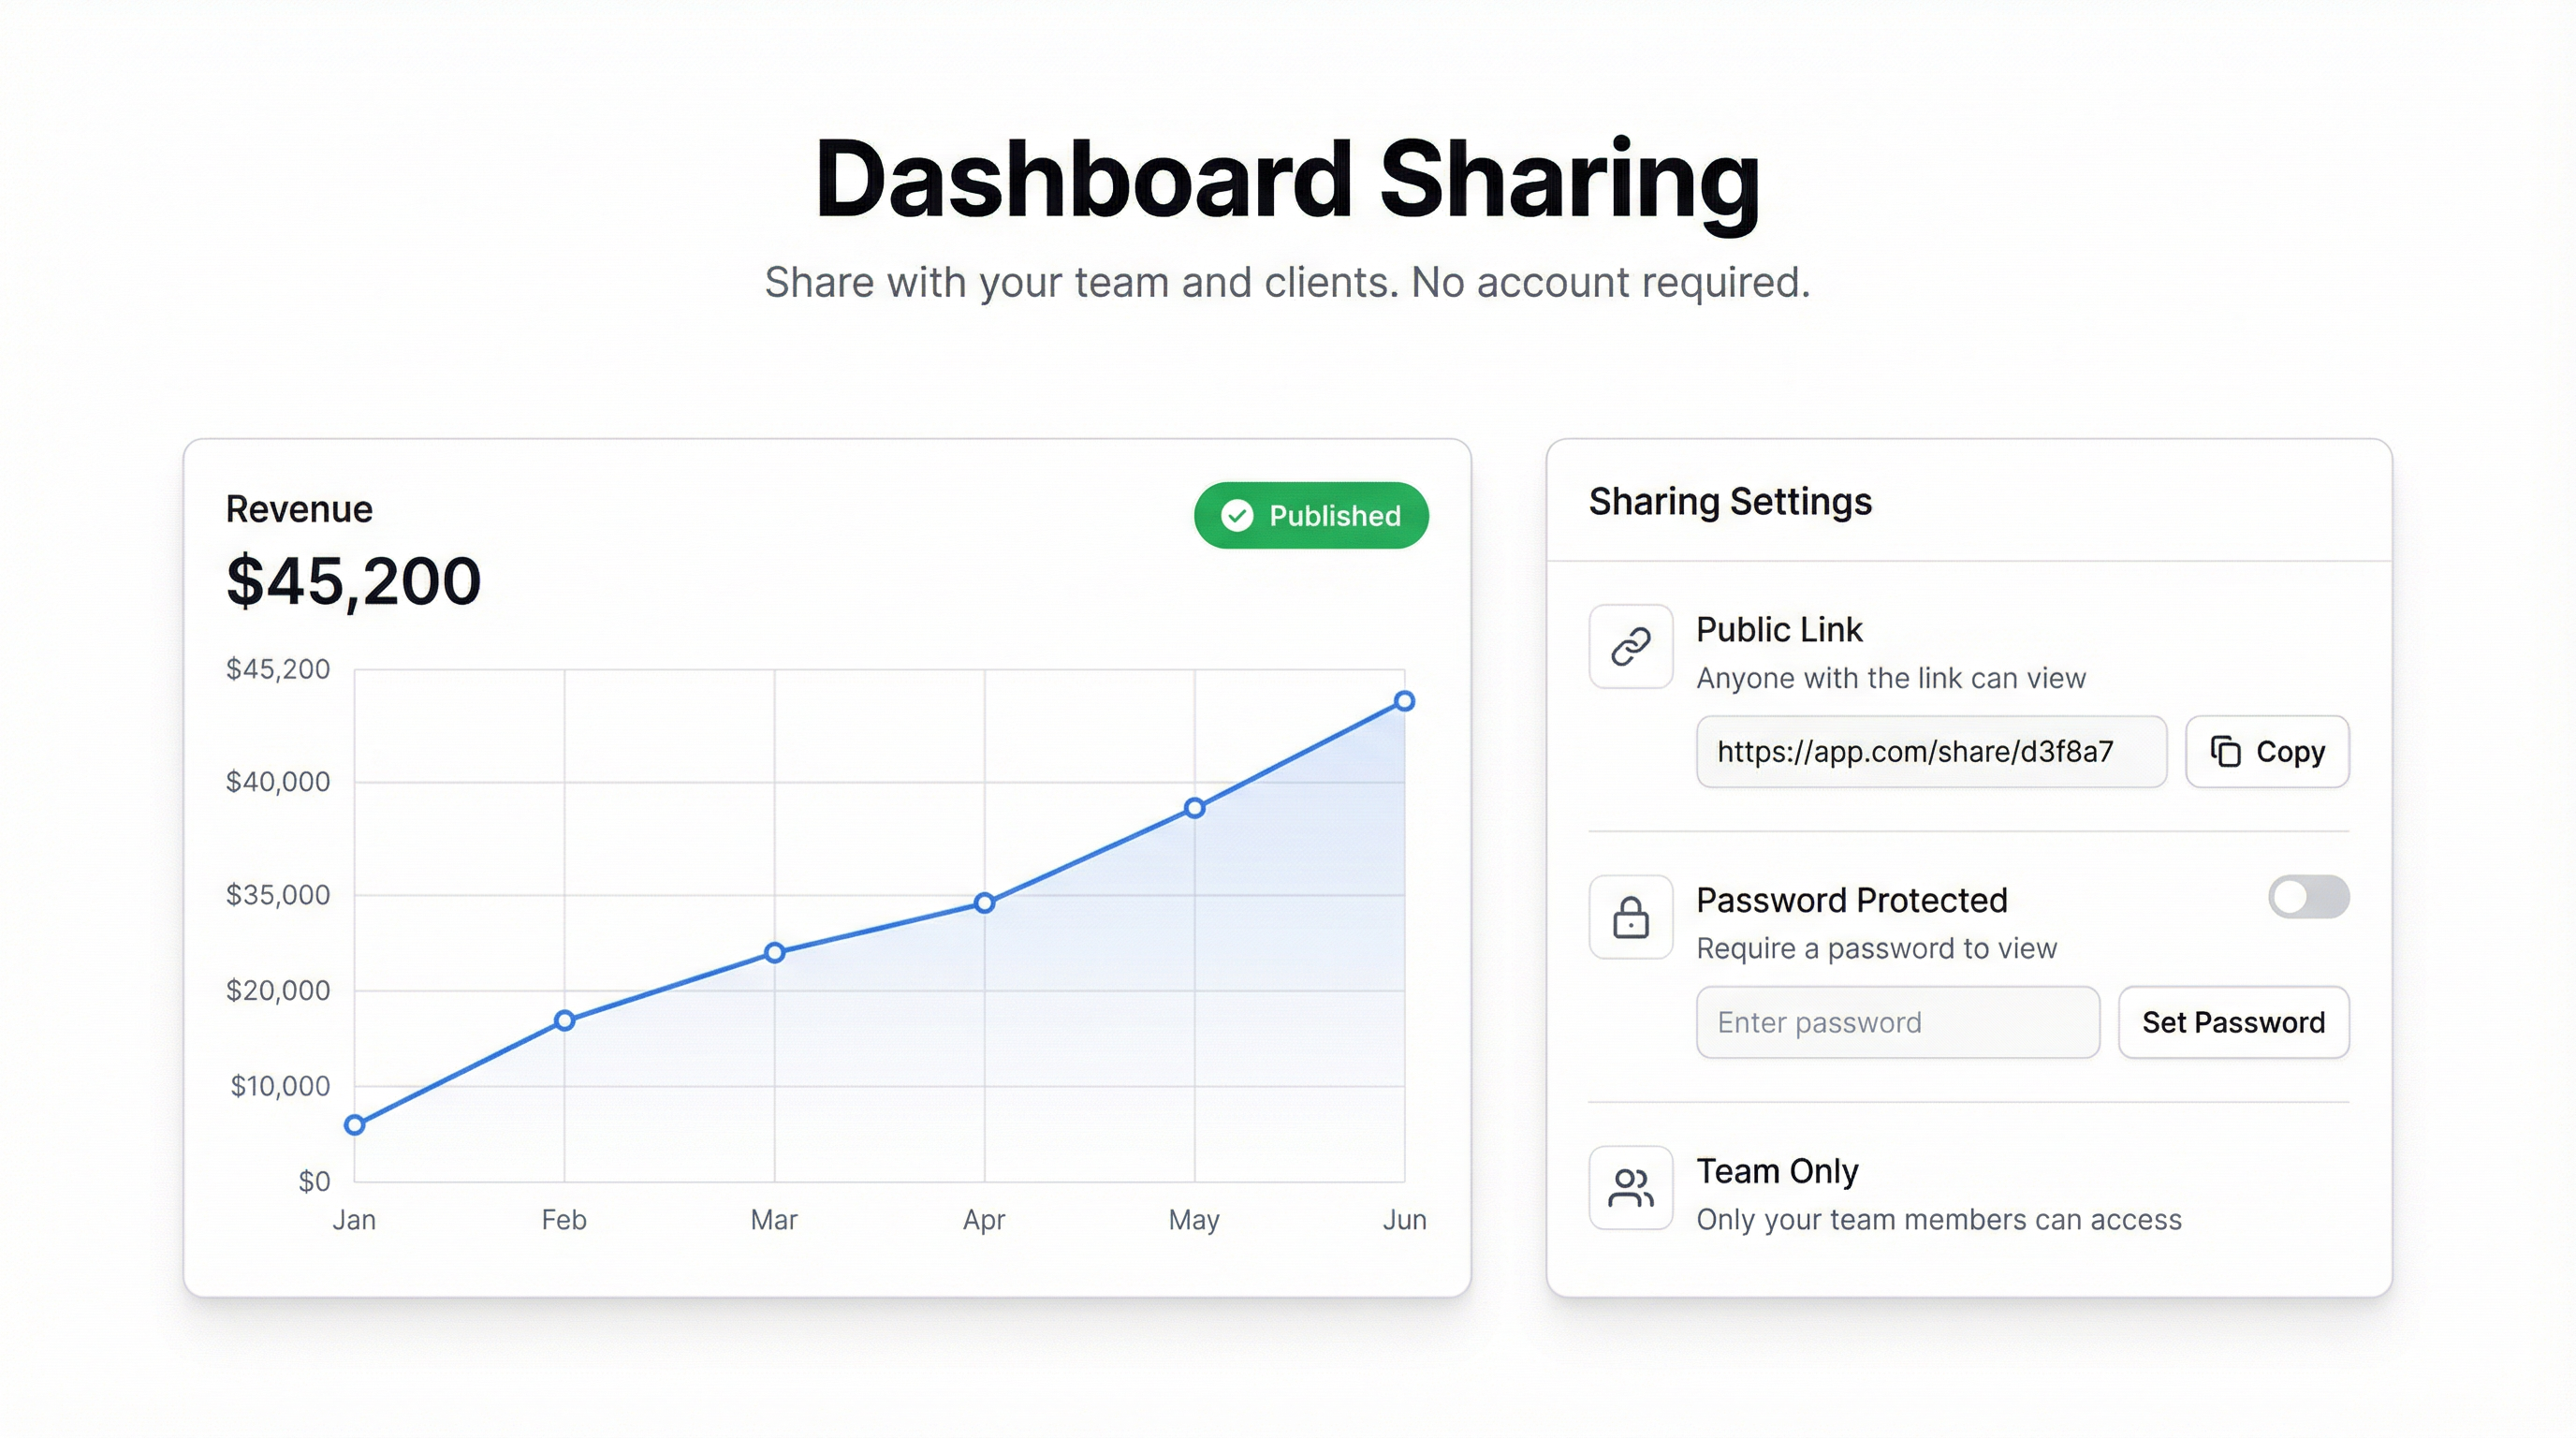
Infograph’s public share links work the first way. Anyone with the link can view the dashboard — no account required. You can optionally set a password so it stays private to the people you send it to.
3. Live dashboards vs. snapshots
This distinction matters more than most people realise.
A live dashboard updates as your underlying data changes. Connect a Google Sheet, someone edits a row, the chart reflects it. The person viewing the dashboard sees current numbers every time they load it.
A snapshot freezes the dashboard at a point in time. The visuals stay exactly as they were when you published the snapshot — useful for board reports, quarterly reviews, or any situation where you want to preserve a specific view of the data.
Both have legitimate uses. The mistake is assuming live is always better. For a board pack covering Q4 performance, you want a snapshot — the numbers should match what you presented in the meeting, not change overnight.
Infograph supports both. When you publish a dashboard, you choose: live (reflecting data changes) or snapshot (frozen at publication time).
4. Embedded dashboards
Sometimes you want a dashboard inside another tool — a Notion page, a client portal, a company website. This requires an embed, usually an iframe or a JavaScript snippet.
Not every dashboard tool makes this easy. Some lock embedding behind enterprise plans. Some produce embeds that look broken on mobile. The best ones give you a clean embed URL that works anywhere.
What to Look for in a Dashboard Sharing Tool
A few things worth checking before committing to any tool:
Viewer access without forced accounts. If sharing with external people requires them to create accounts, that’s friction that will kill adoption. Clients won’t do it.
Password protection. Public links are convenient. Password-protected links are better when the data is sensitive. You want both options.
Live vs. snapshot control. The tool should let you choose — not default to one and make the other impossible.
Mobile-readable output. Your client is going to open that link on their phone at some point. Make sure the dashboard renders properly.
Revocable links. If a client relationship ends or a dashboard becomes outdated, you should be able to kill the link without deleting the dashboard.
How Infograph Handles Sharing
This is worth covering specifically because it’s one of the things we built with intention.
When you’re ready to share a dashboard in Infograph, you click “Publish”. You then choose:
- Public — anyone with the link can view it
- Password protected — viewers need a password you set
- Team only — restricted to members of your Infograph team account
You also choose whether the shared dashboard is live (updates with your data) or a snapshot (frozen at publish time).
The share link is immediate. You can revoke it, regenerate it, or change the access settings at any time. No waiting, no approval flows.
For clients, the experience is: they get a link, they open it, they see a polished dashboard. No account creation. No configuration. Just the data they need.
That’s what sharing a dashboard should feel like.
If you haven’t built a dashboard yet and want to see how this works — start with your data in Infograph. Connect a spreadsheet, describe what you want to see, and you’ll have something shareable in a few minutes.