Excel Online has hundreds of millions of users. Most of them are still taking screenshots of their spreadsheets to paste into slide decks, or exporting CSVs to feed into whatever dashboard tool they’re using this quarter.
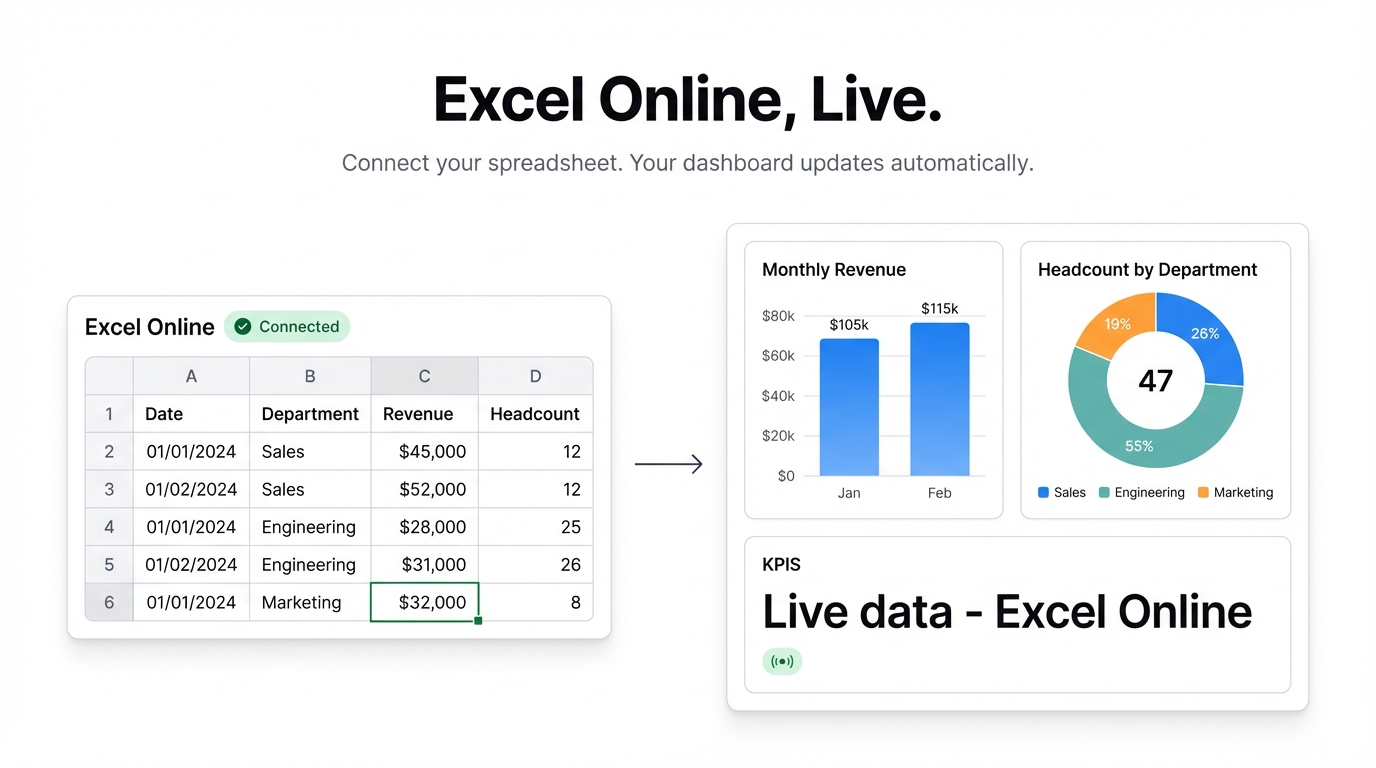
There’s a better way. Connect Excel Online directly to Infograph and your dashboard updates the moment your spreadsheet does.
How the Connection Works
Infograph connects to Microsoft OneDrive via your Microsoft account. Once you’ve linked your account, you can point Infograph at any Excel workbook you have access to — personal, shared, or organizational.
The connection is live. When someone edits a cell in the workbook, the dashboard reflects it the next time it refreshes. No new exports. No manual updates. No “wait, are these numbers current?” conversations in your next standup.
Setting It Up
1. Open Infograph and create a new dashboard.
Go to app.infograph.ai and click “New Dashboard”. Instead of uploading a file, click “Connect a data source.”
2. Choose Microsoft Excel.
You’ll be prompted to log in with your Microsoft account. Infograph requests read-only access to your OneDrive files — it cannot modify your spreadsheets.
3. Select your workbook and sheet.
You’ll see your OneDrive files. Pick the workbook, then the specific sheet. Infograph reads the column headers and shows you a preview of the parsed data.
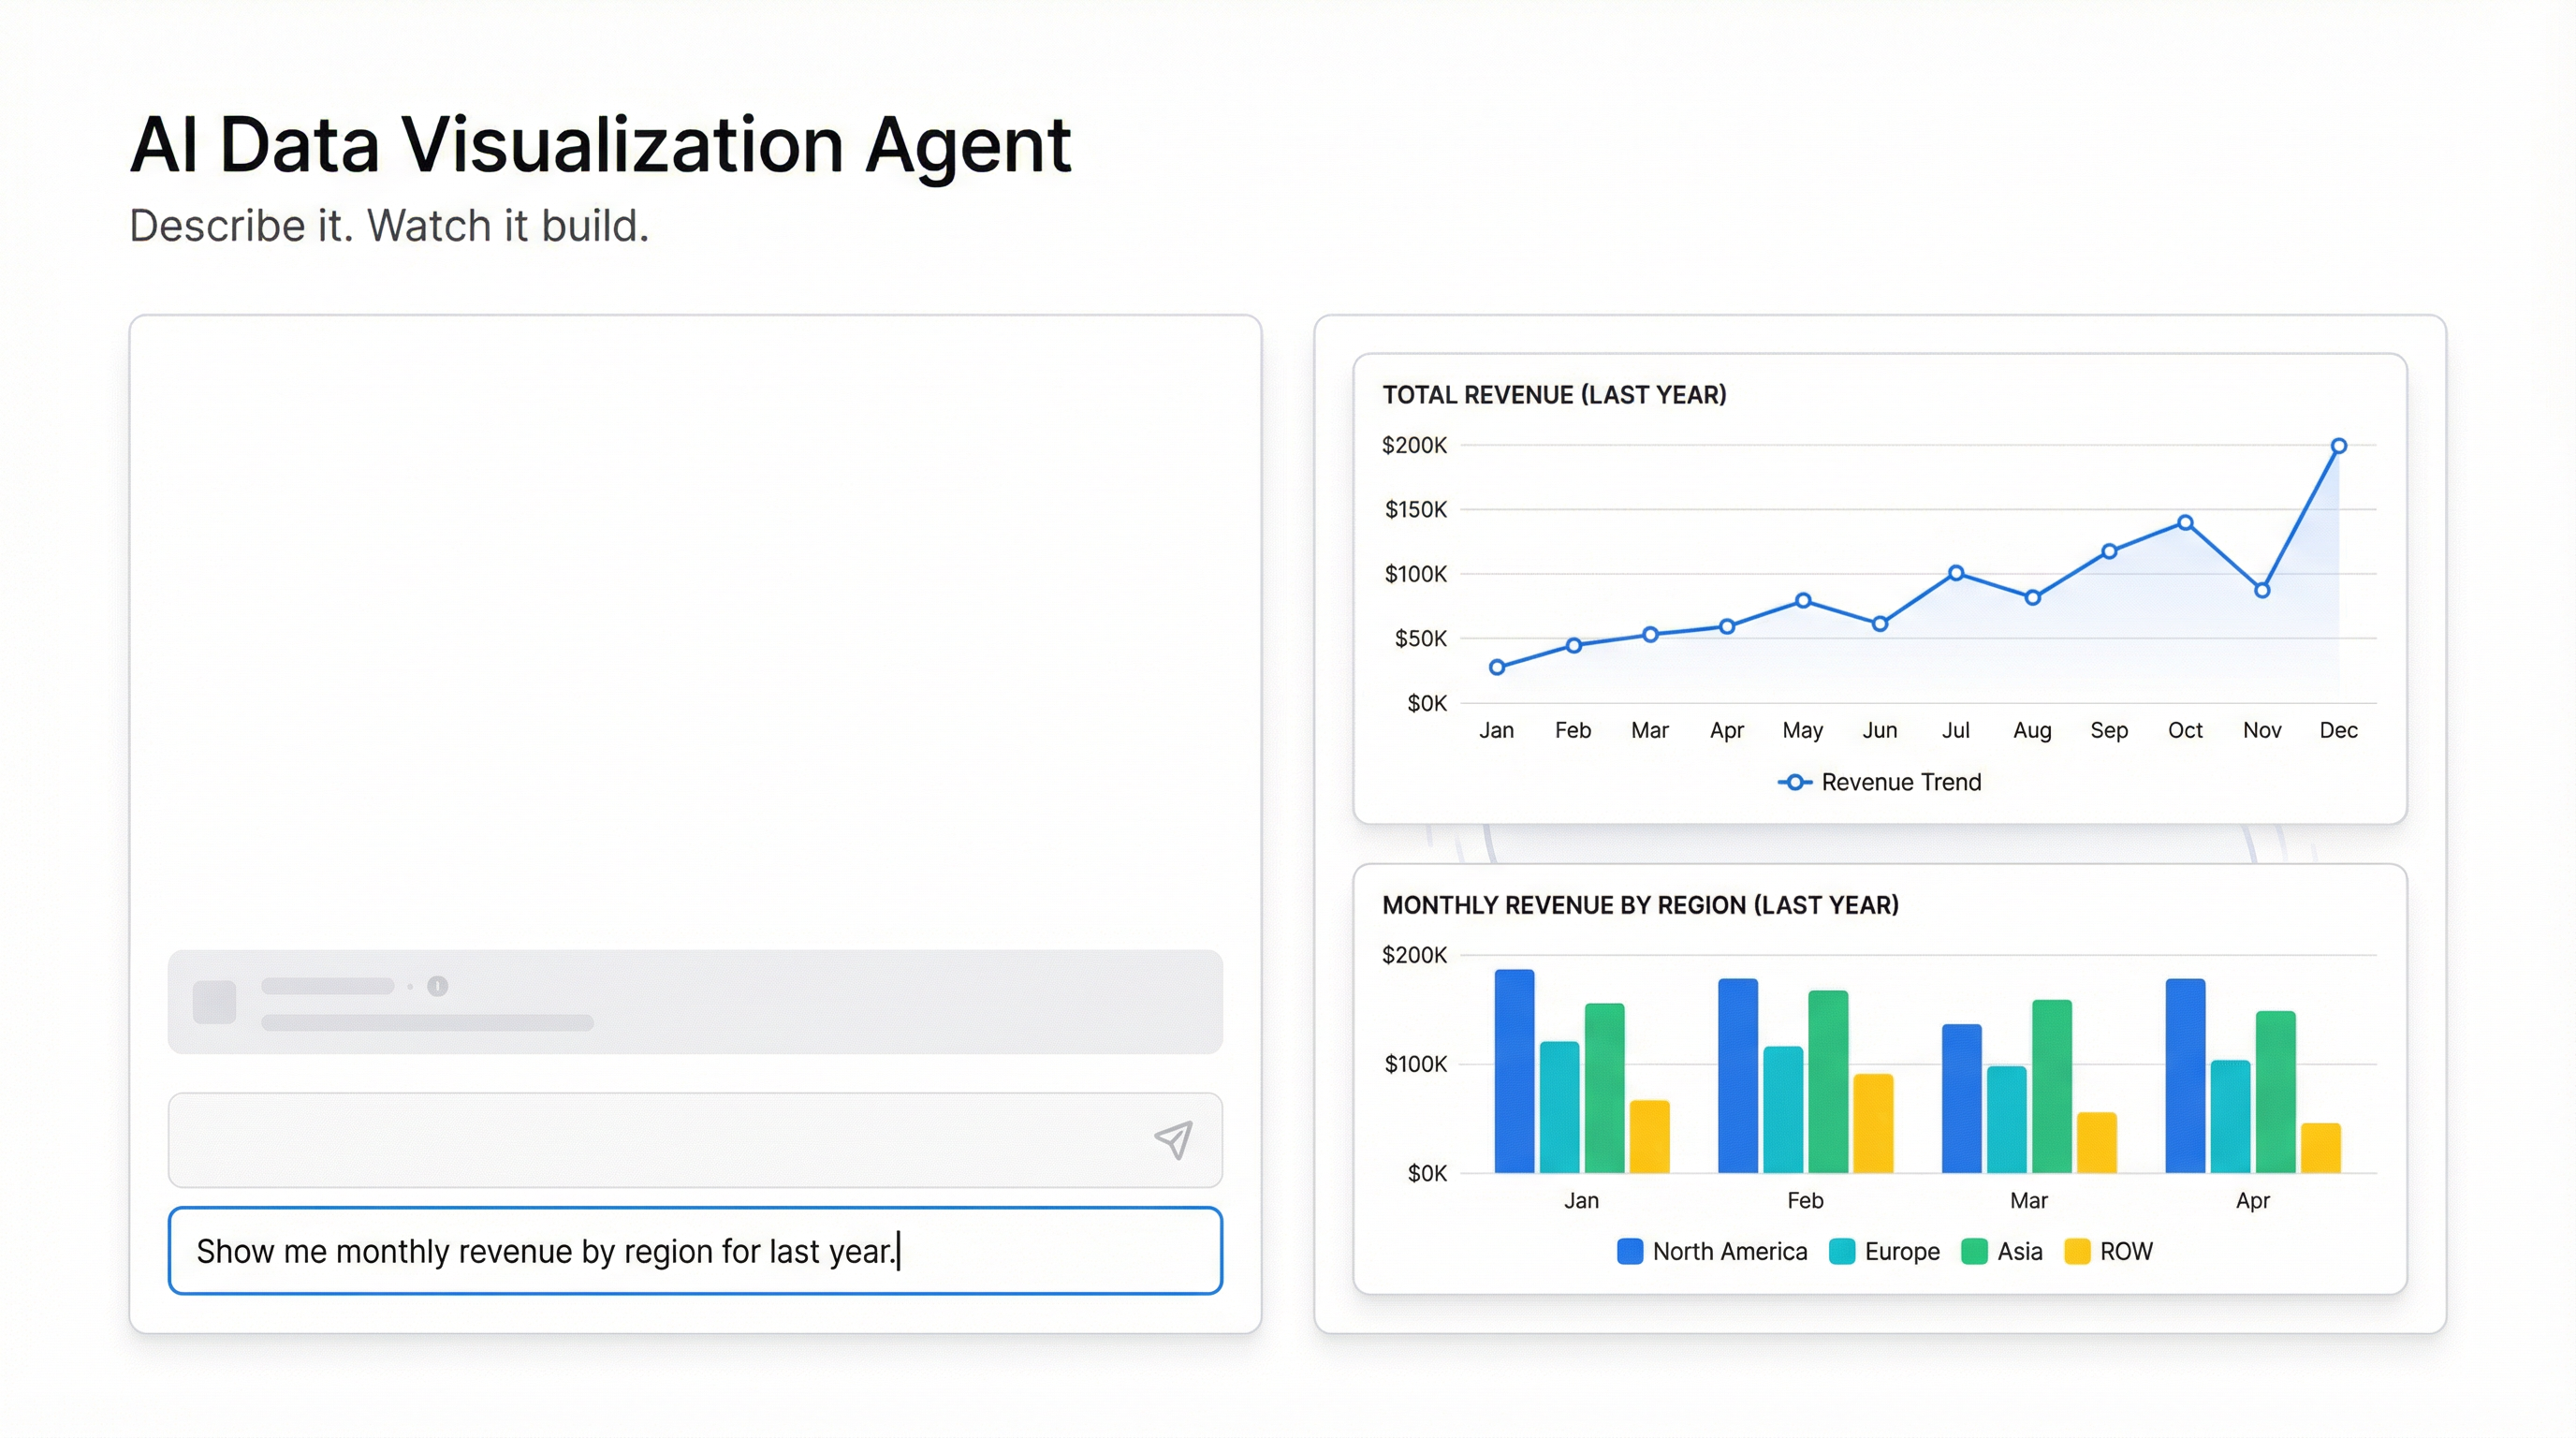
4. Describe your dashboard.
Type what you want: “Show monthly revenue as a bar chart, headcount by department as a donut, and a summary table of KPIs from the top row.” The AI maps your prompt to your actual column names.
That’s it. Your dashboard is live.
What Works Well
Excel Online connections are particularly useful for finance teams who maintain a master spreadsheet that gets updated weekly, sales teams tracking pipeline data in a shared workbook, and ops teams with rolling 13-week views that someone updates every Monday.
In all these cases, the alternative is a recurring manual process: export, upload, regenerate. With a live connection, the dashboard just works.
Column Detection and Schema Changes
Infograph reads your column headers from the first row of the sheet. If your Excel sheet has a complex multi-row header (common in finance templates), the AI can usually figure it out, but flat single-row headers give you the cleanest experience.
If someone adds or renames a column in the workbook, Infograph will detect the schema change and flag it in the dashboard. You may need to re-prompt for any charts that reference the changed column. It’s a minor friction point, but it’s better than silently showing wrong data.
Permissions and Security
Your Microsoft credentials never touch Infograph’s servers. The OAuth flow goes directly to Microsoft — Infograph receives an access token that lets it read your files, nothing more. The token is scoped to read-only.
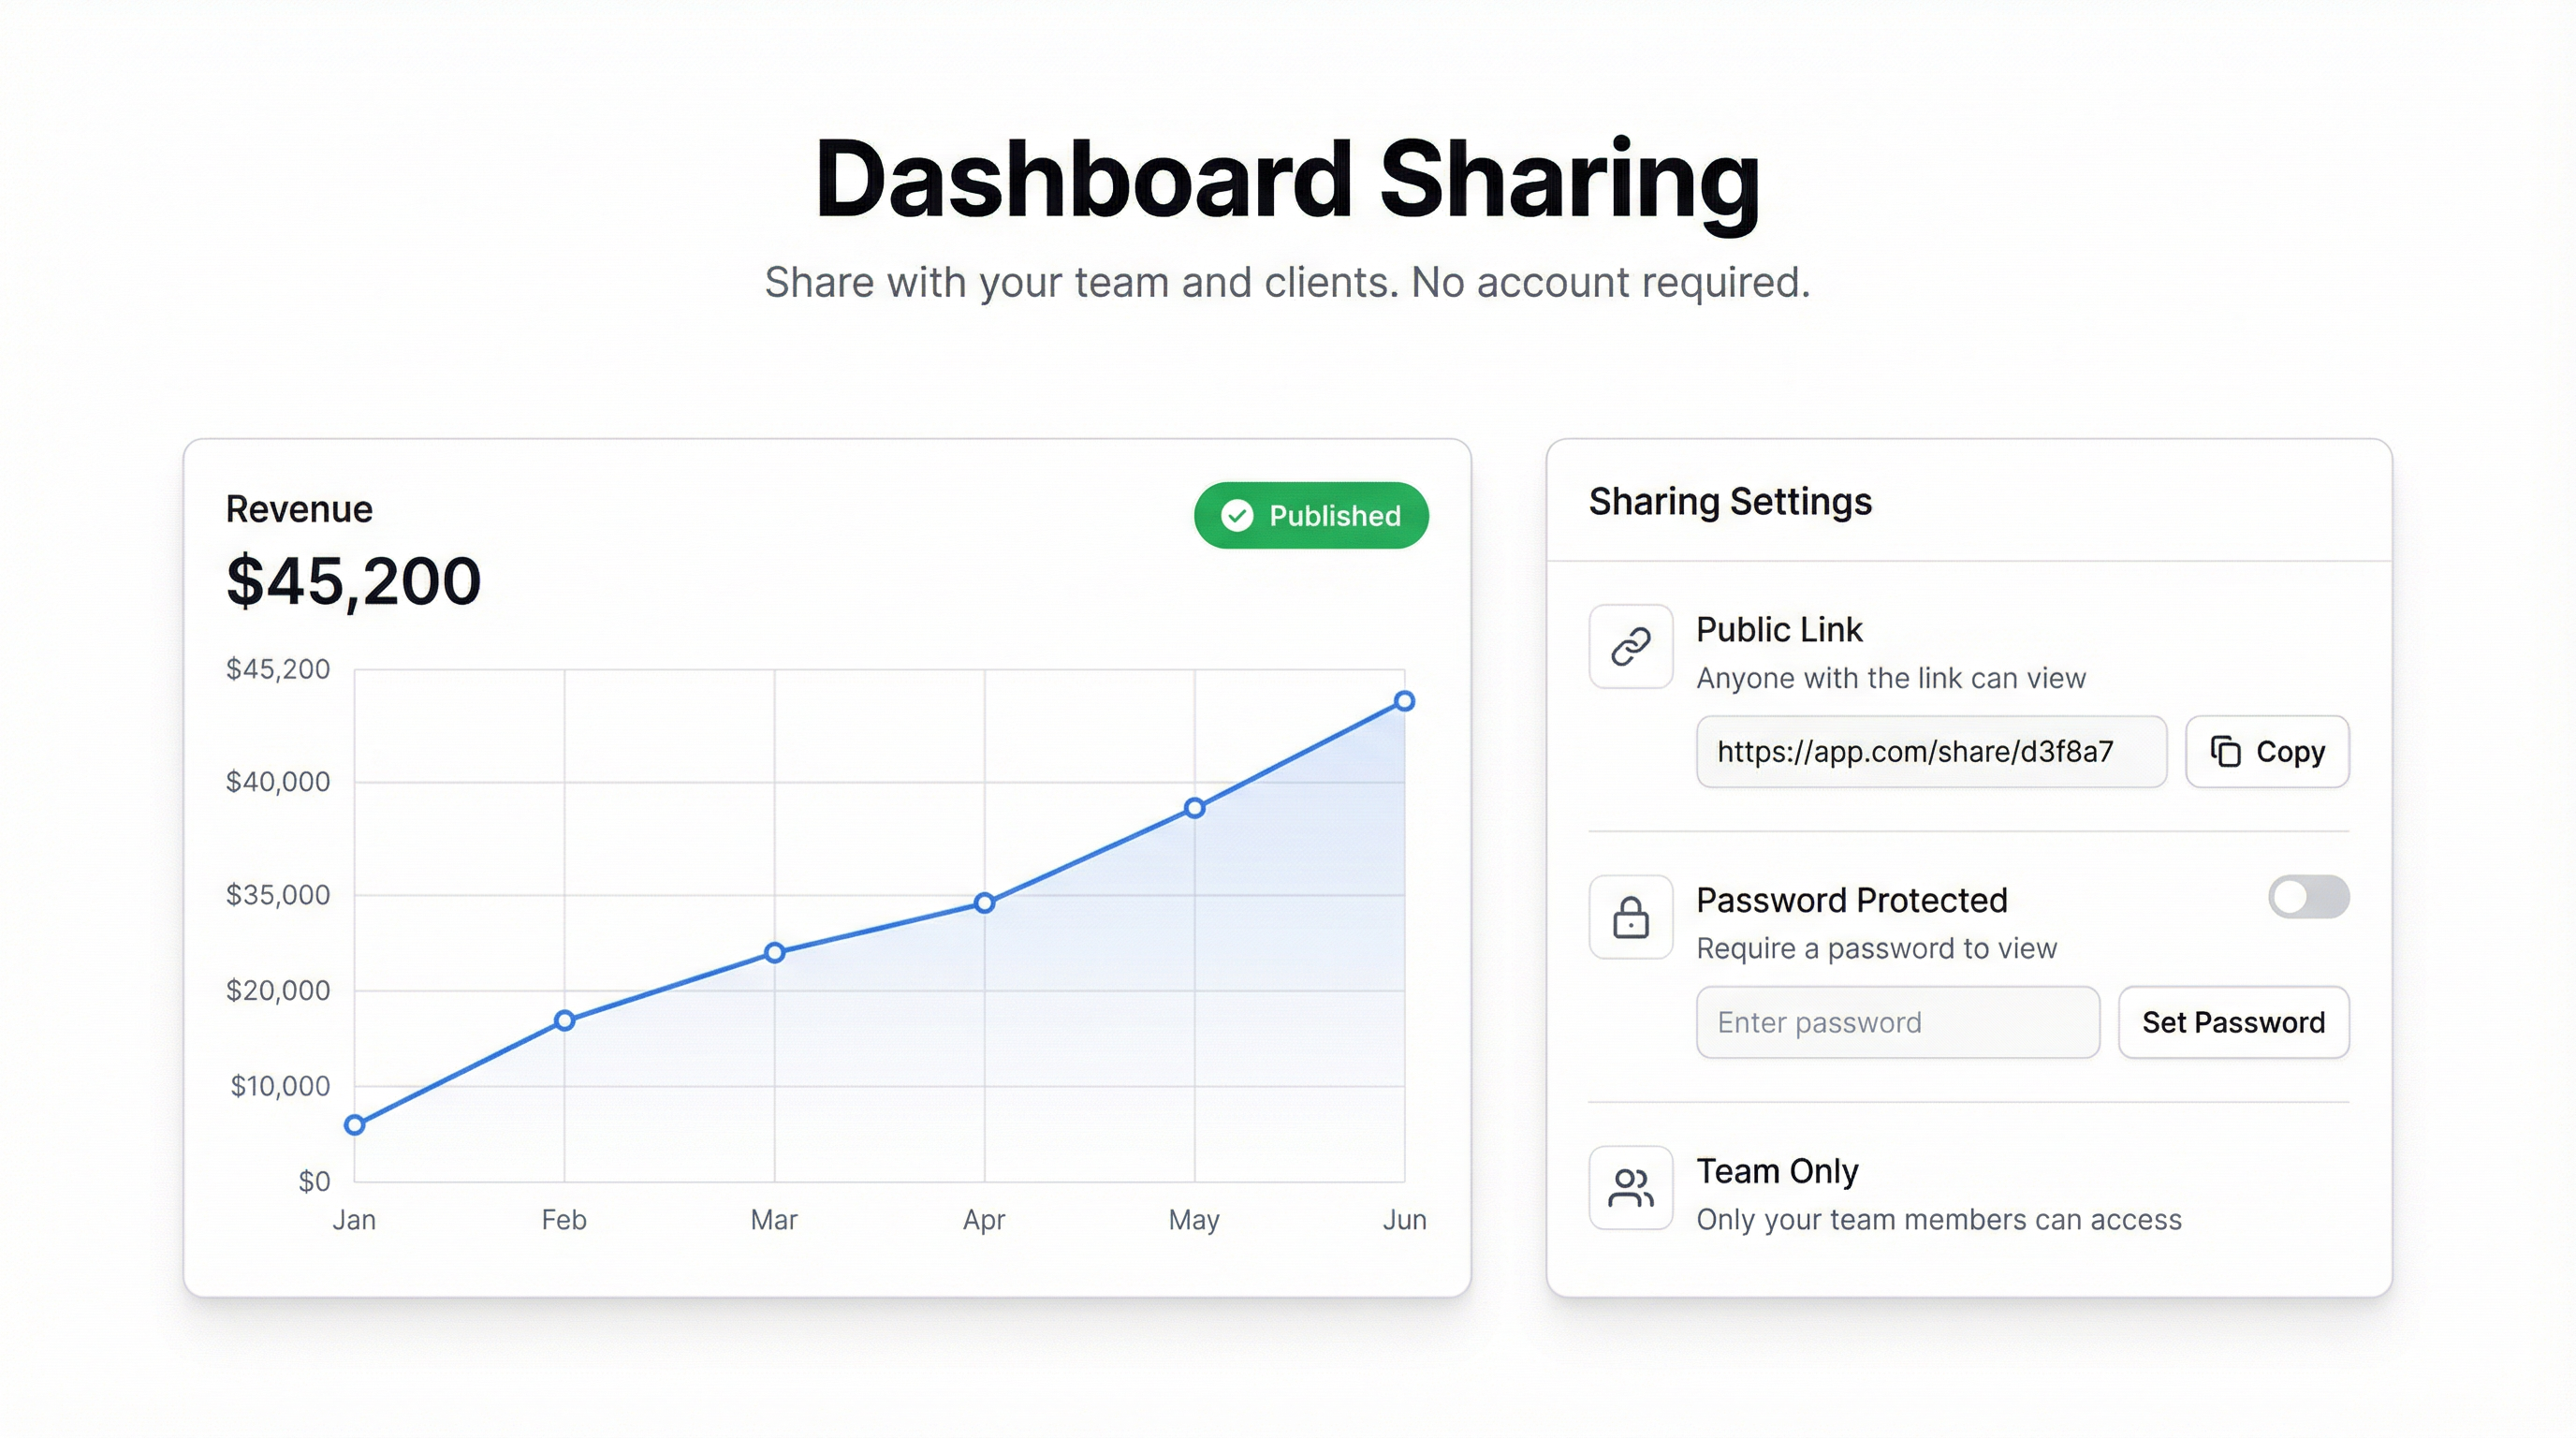
If you’re on a Teams plan, your entire team shares the connection. Changes to the workbook are visible to everyone viewing the shared dashboard, with no additional setup.
Multiple Sheets, One Dashboard
You can connect more than one sheet to a single dashboard. Connect your revenue sheet and your headcount sheet, then ask Infograph to pull charts from each. The AI keeps track of which columns come from which source.
This is useful when your data lives across multiple tabs — common in Excel files that grew organically over years, with one tab per quarter or one tab per department.
Try It
If you have an Excel Online workbook you’re already updating regularly, it takes about two minutes to connect it to Infograph. Start here.
Your spreadsheet stays in Excel. Your dashboard stays current.