At some point, running a startup from intuition stops working. You’re managing too many moving parts, too many spreadsheets, and too many conflicting numbers in different tools. Your investor asks about MRR. Your co-founder wants to know CAC. You just want to know if you’re going to make payroll in 90 days.
The solution isn’t hiring a data analyst. It’s a startup dashboard — one screen that shows everything you need to make decisions, updated automatically from the data you already have.
What a Startup Dashboard Should Track
The mistake most founders make is trying to track everything. A dashboard with 40 metrics isn’t a dashboard — it’s a spreadsheet with a different layout. Pick the 8-12 metrics that actually drive your decisions and build around those.
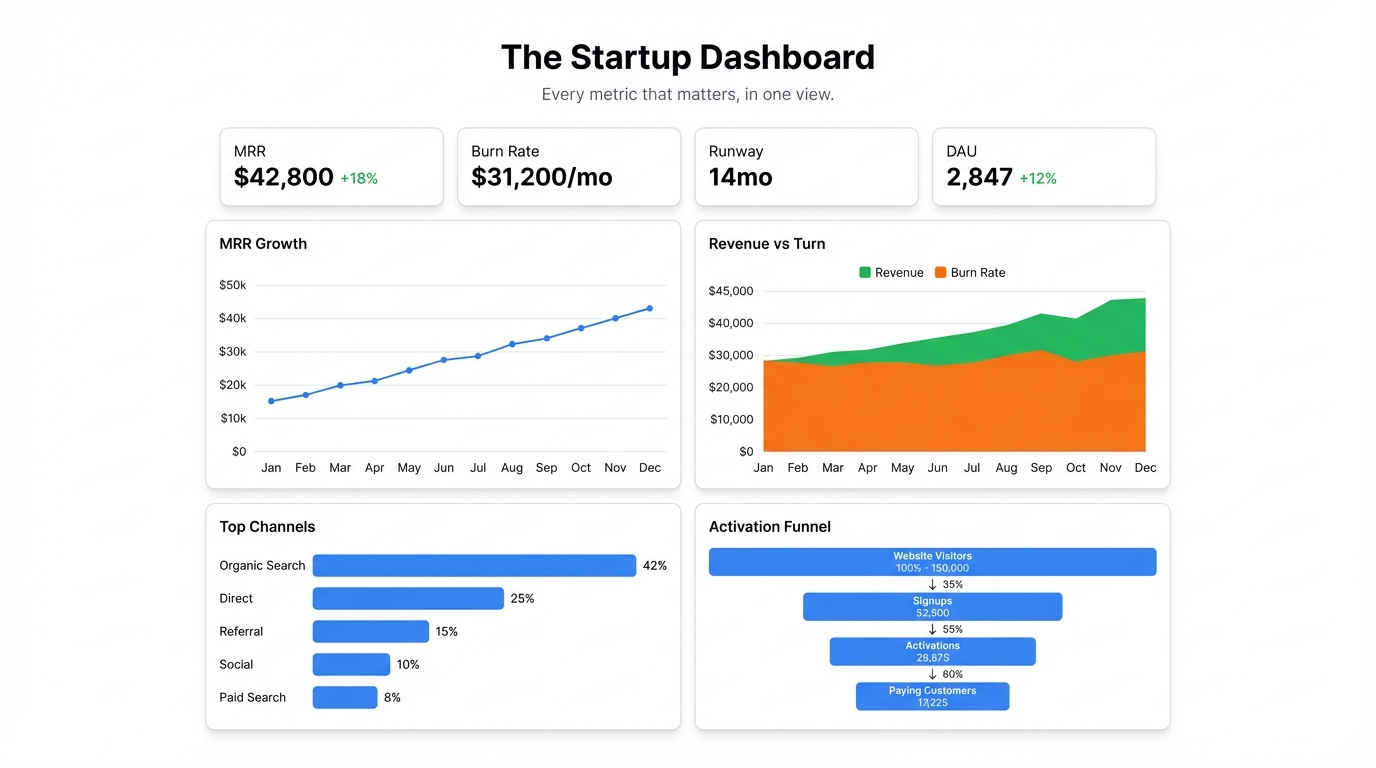
Revenue health. MRR or ARR, growth rate month-over-month, and the breakdown by plan or segment. If you have one chart to check every morning, this is it.
Acquisition. New signups or new customers this month, cost per acquisition if you’re paying for growth, and the trend over time. Are you growing faster or slower than last month?
Retention. Churn rate, monthly active users, or whatever your product uses as the primary engagement signal. Acquisition without retention is a leaky bucket — this number tells you whether the bucket has holes.
Burn and runway. How much you’re spending monthly, how much you have left, and how many months that gives you. Every startup should know their runway without having to calculate it.
Product engagement. DAU/MAU ratio, feature adoption for your core workflow, activation rate for new users. These are the leading indicators — they predict revenue before revenue moves.
You don’t need all of these on day one. Start with the four or five that your team looks at weekly and build from there.
Where Startup Data Actually Lives
Most early-stage startups track their metrics across a handful of tools that don’t talk to each other:
- Stripe or billing platform — MRR, churn, new customers
- Google Analytics or Mixpanel — traffic, activation, feature usage
- Google Sheets — manually maintained growth trackers, financial models, burn rate
The problem isn’t that the data doesn’t exist — it’s that pulling it together requires opening five tabs and doing mental arithmetic. That’s why most founders only look at the numbers when an investor asks for them.
A dashboard consolidates this into one view. The key is getting the data into a format you can connect.
Building Your Startup Dashboard with Infograph
The fastest path: export your core metrics to a single Google Sheet, then connect that sheet to Infograph.
Step 1: Build a Metrics Sheet
Create a Google Sheet with one row per month (or week) and columns for each metric you want to track. Pull MRR from Stripe, DAU from your analytics tool, burn from your financial model. Most of this takes 20-30 minutes to set up.
Once the sheet exists, maintaining it takes 5 minutes a week. And it becomes the single source of truth that both your dashboard and your investor updates draw from.
Step 2: Connect to Infograph
Connect your Google Sheet directly to Infograph. The live connection means whenever you update the sheet — add a new month’s row, correct a number — the dashboard reflects it automatically.
Upload a CSV if you prefer to start with historical data before setting up the live connection.
Step 3: Describe Your Dashboard
Type what you want to see:
“Show MRR as a line chart over the last 12 months. Add a month-over-month growth rate card. Include a bar chart for new customers vs. churned customers each month. Add a burn rate card and runway in months.”
Infograph builds those charts from your data. The AI reads your column names and figures out what maps to what — you’re not configuring field mappings or selecting chart types manually.
Step 4: Refine
Keep prompting until it shows what you actually need. “Break the MRR chart down by plan.” “Add a DAU/MAU ratio card.” “Show a 3-month rolling average on the growth chart.”
Every change is instant. You’re iterating toward the dashboard you want, not fighting a chart builder.
Step 5: Share It
Publish the dashboard. Share it with your co-founder, your team, your board. For investor updates, link to the dashboard instead of sending a slide deck — investors who can see live numbers ask better questions and trust the data more.
Password-protect it for board access on a Teams plan, or keep it public for fully transparent companies.
The Dashboard as Operating Rhythm
The best startup dashboards become part of the weekly operating rhythm. Monday morning: open the dashboard, see where things stand, set priorities for the week. Board meetings: pull up the dashboard instead of building slides. Investor emails: “here’s the link” instead of a static attachment.
When the numbers are always visible, the whole team runs on the same information. That alignment — everyone seeing the same data at the same time — is worth more than the dashboard itself.
The Free Tier
Build your first startup dashboard on Infograph’s free plan — no credit card required. One dashboard, full sharing capabilities, live Google Sheets connection.
The Pro plan adds five dashboards and multiple live connections for $19.99/month — the right fit when you’re tracking metrics across different functions.


