Shopify’s analytics tab gives you a revenue number and a sessions chart. That’s fine for a quick gut-check, but it’s not enough to run a store on. If you’ve ever found yourself exporting CSVs just to figure out which channel is actually driving profit — or copying numbers into a slide deck for a team meeting — you already know the gap.
Here’s how to close it.
What Shopify Analytics Actually Tells You
Shopify’s native reporting is decent at surface-level stats: total sales, sessions, conversion rate, top products. The dashboard gives you trend lines and date comparisons. For a merchant doing $10k/month, that might be enough.
Once you’re past that, the cracks show up fast:
- No cross-channel breakdown. You can see total revenue, but slicing by traffic source, campaign, or referrer requires jumping into separate tools.
- No repeat purchase analysis. There’s no native view showing customer lifetime value or how often your buyers come back.
- No inventory velocity. You can see units sold, but not which SKUs are burning through stock versus sitting still.
- Reporting is siloed. Your team can’t just look at a live dashboard together — someone has to pull the numbers and share them.
None of this is Shopify’s fault. They built a commerce platform, not a BI tool. The data you need is all there — it just needs a better front-end.
The Metrics That Actually Matter
Before building anything, get clear on what you’re tracking. For most ecommerce operators, these are the ones worth watching daily:
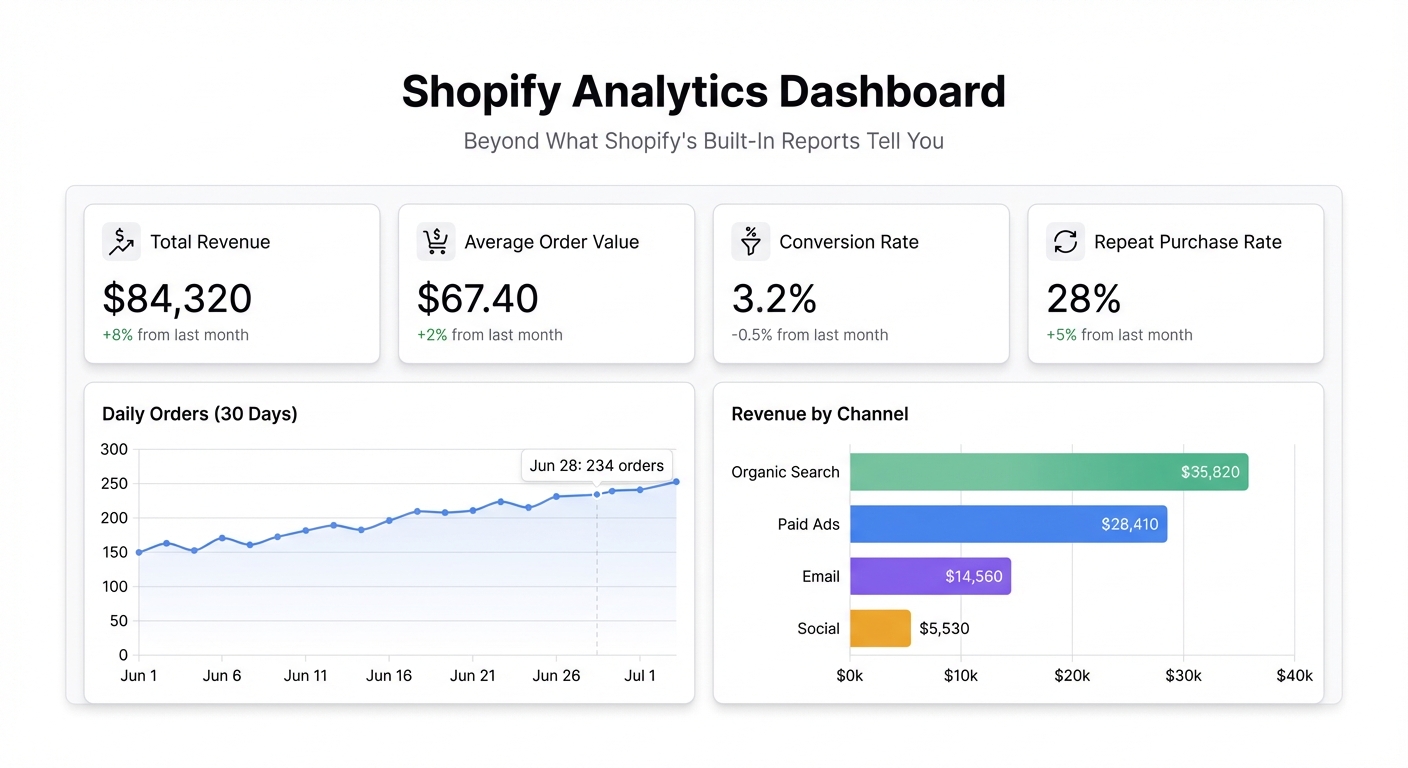
Revenue by channel — Paid search, organic, email, direct. Knowing which channel is driving revenue (not just traffic) is the difference between scaling what works and spending money on what feels good.
Conversion rate by source — Not all traffic converts equally. A 3% blended conversion rate can hide a 6% email rate and a 1% paid social rate. You want to see that spread.
Average order value (AOV) — Flat AOV over time means your upsell and bundle strategies aren’t working. AOV by channel often tells you which customers are buying intentionally versus impulse.
Repeat purchase rate — The percentage of orders from returning customers. This is one of the most honest signals of product-market fit. A store with 40% repeat buyers is in a fundamentally different position than one with 10%.
Inventory velocity — Units sold per day by SKU. This tells you what to reorder before it’s urgent, not after it’s a problem.
Exporting Your Shopify Data
Shopify lets you export almost everything as CSV. Here’s what to grab:
- Orders export — Go to Orders → Export. Choose “All orders” and export as CSV. This gives you order-level data including channel, customer email, line items, and totals.
- Products export — Go to Products → Export. This gives you SKU-level data including inventory counts.
- Customers export — Go to Customers → Export. Includes order count and total spend per customer, which is what you need for repeat purchase rate.
For a live dashboard that doesn’t require re-exporting every week, you can connect your Shopify reports to a Google Sheet using one of the many Shopify → Sheets connectors, then connect that sheet directly to Infograph. Your dashboard updates automatically whenever the sheet refreshes.
Building the Dashboard in Infograph
Once your data is ready, head to app.infograph.ai and upload your CSV (or connect your Google Sheet). Then describe what you want in plain English:
“Show me revenue by traffic source as a bar chart, daily orders as a line chart, AOV over the last 30 days, and a table of my top 10 products by units sold this month.”
Infograph reads your data, figures out the right columns, and builds the dashboard. The whole thing takes under a minute. If a chart isn’t quite right, you can type another instruction — “split the revenue chart by new vs returning customers” — and it updates.
The result is a clean, visual dashboard with all your key metrics in one view. No formulas to maintain. No chart-building UI to fight with.
Sharing It With Your Team
This is where a custom dashboard beats Shopify’s native analytics for team reporting.
Instead of pulling numbers before every Monday standup, you publish the dashboard once and send the link. Your team can check it any time. If you’ve connected a live Google Sheet, the numbers are always current — no manual refreshes.
You control who sees it: public link, password-protected, or restricted to your team account. If you’re reporting to investors or an agency, you can share a snapshot so they see the numbers as of that date rather than a live view.
The alternative — screenshotting Shopify analytics and pasting it into Notion or Slides — works once. It doesn’t scale when you have a team asking for numbers every week.
A Better Way to See Your Store
Shopify gives you the data. What it doesn’t give you is a clean, shareable view of the metrics that tell you whether the business is healthy. Building that view used to take a BI tool, a data person, and a few hours. Now it takes a CSV and a plain-English description.
If you’re running a Shopify store and you’ve ever felt like you’re flying blind between your ad platform, Shopify, and whatever spreadsheet you cobbled together — try building the dashboard you actually want.


