Most businesses run on five or six spreadsheets, a Slack channel full of screenshots, and a weekly “how are we doing?” meeting that could’ve been a dashboard.
A good business dashboard replaces all of that. Not because meetings are bad, but because when everyone can already see the numbers, the meeting becomes about decisions instead of updates.
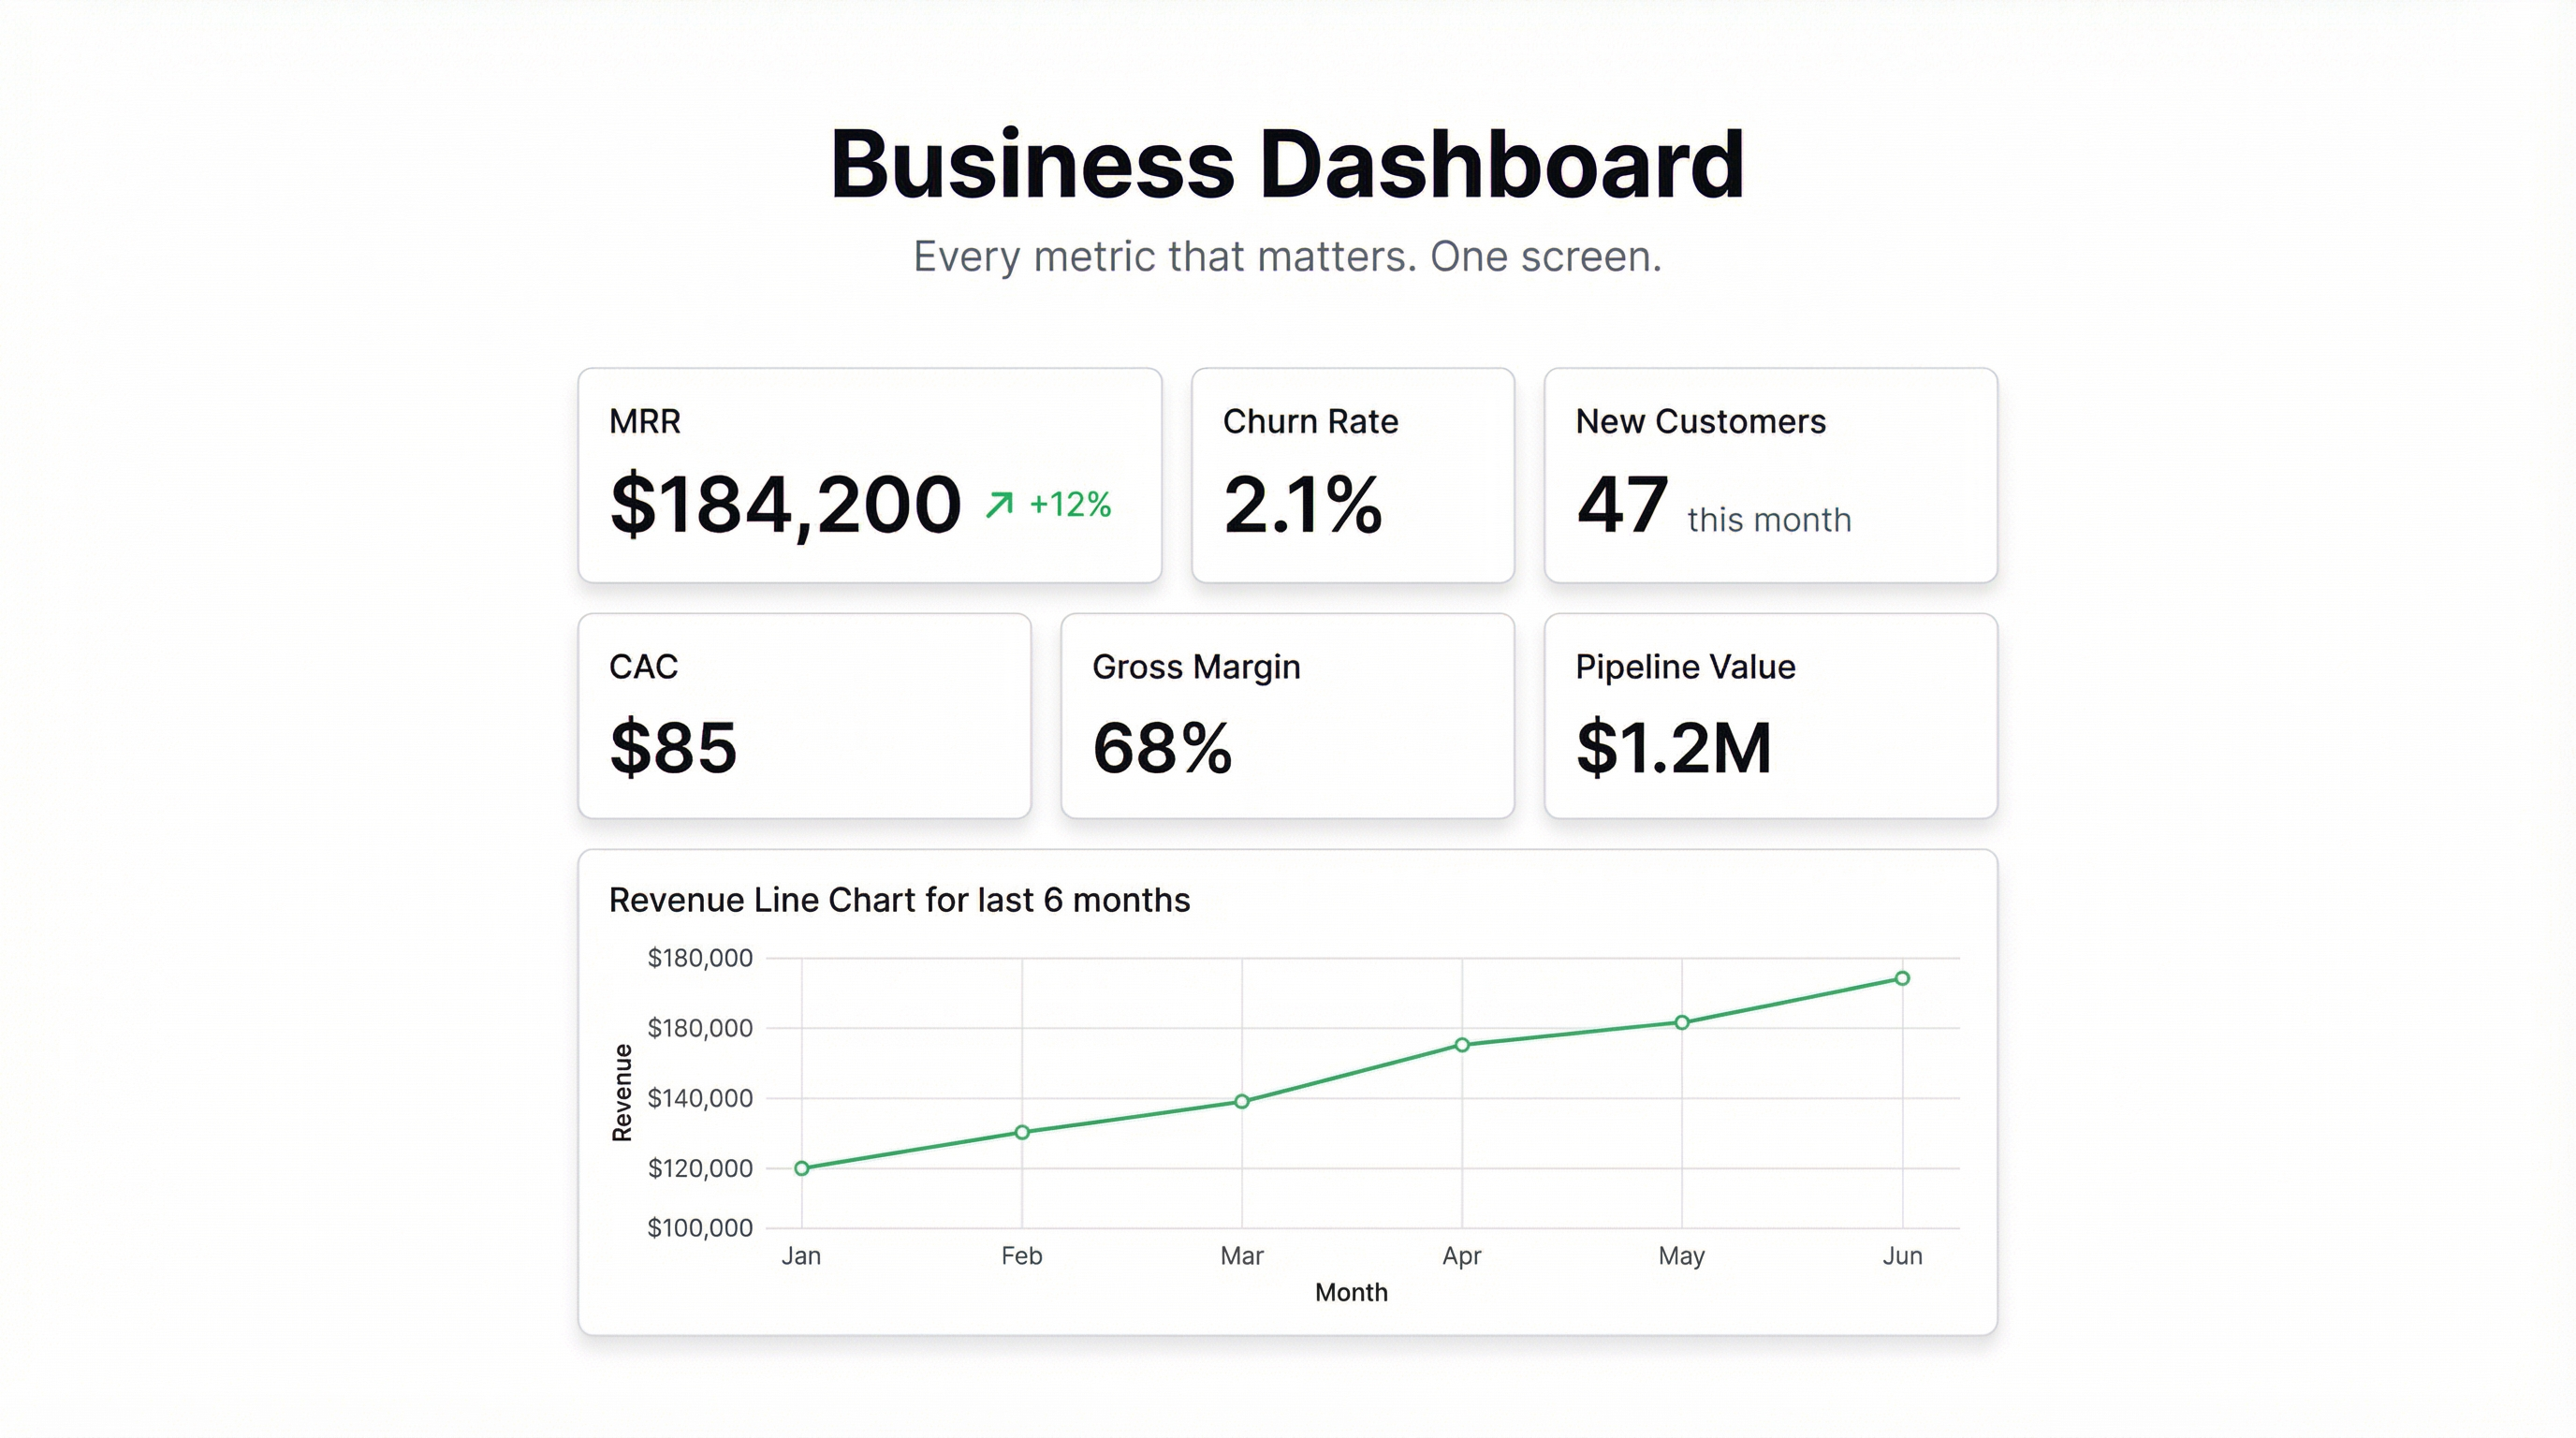
Here’s what a business dashboard actually needs — and how to build one without hiring a data analyst.
What Goes on a Business Dashboard
The temptation is to put everything on it. Revenue, costs, headcount, web traffic, support tickets, social media followers. Resist that.
A business dashboard should answer one question: Are we on track?
That means it needs the handful of metrics that actually tell you whether the business is healthy. For most companies, that breaks down into four areas:
Revenue and financial health
- Monthly recurring revenue (MRR) or monthly revenue
- Revenue growth rate (month-over-month)
- Gross margin
- Burn rate (for startups)
Customer and sales performance
- New customers this month
- Churn rate
- Pipeline value or deals in progress
- Customer acquisition cost (CAC)
Operations and delivery
- Key delivery metrics for your product or service (on-time rate, error rate, cycle time)
- Support ticket volume and resolution time
Team and growth
- Active users or product engagement
- Net Promoter Score if you collect it
- Headcount vs. plan
You probably don’t need all of these. A 10-person SaaS company has different priorities than a 50-person services business. Pick the 8-12 numbers that matter most for your business, and build the dashboard around those.
What Makes a Business Dashboard Actually Useful
A lot of dashboards get built and then ignored. Here’s why: they show what happened, but not whether it’s good or bad.
A date range without a target is just data. You need context.
The best business dashboards do three things:
1. Compare against a target or prior period. Revenue of $180k this month means nothing without knowing whether the target was $160k or $200k. Build in targets from the start.
2. Surface anomalies. If churn rate jumped from 2% to 5% this month, that shouldn’t require someone digging through a spreadsheet to notice. The dashboard should make it obvious.
3. Update automatically. A dashboard you have to manually refresh every Monday morning is a dashboard that doesn’t get used. Live data connections are non-negotiable.
The One-Screen Rule
This sounds obvious, but: your entire business dashboard should fit on one screen without scrolling.
If it doesn’t, it’s not a dashboard — it’s a report. Reports have their place, but they’re not what you want on the TV in the office or in your browser tab at 8am.
One screen forces prioritization. If you can’t decide which 10 metrics matter most, the problem isn’t the dashboard tool — it’s that you haven’t decided what you’re optimizing for.
Building a Business Dashboard Without a Data Team
The traditional approach: hire a BI analyst, spend six weeks modeling data in Power BI or Tableau, and produce a dashboard that nobody uses because it’s too complex to edit.
The faster approach: connect the data you already have and describe what you want to see.
Infograph works from the files and sources your business already uses. Connect a Google Sheet with your financial data, or upload a CSV export from your CRM. Describe the dashboard in plain English — “show me MRR, churn rate, and new customers this month vs last month” — and the dashboard builds itself.
It’s not a simplified version of a BI tool. It’s a different approach: start with a question, end with an answer, skip the data modeling.
If your data is already in a spreadsheet (and for most small businesses, it is), you can have a working business dashboard in a few minutes.
Small Business Dashboard vs. Enterprise
For small businesses, the priorities are usually: speed, simplicity, and the ability to share the dashboard with a co-founder or investor without needing them to have accounts in a BI platform.
Enterprise dashboards tend to prioritize depth: drill-down capability, role-based access, integration with databases and data warehouses. The tradeoff is weeks of setup and significant cost.
Most small and mid-sized businesses don’t need the enterprise version. They need something that answers the question “are we on track?” without requiring a dedicated analyst to maintain it.
Sharing the Dashboard
Once the dashboard is built, sharing it is where a lot of tools fall down.
You want to be able to:
- Send a link to your board without requiring them to create an account
- Share a live view with your team that updates automatically
- Password-protect sensitive financial dashboards
Infograph handles all of that. Public links, password-protected sharing, or team-only access. The dashboard stays live as your data updates.
One screen. Eight to twelve metrics. Automatic updates. That’s it.
If you’re still piecing together the state of your business from five different spreadsheets and a Friday afternoon email, that’s the problem to solve. The dashboard is just the solution.


