Every agency and consultant knows the reporting drill. Spend two hours at the end of the month pulling numbers from five platforms, pasting them into a slide deck, writing a summary, and sending a PDF. The client glances at it, asks a question you didn’t anticipate, and you spend another 30 minutes digging out the answer.
There’s a better version of this. A live dashboard the client can check themselves, any time, that always shows current data.
Here’s how to build one.
Why Clients Hate Static Reports
The PDF or slide deck model of client reporting has three fundamental problems.
It’s always stale. The moment you export the data, it starts ageing. By the time the client reads it, the numbers are days or weeks old. If anything meaningful happened since you exported, they don’t know.
It only shows what you chose to include. Clients often have a specific question — “how did the campaign perform on Tuesday specifically?” or “what’s the breakdown by channel?” A static report can’t answer questions you didn’t predict.
It creates more work, not less. A good report generates follow-up questions. Those questions require another round of data pulling, formatting, and sending. For both sides, it’s inefficient.
A live dashboard solves all three. The client sees current data whenever they want. They can answer their own specific questions by looking at the dashboard. And you stop spending half a day a month on report production.
What to Put in a Client Reporting Dashboard
The right metrics depend on what you’re delivering — but most client dashboards share a common structure:
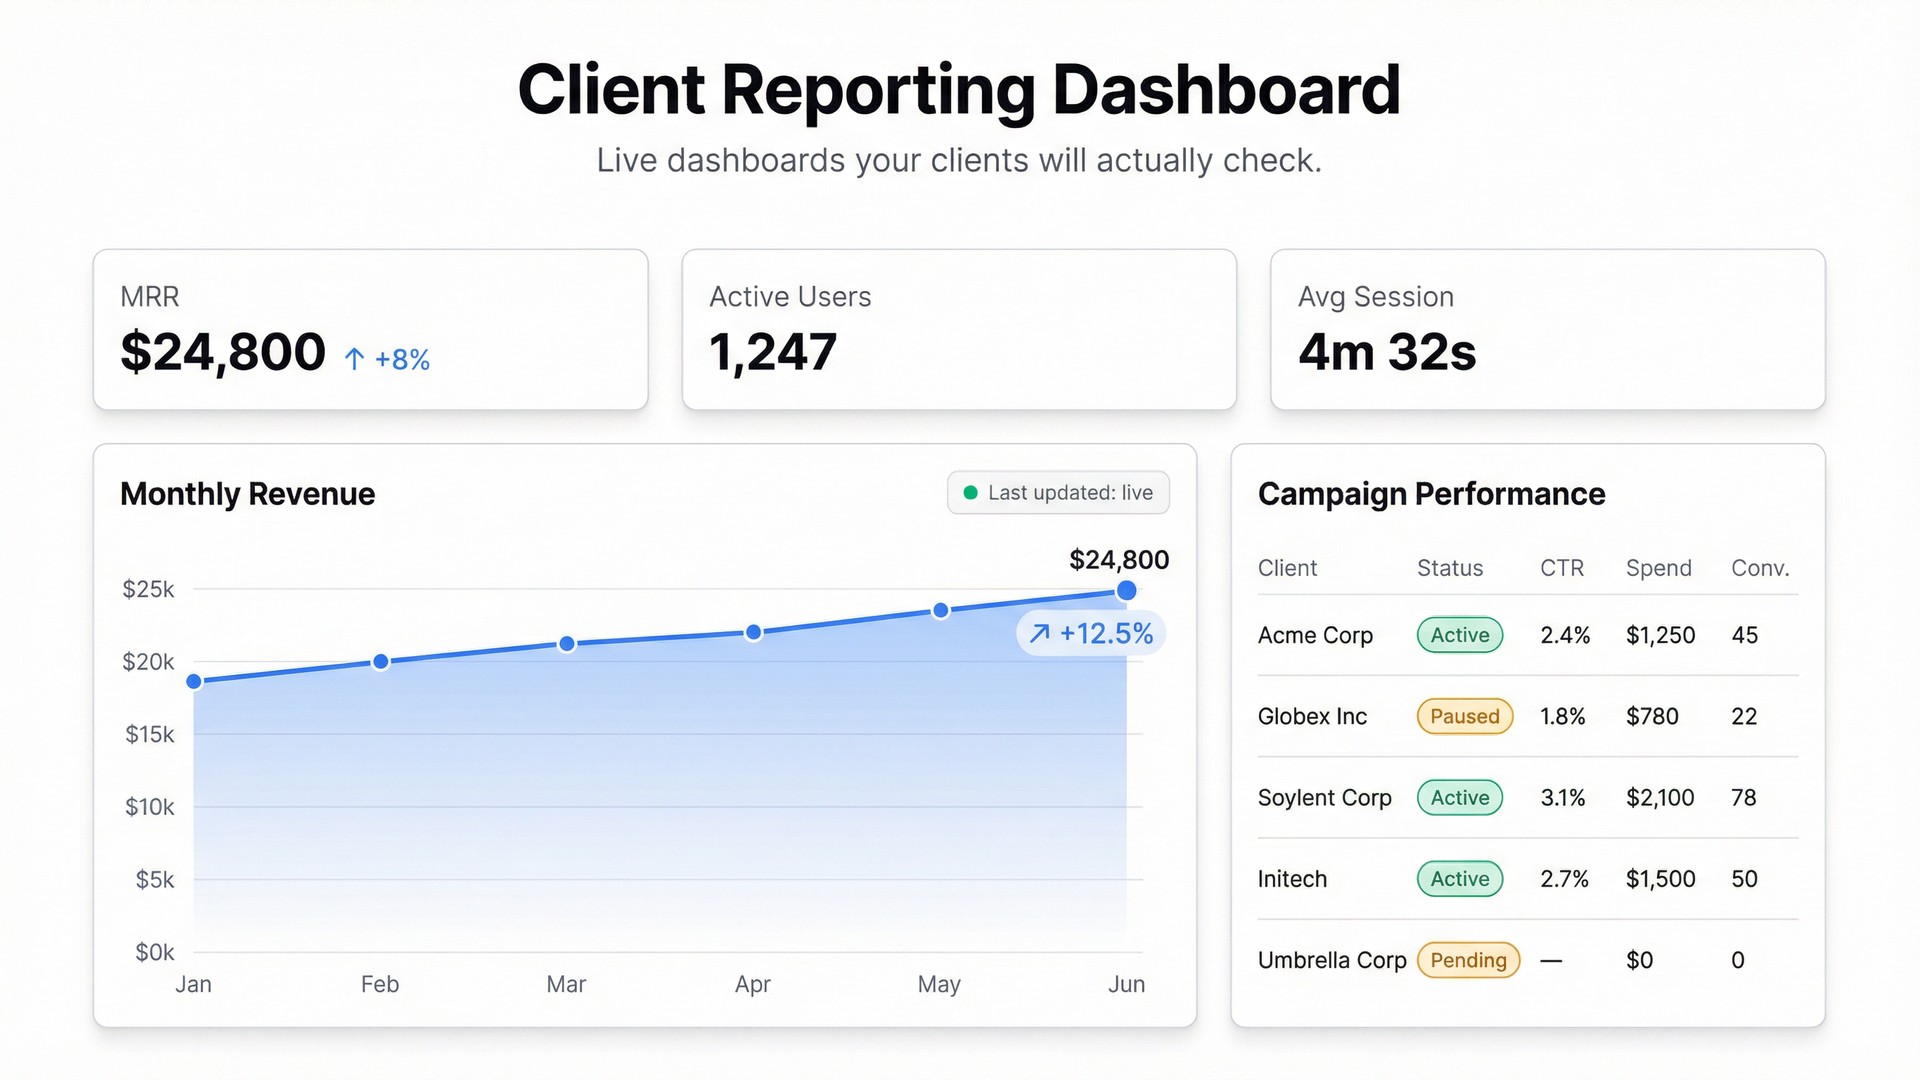
Performance headline. The one number that answers “is this working?” — revenue, leads generated, ad spend vs. results, whatever the client cares about most. Make this big and visible.
Trend over time. A line or bar chart showing the headline metric over the last 30, 60, or 90 days. Context makes numbers meaningful.
Breakdown by dimension. By channel, by campaign, by product, by region — however the client thinks about their business. This is where the follow-up questions usually get answered.
Comparison to goal or last period. Are we up or down? By how much? This is the question behind every monthly call.
Keep it to one screen. A dashboard that requires scrolling and tab-switching is not better than a slide deck — it’s just a digital version of the same problem.
Building a Client Dashboard with Infograph
Most agency data already lives in spreadsheets — Google Sheets exports from ad platforms, manually maintained trackers, CRM downloads. That’s enough to build a live client dashboard.
Step 1: Get the Data into a Connected Sheet
If you’re pulling from multiple platforms, consolidate the key metrics into a single Google Sheet. Set up a simple structure: one row per period (week or month), columns for each metric. This sheet becomes the data source for the dashboard.
If you update this sheet weekly, the dashboard updates automatically when you do. No rebuilding, no re-exporting — just update the sheet.
Step 2: Connect to Infograph
Connect your Google Sheet or upload a CSV. Infograph reads the column structure and understands the data. You don’t need to map fields or configure a schema.
Step 3: Build the Dashboard
Describe what you want:
“Show monthly ad spend vs. leads generated as a grouped bar chart. Add a conversion rate trend line over the last 6 months. Include summary cards for total leads this month and cost per lead.”
Infograph builds it from your data. Refine with follow-up prompts until it shows exactly what the client needs to see.
Step 4: Publish and Share
Hit publish. You get a shareable link. Send it to the client — they can bookmark it and check it whenever they want.
For clients who need access controls, you can restrict the dashboard to password-protected access or limit it to specific users on a Teams plan. For most agency-client relationships, a clean public link works fine.
When you update the source spreadsheet, the dashboard reflects those changes automatically. The client always sees current data. Your monthly report becomes “here’s the link” — not a two-hour production process.
The Practical Result
Agencies that move to live dashboards report two things consistently: fewer client questions per month (because clients can self-serve answers), and better client retention (because live visibility builds trust in a way that monthly PDFs don’t).
The dashboard becomes part of the relationship, not just a deliverable.
The Free Tier
Build your first client reporting dashboard on Infograph’s free plan — no credit card required. One dashboard, full sharing capabilities, live data connection.
The Pro plan adds five dashboards and multiple live connections for $19.99/month — the right fit for agencies managing multiple clients.


