Retail generates more data per square foot than almost any other business type. POS transactions, inventory counts, staff hours, foot traffic, returns, promotions — all of it sitting in separate systems, rarely connected. The manager who wants to know why Tuesday’s numbers dropped usually has to pull three different reports and reconcile them manually.
A retail dashboard doesn’t require a data team. It requires connecting the data you already have and asking the right questions of it.
The metrics that run a retail operation
Sales by time period — hourly, daily, weekly — is the foundation. Not just total sales, but sales against target. A day where you did $12,000 in revenue sounds fine until you see the target was $18,000 and it’s your busiest month. Track actuals vs. plan at every level, because flat numbers without context mislead.
Average transaction value (ATV) tells you whether customers are buying more or fewer items per visit, and whether upsell and cross-sell efforts are working. If promotions drive traffic but ATV drops, the promotion is bringing in price-sensitive buyers who aren’t taking the rest of the basket. That’s a useful thing to know before you run the same promotion again.
Units sold by SKU surfaces your fast movers and your dead stock. Every retailer has items that sell in days and items that sit for months. Sorting by sell-through rate weekly shows you which SKUs need reordering before they go out of stock, and which are tying up cash in inventory that isn’t moving.
Inventory levels vs. reorder point by location is the metric most retailers manage reactively — they notice an item is out of stock when a customer asks for it. Setting reorder thresholds in your dashboard and surfacing items below threshold turns that reactive pattern into a proactive one. You order before you run out instead of after.
Return rate by product reveals quality problems and sizing/fit issues that don’t show up in sales data. High return rates on a specific SKU might mean the product description is misleading, the sizing runs small, or there’s a genuine quality defect. None of this is visible from sales numbers alone.
Revenue by channel matters for retailers selling across physical stores, ecommerce, and marketplaces simultaneously. Knowing that 60% of revenue comes from in-store, 30% from your website, and 10% from Amazon doesn’t just satisfy curiosity — it tells you where to invest in growth and where to protect margin.
The view most retail dashboards miss
Foot traffic conversion rate — the ratio of people who enter the store to people who buy something — is one of the most actionable metrics in physical retail and one of the most undertracked. If conversion drops while foot traffic is flat, the store experience has a problem. If traffic drops while conversion is high, you have a marketing problem. The two metrics together tell you something neither one can tell you alone.
Staff hours vs. revenue by shift shows you whether your labor scheduling is efficient. Overstaffed slow periods and understaffed busy ones are the most common labor cost failure. When you can see revenue per labor hour by shift on a single chart, the scheduling decisions become obvious.
Promotion performance — lift in units sold, change in ATV, gross margin impact — tells you which promotions actually drive profitable revenue versus which drive volume at the cost of margin. A 20% off promotion that moves inventory is fine if you’re clearing dead stock. It’s expensive if it’s training customers to wait for discounts.
Building a retail dashboard in Infograph
Most POS systems (Square, Shopify, Lightspeed, even older systems) export transaction data to CSV. Inventory data usually lives in the same system or a connected one. For ecommerce data, Shopify and WooCommerce have Google Sheets integrations that sync order data automatically.
Export your sales and inventory data, upload it to Infograph, and describe the view you need: “Show me daily sales vs. target for the last 30 days, top 20 SKUs by units sold, and inventory items below reorder point.” The AI builds the dashboard. Add a second view for staff performance or promotion tracking as needed.
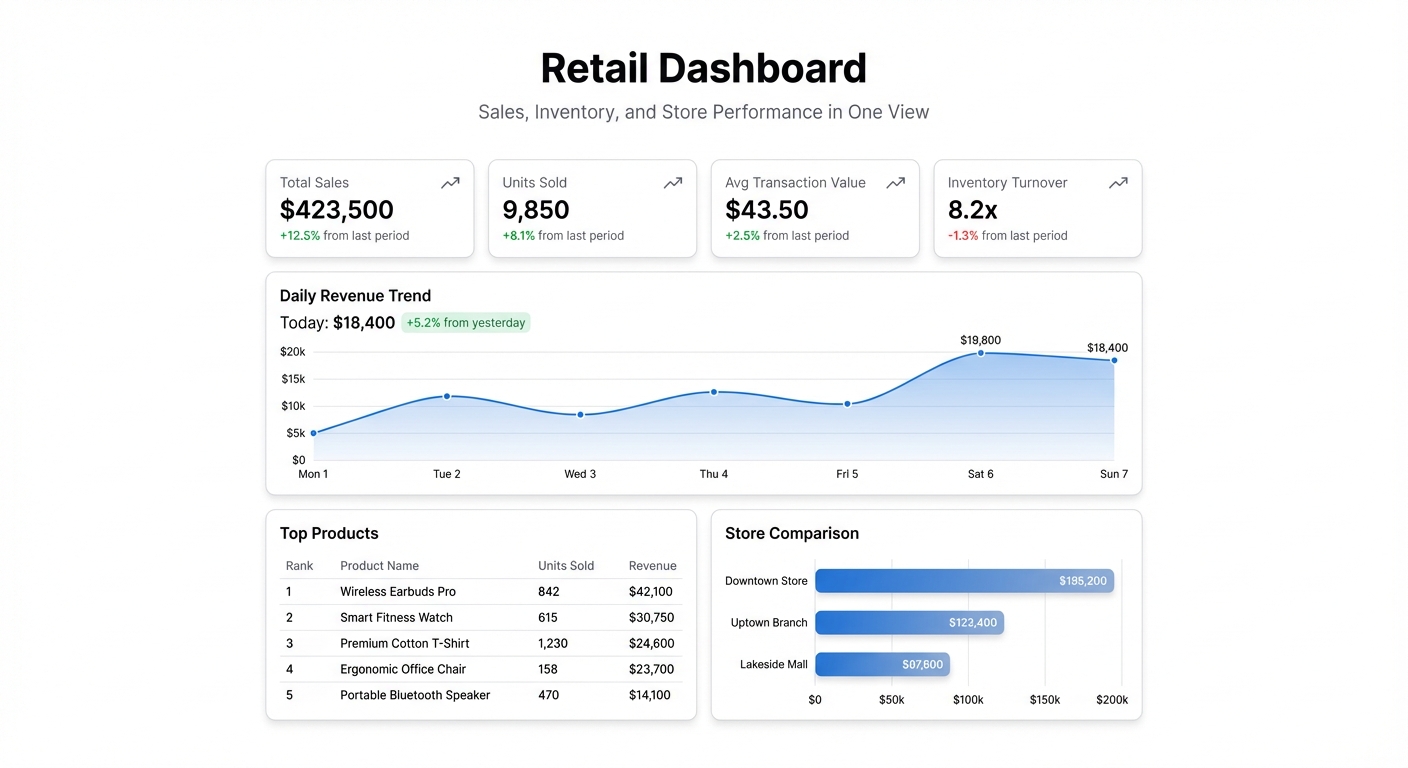
For multi-location retailers, the most useful view is usually a side-by-side comparison of store performance — same metrics, same time period, each location as a column. Spots where one location is underperforming others on a specific metric (conversion rate, ATV) become immediately visible.
The data is already in your systems. The question is whether you’re looking at it while you can still act on it or waiting until the month-end report tells you what happened.


