End of service. You know it was busy — but was it profitable? You sold out of the special, but your food cost for the week is creeping up and you’re not sure why. Your labor ran heavy on Thursday but the covers didn’t justify it.
Restaurant operators deal with razor-thin margins and constant variables. The problem isn’t a lack of data — your POS system is generating it every hour. The problem is that the data is buried in exports nobody has time to analyze during a shift.
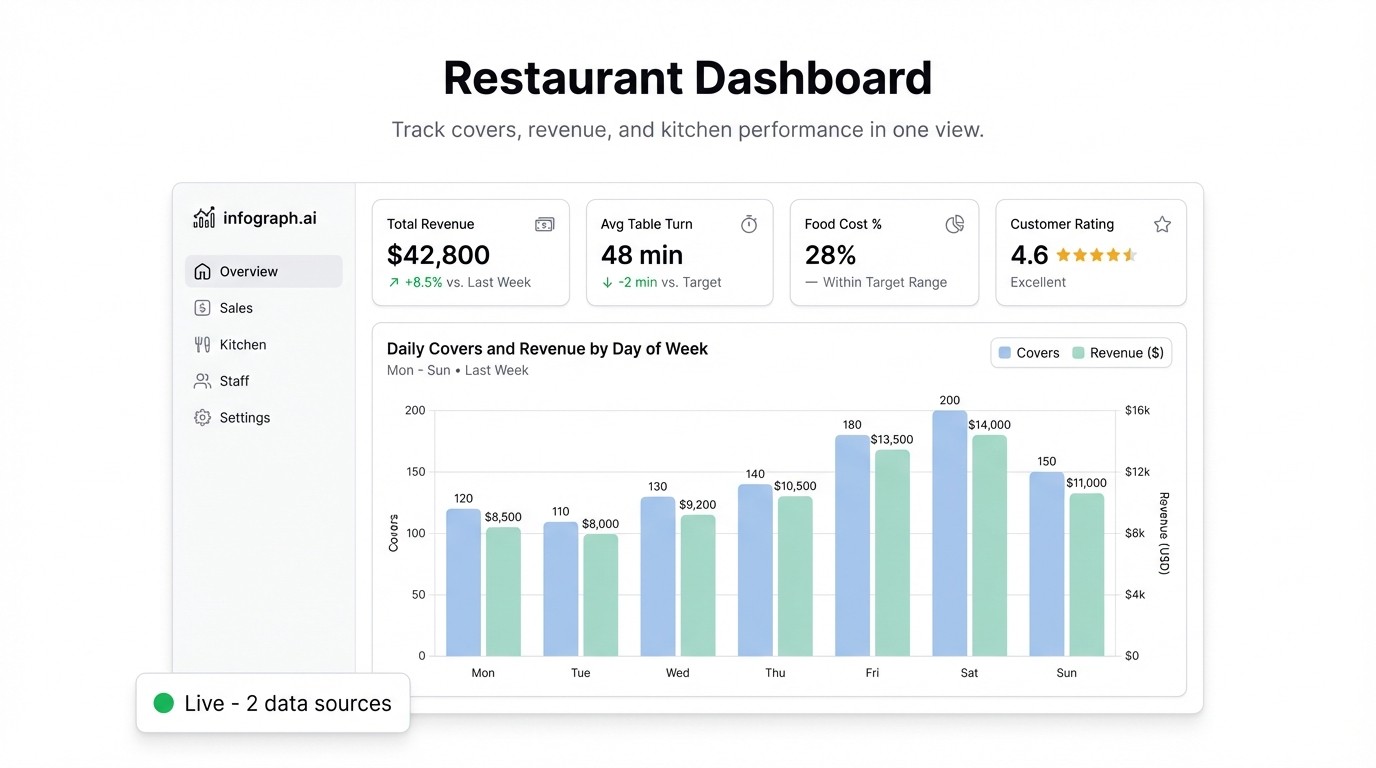
A restaurant dashboard surfaces the numbers that matter, in real time, so you’re making decisions during service instead of reviewing them the next morning.
The Metrics That Run a Restaurant
Daily revenue vs. target — the simplest and most important number. Are you hitting plan? Broken down by meal period (lunch vs. dinner) and compared to the same day last week, it tells you immediately whether today is tracking well or needs attention.
Food cost percentage — cost of goods sold divided by revenue. Most restaurants target 28–35%, depending on concept. A spike on a specific day or menu category points directly to a purchasing problem, a portioning issue, or waste. Tracking it daily instead of monthly means you catch it before it compounds.
Labor cost percentage — labor as a share of revenue. This is where the margin lives in most operations. If covers are down but you staffed for a busy night, the labor percentage tells the story. The goal is to right-size staffing relative to actual volume, and you can’t do that without seeing the number in real time.
Covers per hour — how many guests you’re serving per hour, by section or by meal period. This is your throughput metric. Low covers per hour during peak times often points to front-of-house flow issues, not demand.
Top-selling items — which dishes are moving and which aren’t. Useful for menu decisions, prep planning, and understanding what’s driving the check average up or down.
Where the Data Already Lives
Your POS system — whether it’s Toast, Square, Lightspeed, or something else — exports all of this. Daily sales reports, item sales breakdowns, labor summaries. Most operators download these as CSV or Excel files and either ignore them or spend Sunday morning manually compiling a weekly report.
That’s the gap a restaurant analytics dashboard closes.
Building a Restaurant Dashboard with Infograph
You don’t need to change your POS system or hire a data analyst. If you can export a CSV, you can have a dashboard running today.
Step 1: Export your POS data
Pull a weekly or monthly export from your POS. Most systems let you export: date, meal period, total revenue, covers, item name, item quantity sold, item revenue, and labor hours/cost by role. If your system exports multiple files, combine them in a single Google Sheet.
Step 2: Connect to Infograph
Go to app.infograph.ai. Upload your CSV or Excel file, or connect your Google Sheet directly for a feed that updates whenever you paste in new data. No SQL, no data engineering.
Step 3: Describe your dashboard
Something like: “Show daily revenue vs. target as a bar chart, food cost % by week as a line chart, labor cost % by day, covers per hour by meal period, and top 10 items by revenue.”
The AI builds the layout. If a chart doesn’t look right, refine the prompt. You’re not configuring a BI tool — you’re describing what you want to see.
Step 4: Keep it updated
If you’re on Google Sheets, just paste your latest POS export into the sheet and the dashboard updates automatically. You can set this up once and run your weekly review from the dashboard instead of rebuilding it from scratch every time.
What It Changes in Practice
The teams using a restaurant KPI dashboard consistently describe the same shift: they stop reacting to problems at the end of the week and start catching them during the week.
Food cost spiking on Wednesday? You see it Wednesday, not in the Sunday review. Labor running hot on Friday lunch? You know before you open Saturday. The top-selling item is a low-margin dish that’s driving up food cost? The dashboard surfaces it — your spreadsheet wouldn’t.
None of this requires anything you don’t already have. It just requires putting it somewhere you can actually see it.
Get Started
Infograph is free to start — one dashboard, no credit card required. If you want to connect a live Google Sheet and keep your dashboard syncing automatically, Pro is $19.99/month.
Your POS is already tracking everything. The dashboard just makes it visible.


