The SEO workflow has a data fragmentation problem that nobody talks about.
You open Search Console for impressions and clicks. Switch to Analytics for organic traffic and conversions. Open your rank tracker for keyword positions. Maybe pull a Screaming Frog export for technical issues. By the time you’ve assembled the picture, you’ve had four browser tabs open and have mentally lost the thread twice.
An SEO dashboard doesn’t solve your ranking problems. But it does mean you spend less time assembling the picture and more time acting on it.
What belongs in an SEO dashboard
The temptation is to track everything: all keywords, all pages, all traffic sources, impressions going back two years. That produces a dashboard that takes ten minutes to load and three hours to make sense of.
The useful version tracks a much smaller set of things:
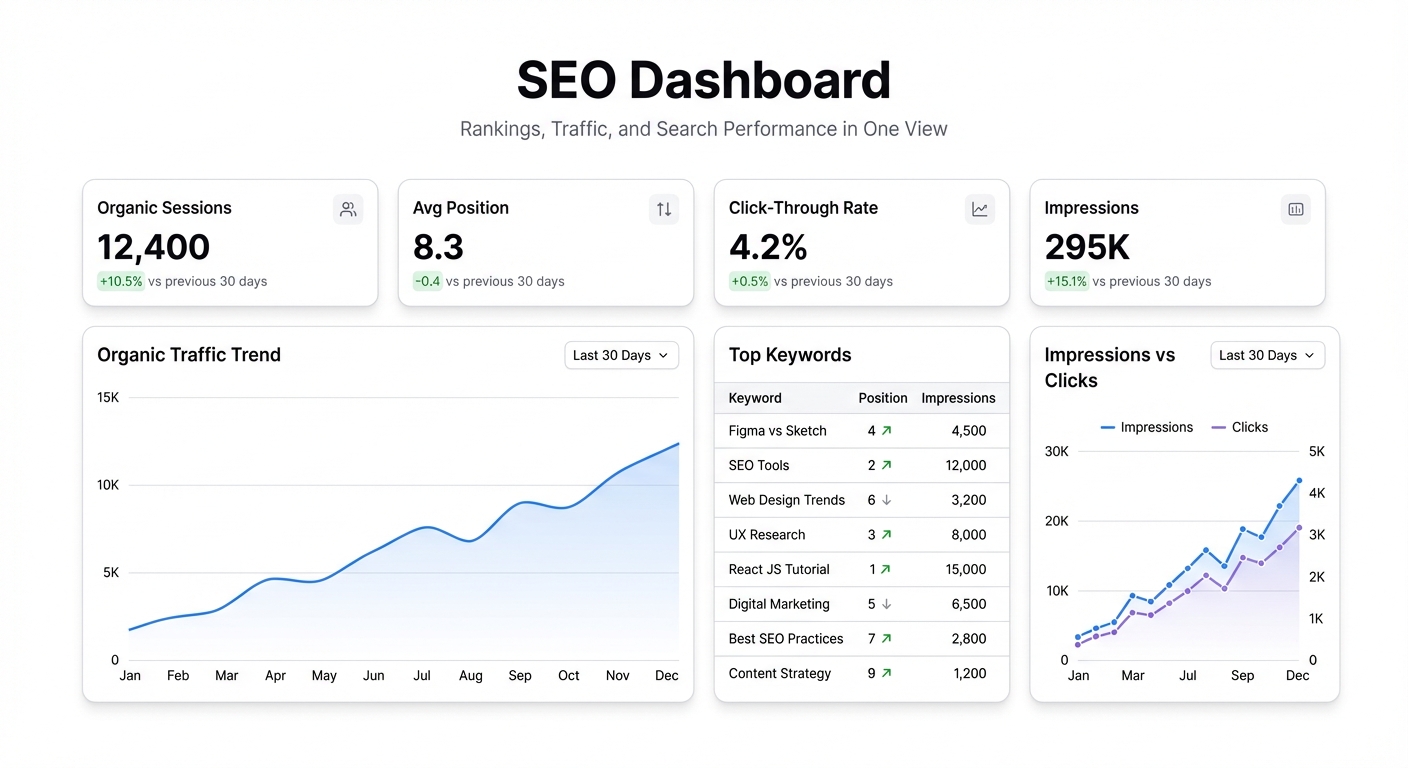
Organic traffic trend — Week-over-week and month-over-month. Not because you need both constantly, but because WoW catches drops early and MoM shows the actual growth trajectory. A single line chart covering 90 days is almost always enough.
Top pages by organic sessions — Which pages are actually driving traffic right now. You want the top 10-20. More than that and you’re reading a list, not getting an insight.
Impressions and CTR by query — From Search Console. This is the one that tells you whether your rankings are translating into clicks. A page ranking #3 for a high-volume query with a 2% CTR has a title/meta problem. A page with strong CTR but low impressions has a rankings problem. Different fixes.
Click and impression trends for your target pages — Not all pages. The ones you’re actively working on or monitoring. Pulling this for your top 10-15 priority URLs shows you whether your optimizations are moving the needle.
Average position by query cluster — Group your target keywords by topic or funnel stage. Seeing “informational queries: avg position 8.2” vs “commercial queries: avg position 14.6” tells you where to focus link building or content investment.
Pages with declining traffic — The ones that were performing 3-6 months ago and aren’t now. These are either algorithm affected, have new competition, or have technical issues. The faster you spot the drop, the faster you fix it.
Where the data comes from
Google Search Console — The ground truth for impressions, clicks, CTR, and position. Export via the API or pull manually. For most teams, a monthly export to Google Sheets is enough for a working dashboard. If you want it fresher, Search Console’s API can be queried daily with about a 2-3 day lag.
Google Analytics 4 — Organic sessions, landing pages, conversion events. The “organic” channel segment is your filter. Export to Google Sheets via the GA4 Data API or use the native GA4 export to BigQuery if you’re already there.
Rank tracker exports — Ahrefs, Semrush, Moz — any of them have CSV exports. Weekly ranking snapshots for your priority keywords are usually sufficient. Connect the CSV directly or drop it into Sheets.
Most teams already have all three sources piped somewhere. The dashboard is the layer that reads them together.
Building it
Take your Search Console export and your Analytics organic session data — both in Google Sheets or as CSV files — and connect them as data sources. Then describe what you want:
“Show me a line chart of organic clicks over the last 90 days. Add a table of my top 20 pages by clicks this month with their average position. Then show me a scatter chart of impressions vs. CTR by query.”
That covers the core view. Follow up:
“Add a table of pages where clicks dropped more than 20% month-over-month.”
That’s your watchlist.
If you have rank tracking data in a separate sheet, connect it and add:
“Bar chart of average position by keyword group.”
Three data sources, one dashboard, about eight prompts total.
The thing most SEO dashboards get wrong
They’re built for reporting, not for decisions.
A reporting dashboard shows stakeholders that organic traffic went up 12% this quarter. That’s useful for a QBR slide. But for day-to-day SEO work, what you actually need is a decision dashboard: which pages need attention, which queries have opportunity, where did something break.
The distinction changes what you include. A reporting dashboard is optimized for clean charts and positive metrics. A decision dashboard includes the ugly stuff — pages with declining traffic, queries with low CTR, pages that got indexed but aren’t ranking.
Build the decision version first. The reporting version is just a filter on top of it.
How often to look at it
Daily checking of SEO data is mostly noise. The signal lives in weekly and monthly views.
A weekly review catches:
- Traffic drops that started in the last 7 days (algorithm update? technical issue?)
- Whether pages you published or optimized recently are getting impressions
A monthly review tells you:
- Whether your overall organic trajectory is correct
- Which target pages moved significantly in either direction
- Where you should focus next month’s effort
Build the dashboard to support both views — weekly trend data in the main charts, monthly comparison numbers next to them.
One thing that actually changes
Before a dashboard like this, most SEO teams have a vague sense of whether things are going well. The weekly “organic traffic is up/down X%” from Analytics is the main signal.
After it, you have specific pages, specific queries, and specific trends. The conversation with your team or client stops being “traffic is up” and starts being “these three pages drove 60% of the gains, and this one page dropped 40% — here’s why.”
That specificity is what makes SEO accountable. Not the ranking reports. The clarity about which bets are paying off.