Content marketing has a measurement problem. Not a shortage of data — the opposite. Google Analytics, Search Console, your CRM, your email platform, and your CMS all have dashboards. The problem is that none of them talk to each other, so you end up knowing that a post got 3,000 pageviews without knowing whether any of those visitors became customers.
A content marketing dashboard fixes this by pulling the signals that matter into one view. Not more data — fewer numbers, better connected.
The metrics that actually move content strategy
Organic traffic by page sounds obvious but the way you track it matters. Raw pageviews by post tells you what people clicked on. Organic sessions from search — filtered by landing page — tells you what Google is actually sending traffic to. These are different. A post can have high total traffic because you emailed it to your list, while the post that’s compounding in search gets missed. Track both, but distinguish them.
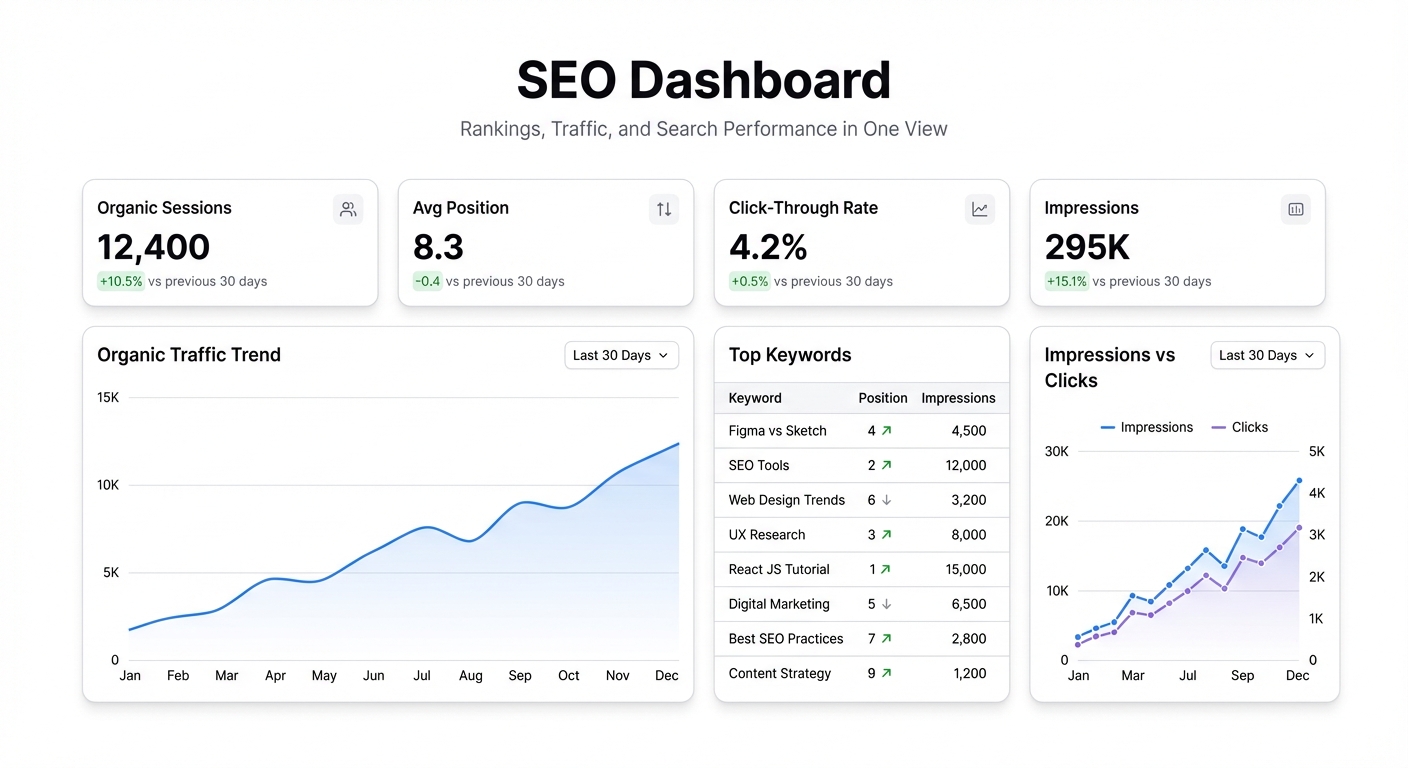
Keyword rankings for target pages is the number content teams should check weekly but usually only look at when something goes wrong. Track your primary target keyword per post and watch rank movement over time. A post that drops from position 4 to position 9 has probably lost 40% of its clicks. Catching that early means you can update the post before traffic erosion becomes meaningful.
Clicks vs. impressions vs. CTR from Search Console is more actionable than most teams realize. High impressions, low CTR means Google is showing your page but searchers aren’t clicking — that’s a title or meta description problem, not a content problem. You can fix it in 20 minutes without rewriting the post. Search Console doesn’t surface this pattern automatically; you have to pull it yourself.
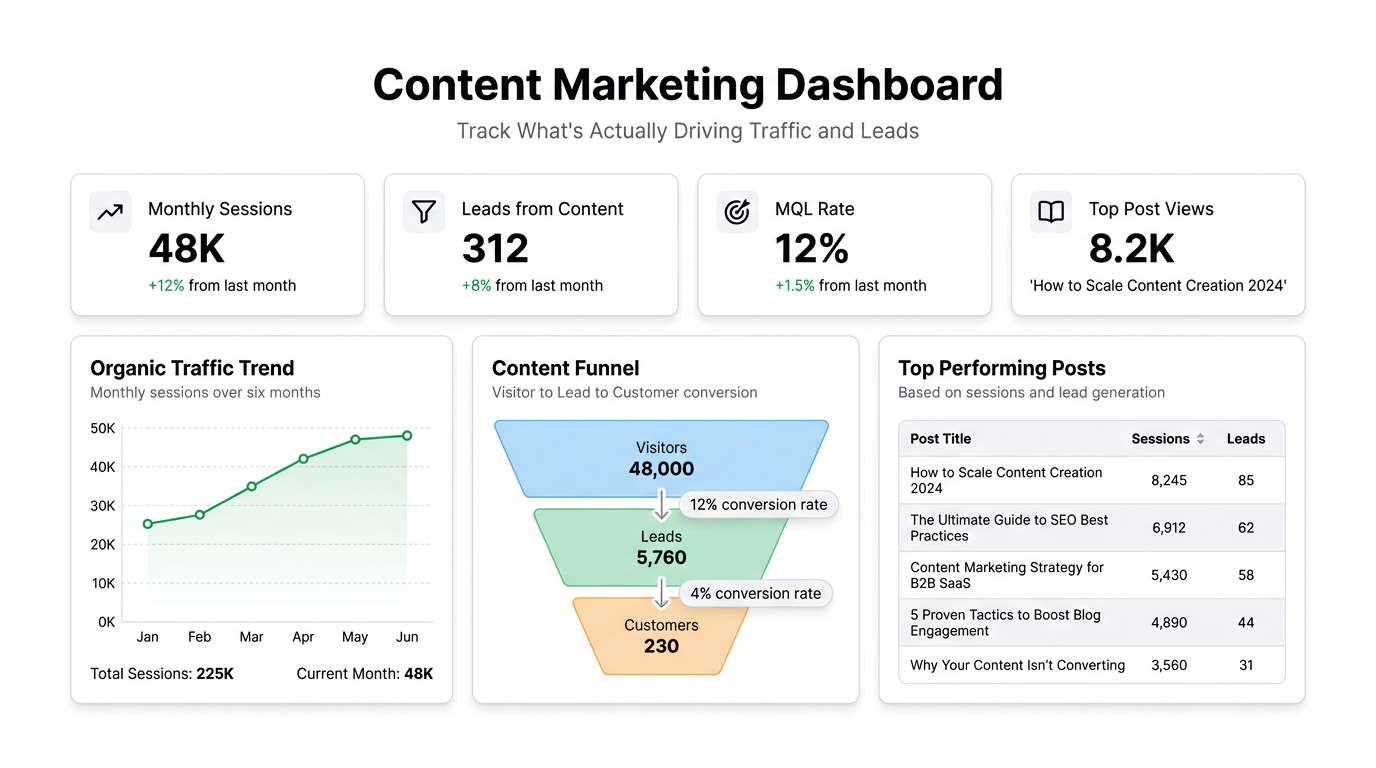
Content-attributed leads is the metric that connects the content team’s work to pipeline. It requires tracking UTM parameters properly and connecting your analytics to your CRM, but when it works, it changes conversations. “This post drove 40 trials last month” is a different conversation than “this post got 4,000 visits.”
Time on page and scroll depth by content type shows you which formats readers actually engage with. Long-form guides might have high time on page. Quick comparison posts might have high scroll depth but low time. Neither is wrong — they’re doing different jobs. When both are low on a post, the post has a problem.
Content production vs. traffic growth is the ratio that tells you whether your publishing cadence is working. Some teams publish 20 posts a month and see flat traffic. Others publish 4 and see consistent growth. The difference is usually post quality and keyword targeting, not volume. Seeing production and traffic on the same chart makes the relationship visible.
The views most content teams don’t build
Top posts by conversion rate — not traffic, conversion. A post with 500 monthly visits and a 3% trial conversion rate is worth more than a post with 5,000 visits and 0.1% conversion. Most content dashboards surface traffic; few surface conversion by page.
Content decay tracker — posts that have lost ranking or traffic over the last 90 days. All content decays eventually. Catching a post that’s dropped 20% in organic traffic while it still has some ranking means you can refresh it and recover the position. Waiting until it’s fallen off the first page makes recovery much harder.
Publishing calendar vs. actual — planned publish dates versus actual. Content teams slip schedules constantly. Tracking the delta tells you whether your production pipeline is realistic or optimistic. If you’re consistently publishing 2 weeks late, the problem is either the planning or the production workflow — the data will show you which.
Building a content dashboard in Infograph
The core data sources are Google Analytics (traffic, behavior), Google Search Console (keyword rankings, impressions), and your CRM (leads, attributed conversions). All three can export to CSV, and both GA and Search Console can pipe data into Google Sheets via their native integrations.
Connect your Google Sheet to Infograph and describe what you need: “Show me organic traffic by landing page for the last 60 days, keyword rankings for my top 20 posts, and trial signups by source.” The dashboard builds from there. Add filters for date range, post category, or author as needed.
For teams using a content tracker in Notion or Airtable — post status, publish dates, target keywords — that spreadsheet can be the backbone. Export it alongside your analytics data and you get a view that connects production status with performance in one place.
Content strategy built on guesses is expensive. You write the wrong posts, target the wrong keywords, and publish at the wrong cadence — and you won’t know for six months. A live dashboard shortens that feedback loop considerably.