We just shipped 43 dashboard themes. Click the palette icon in your toolbar, pick one, and your entire dashboard transforms. Charts, cards, backgrounds, typography. All of it.
No settings page. No CSS. No waiting.
Why We Built This
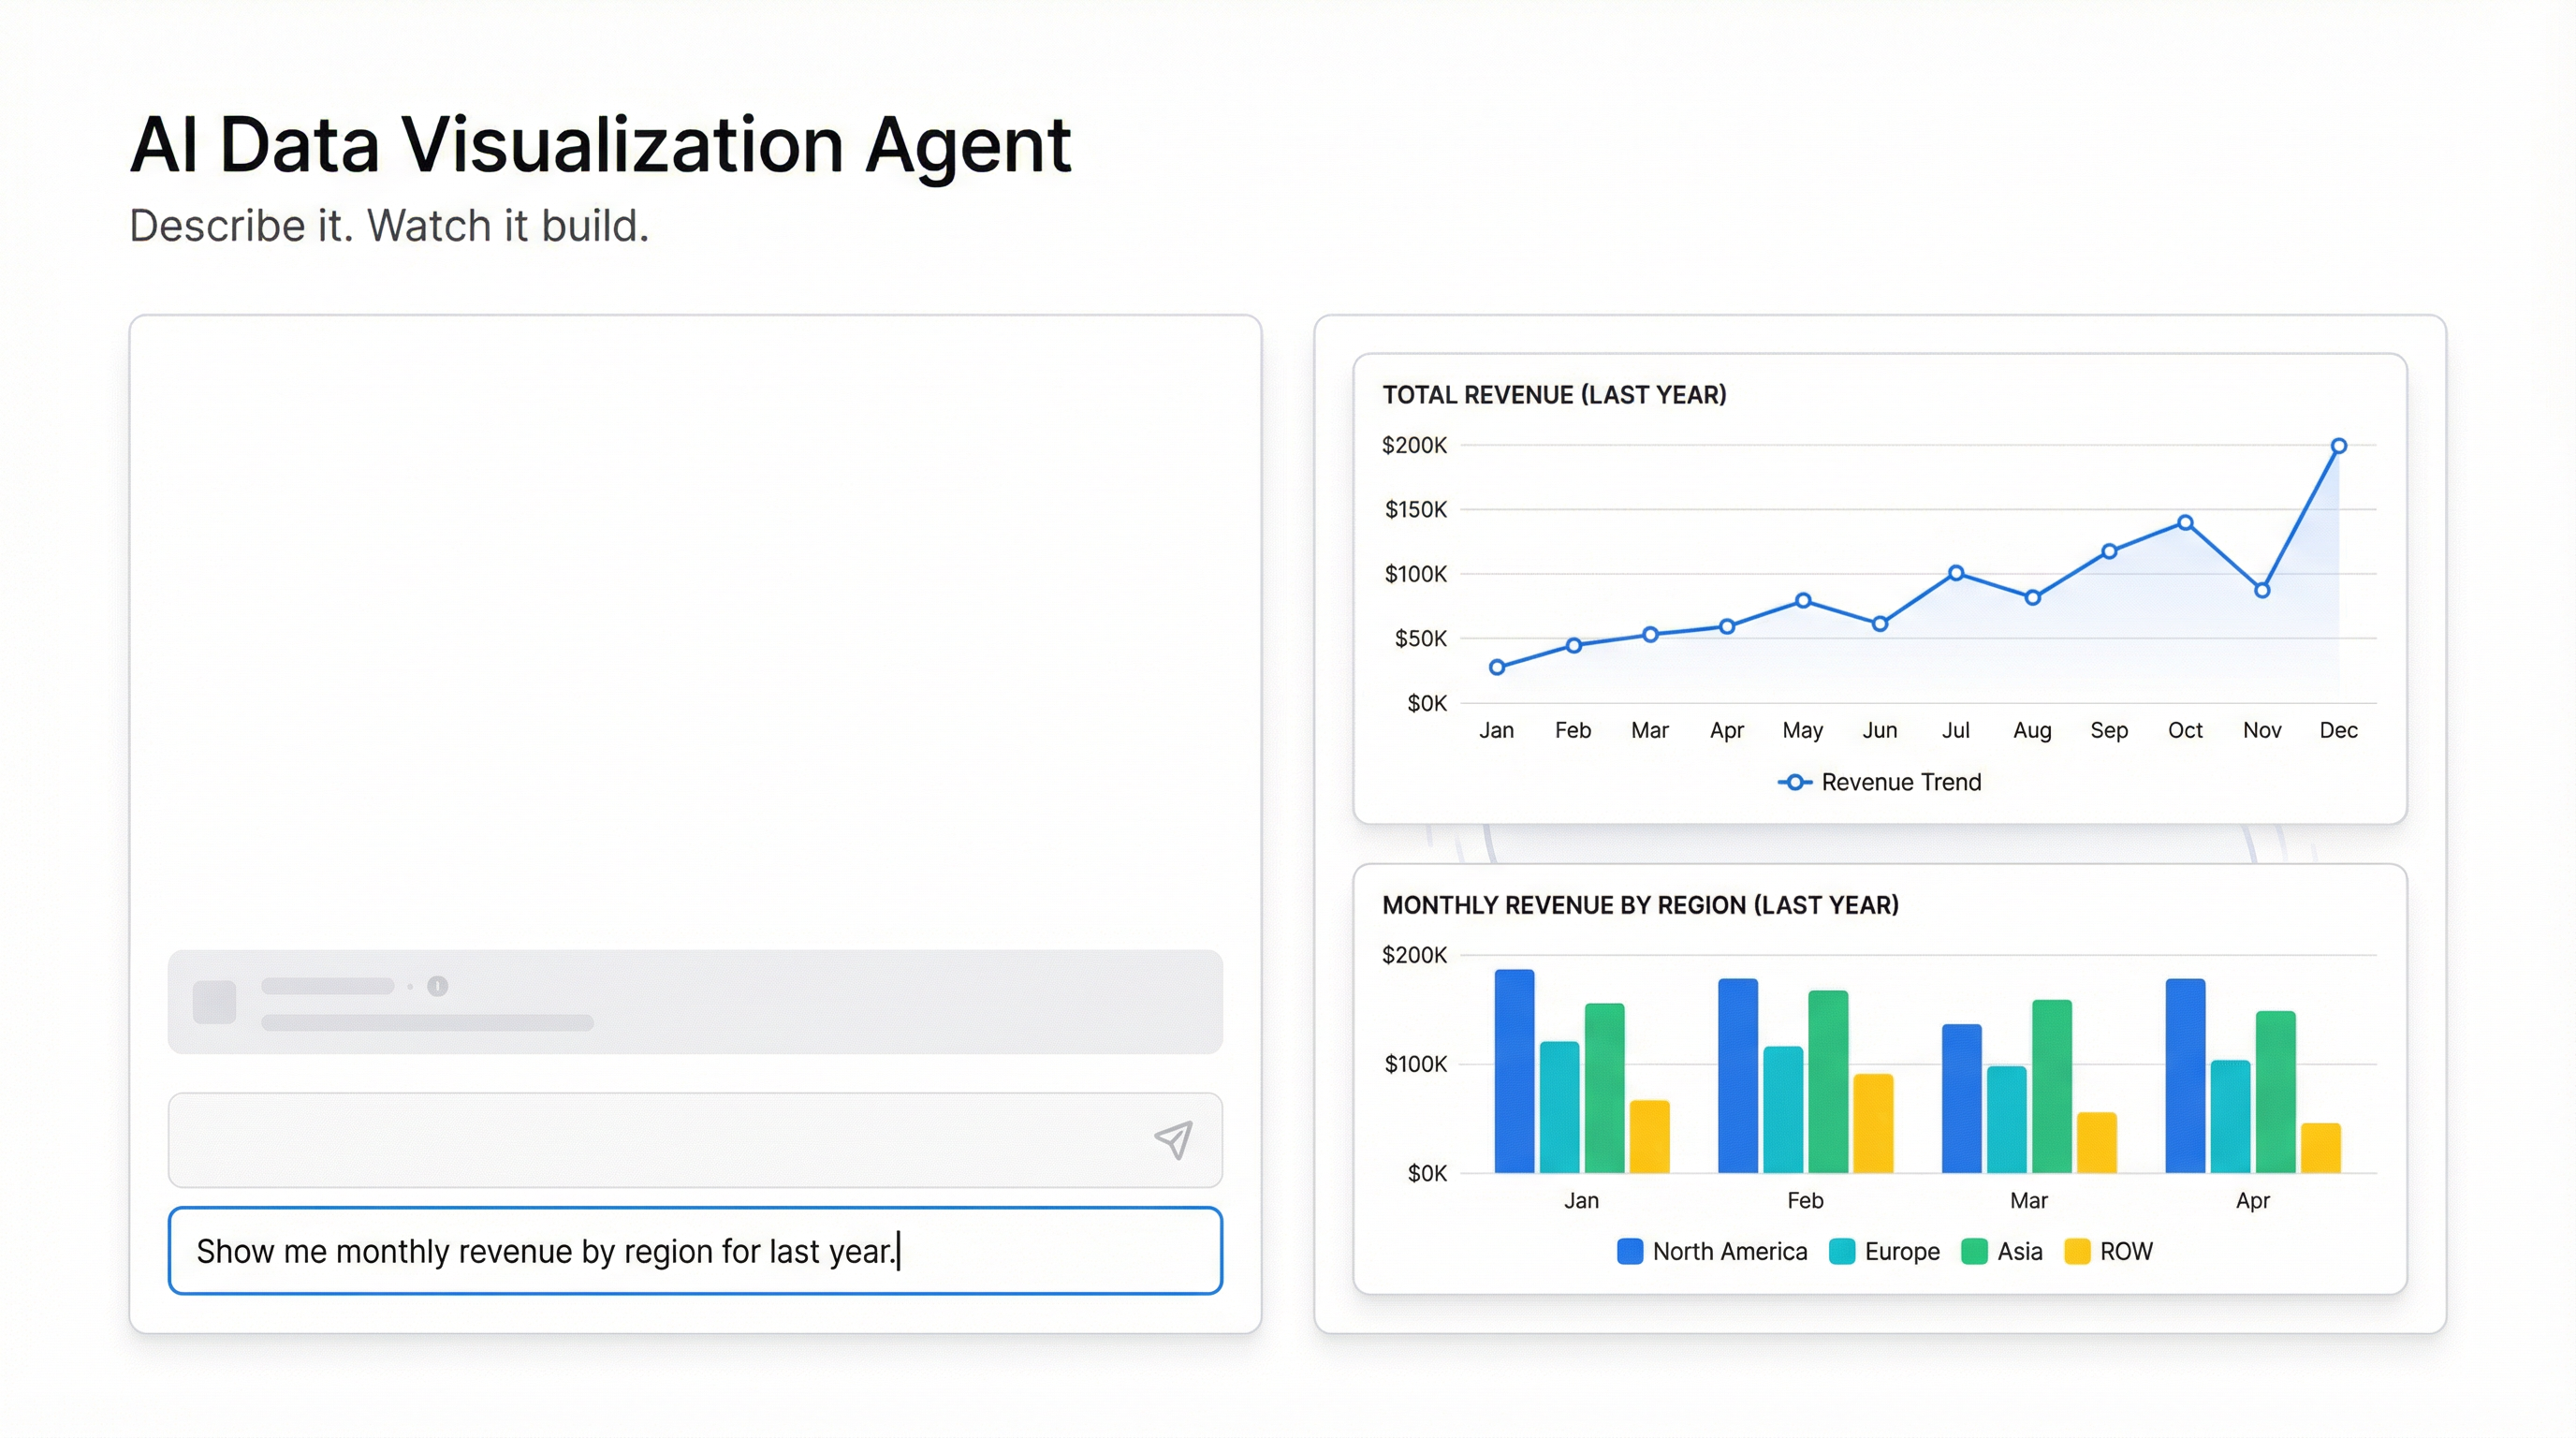
We kept watching people build great dashboards and then share them looking exactly like everyone else’s. Same dark background. Same default chart colors. Same “I clearly used an AI tool” energy.
That’s fine for internal stuff. But we had a user last month who built a stunning revenue dashboard for a client pitch, and the client’s first comment was about how it looked like a template. The data was solid. The insight was there. But the presentation undercut it.
Your dashboard should look like you made it on purpose.
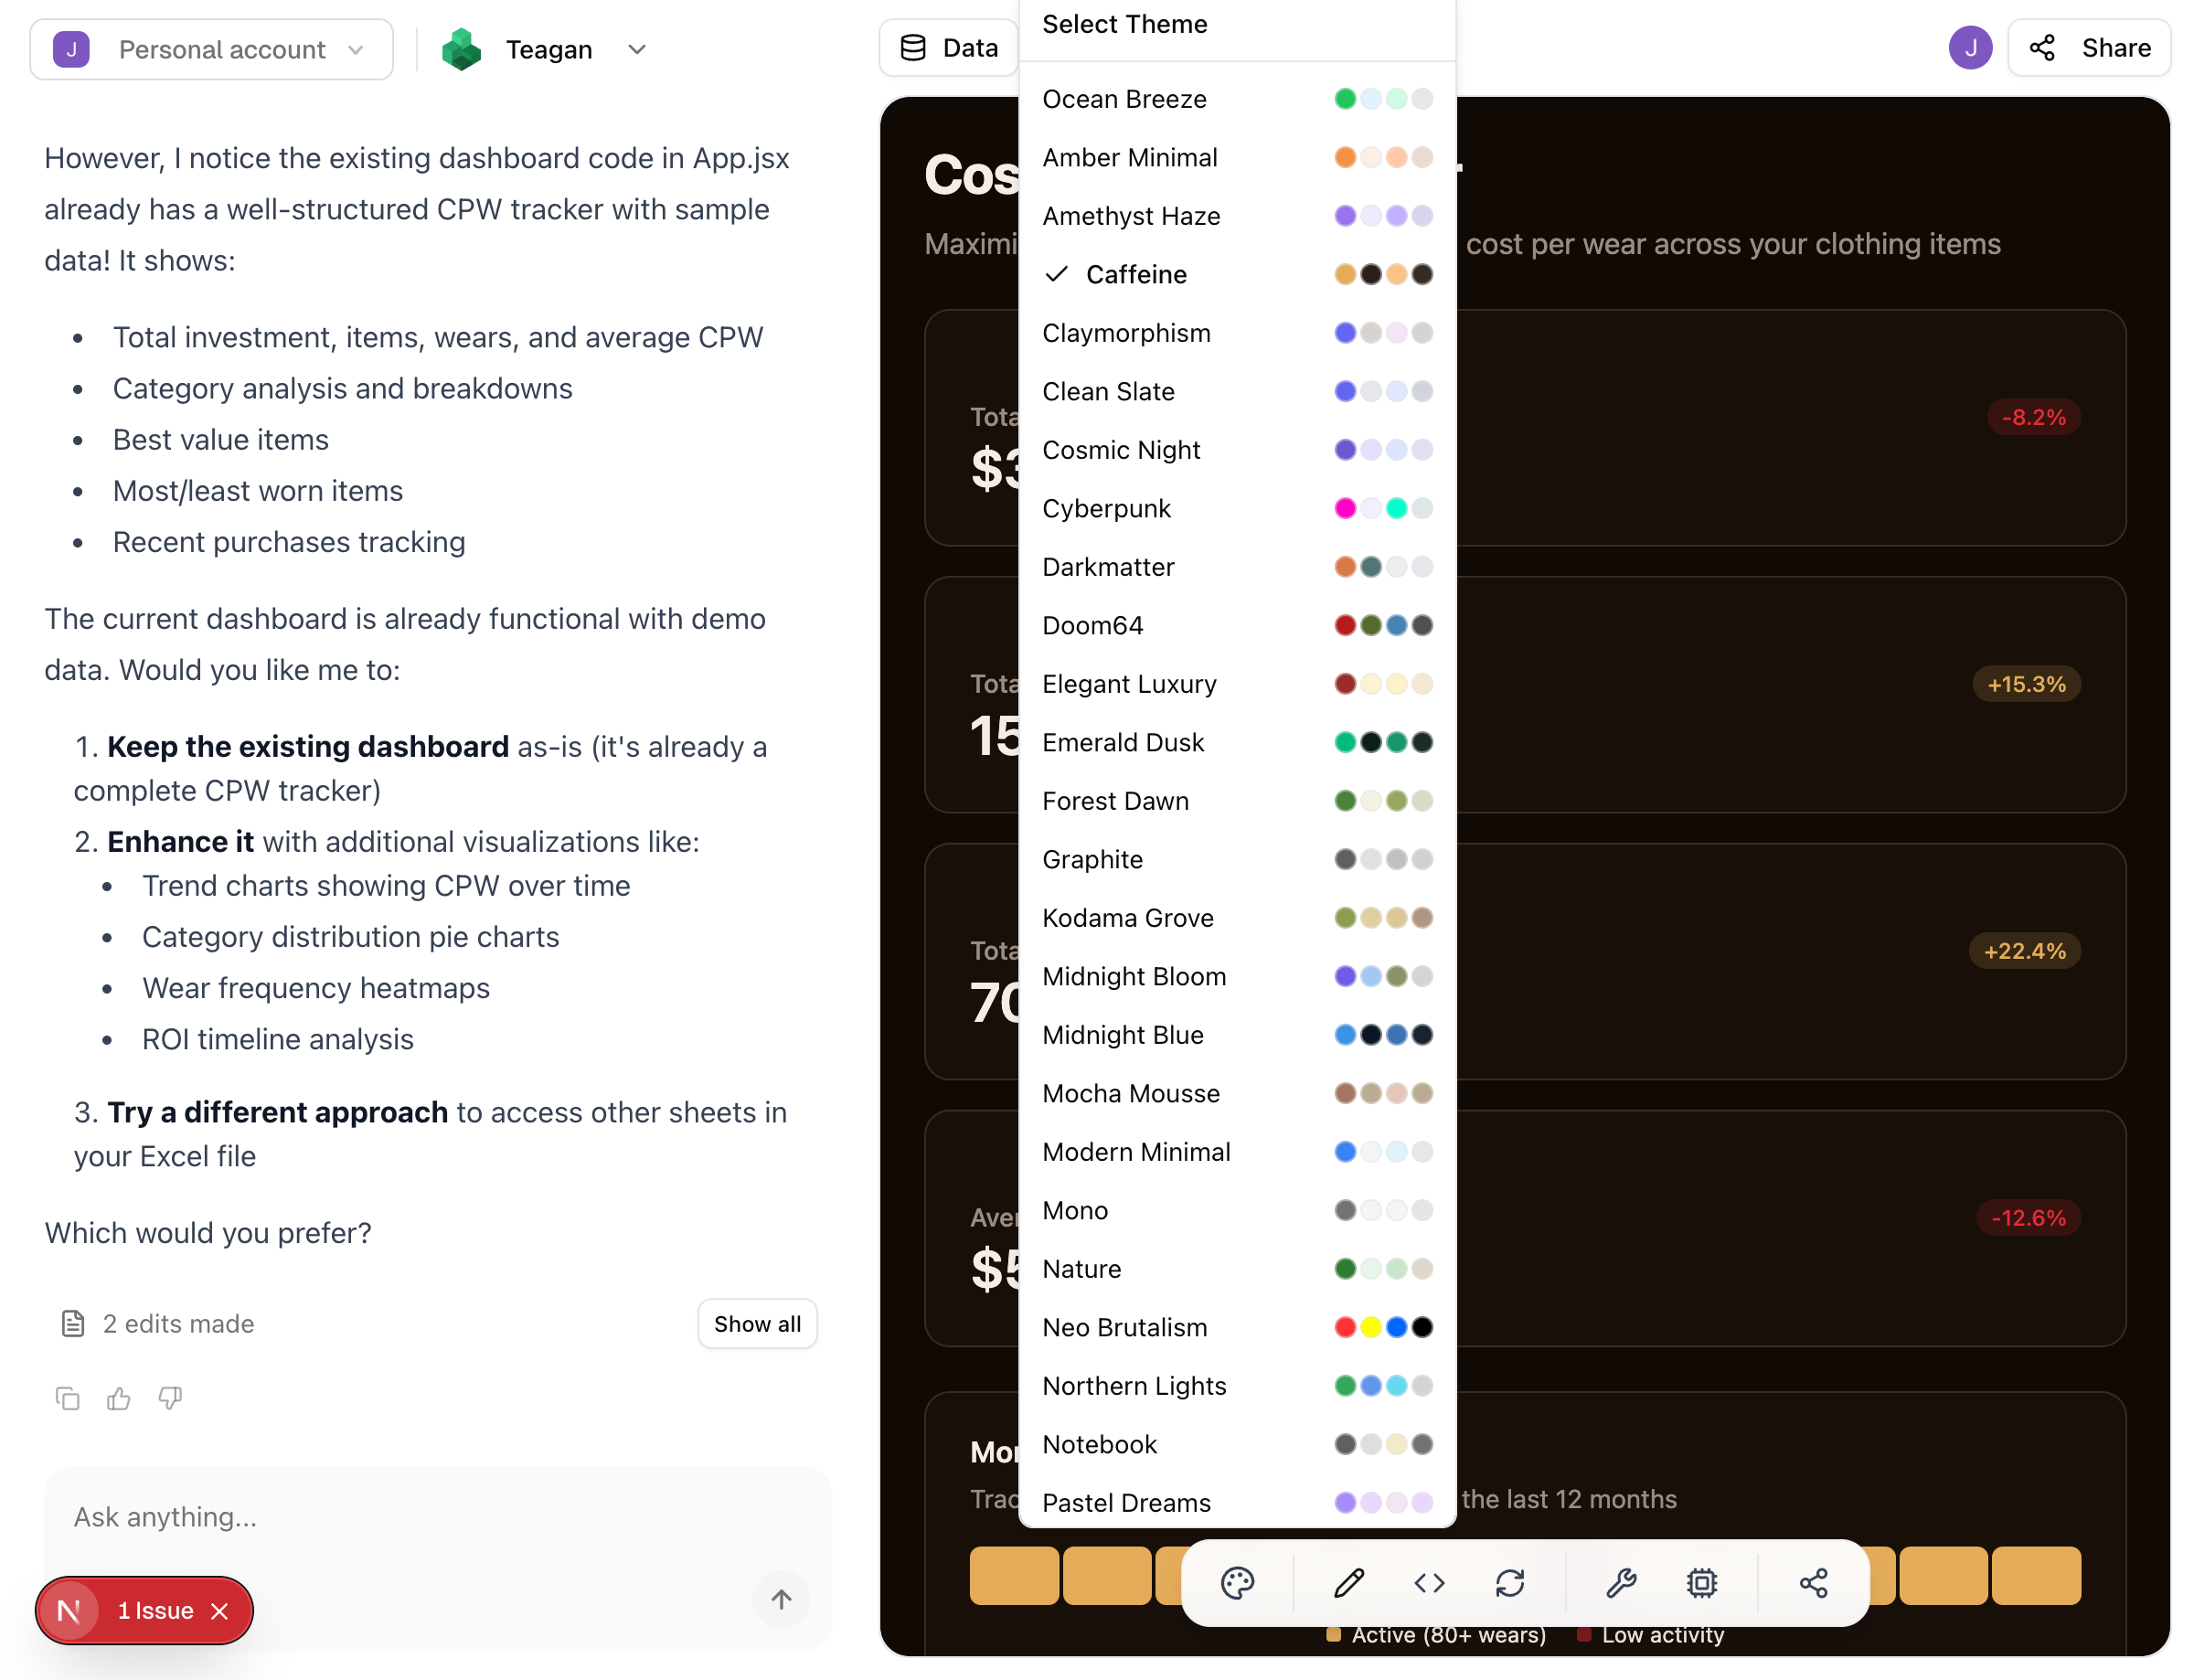
How It Works
Open any dashboard. Click the palette icon in the bottom toolbar. You’ll see every theme with a color swatch preview. Pick one.
That’s it. Whole dashboard updates instantly.
We tested this on a dashboard with 14 charts, 6 KPI cards, and 3 data tables. Theme switch took under a second.
What’s In the Collection
43 themes across a wide range. A few highlights:
- Caffeine and Darkmatter for dark mode people (we see you)
- Ocean Breeze and Clean Slate when you need clean and corporate
- Cyberpunk turns everything neon pink and cyan. It’s ridiculous and somehow works perfectly for creative agencies
- Notebook strips away shadows and heavy borders. Feels like a well-organized Moleskine
- Neo Brutalism if you want your dashboard to have opinions
- Mocha Mousse and Vintage Paper for warmer, softer presentations
And honestly, some themes surprised us. We built Forest Dawn thinking nobody would use it for financial data. Turns out it’s one of the most popular picks for ESG and sustainability dashboards. Context matters more than we expected.
Not Just Colors
Each theme is a complete visual system. When you switch themes, it adjusts:
- Background and surface colors
- Chart palettes that maintain accessible contrast ratios
- Card styling, borders, and shadows
- How positive and negative indicators display
- Typography weight and spacing
We spent a frustrating week making sure the red/green indicators in every single theme stayed distinguishable for colorblind users. The Cyberpunk theme was the hardest. Neon pink on dark purple doesn’t give you a lot of room for accessible status colors.
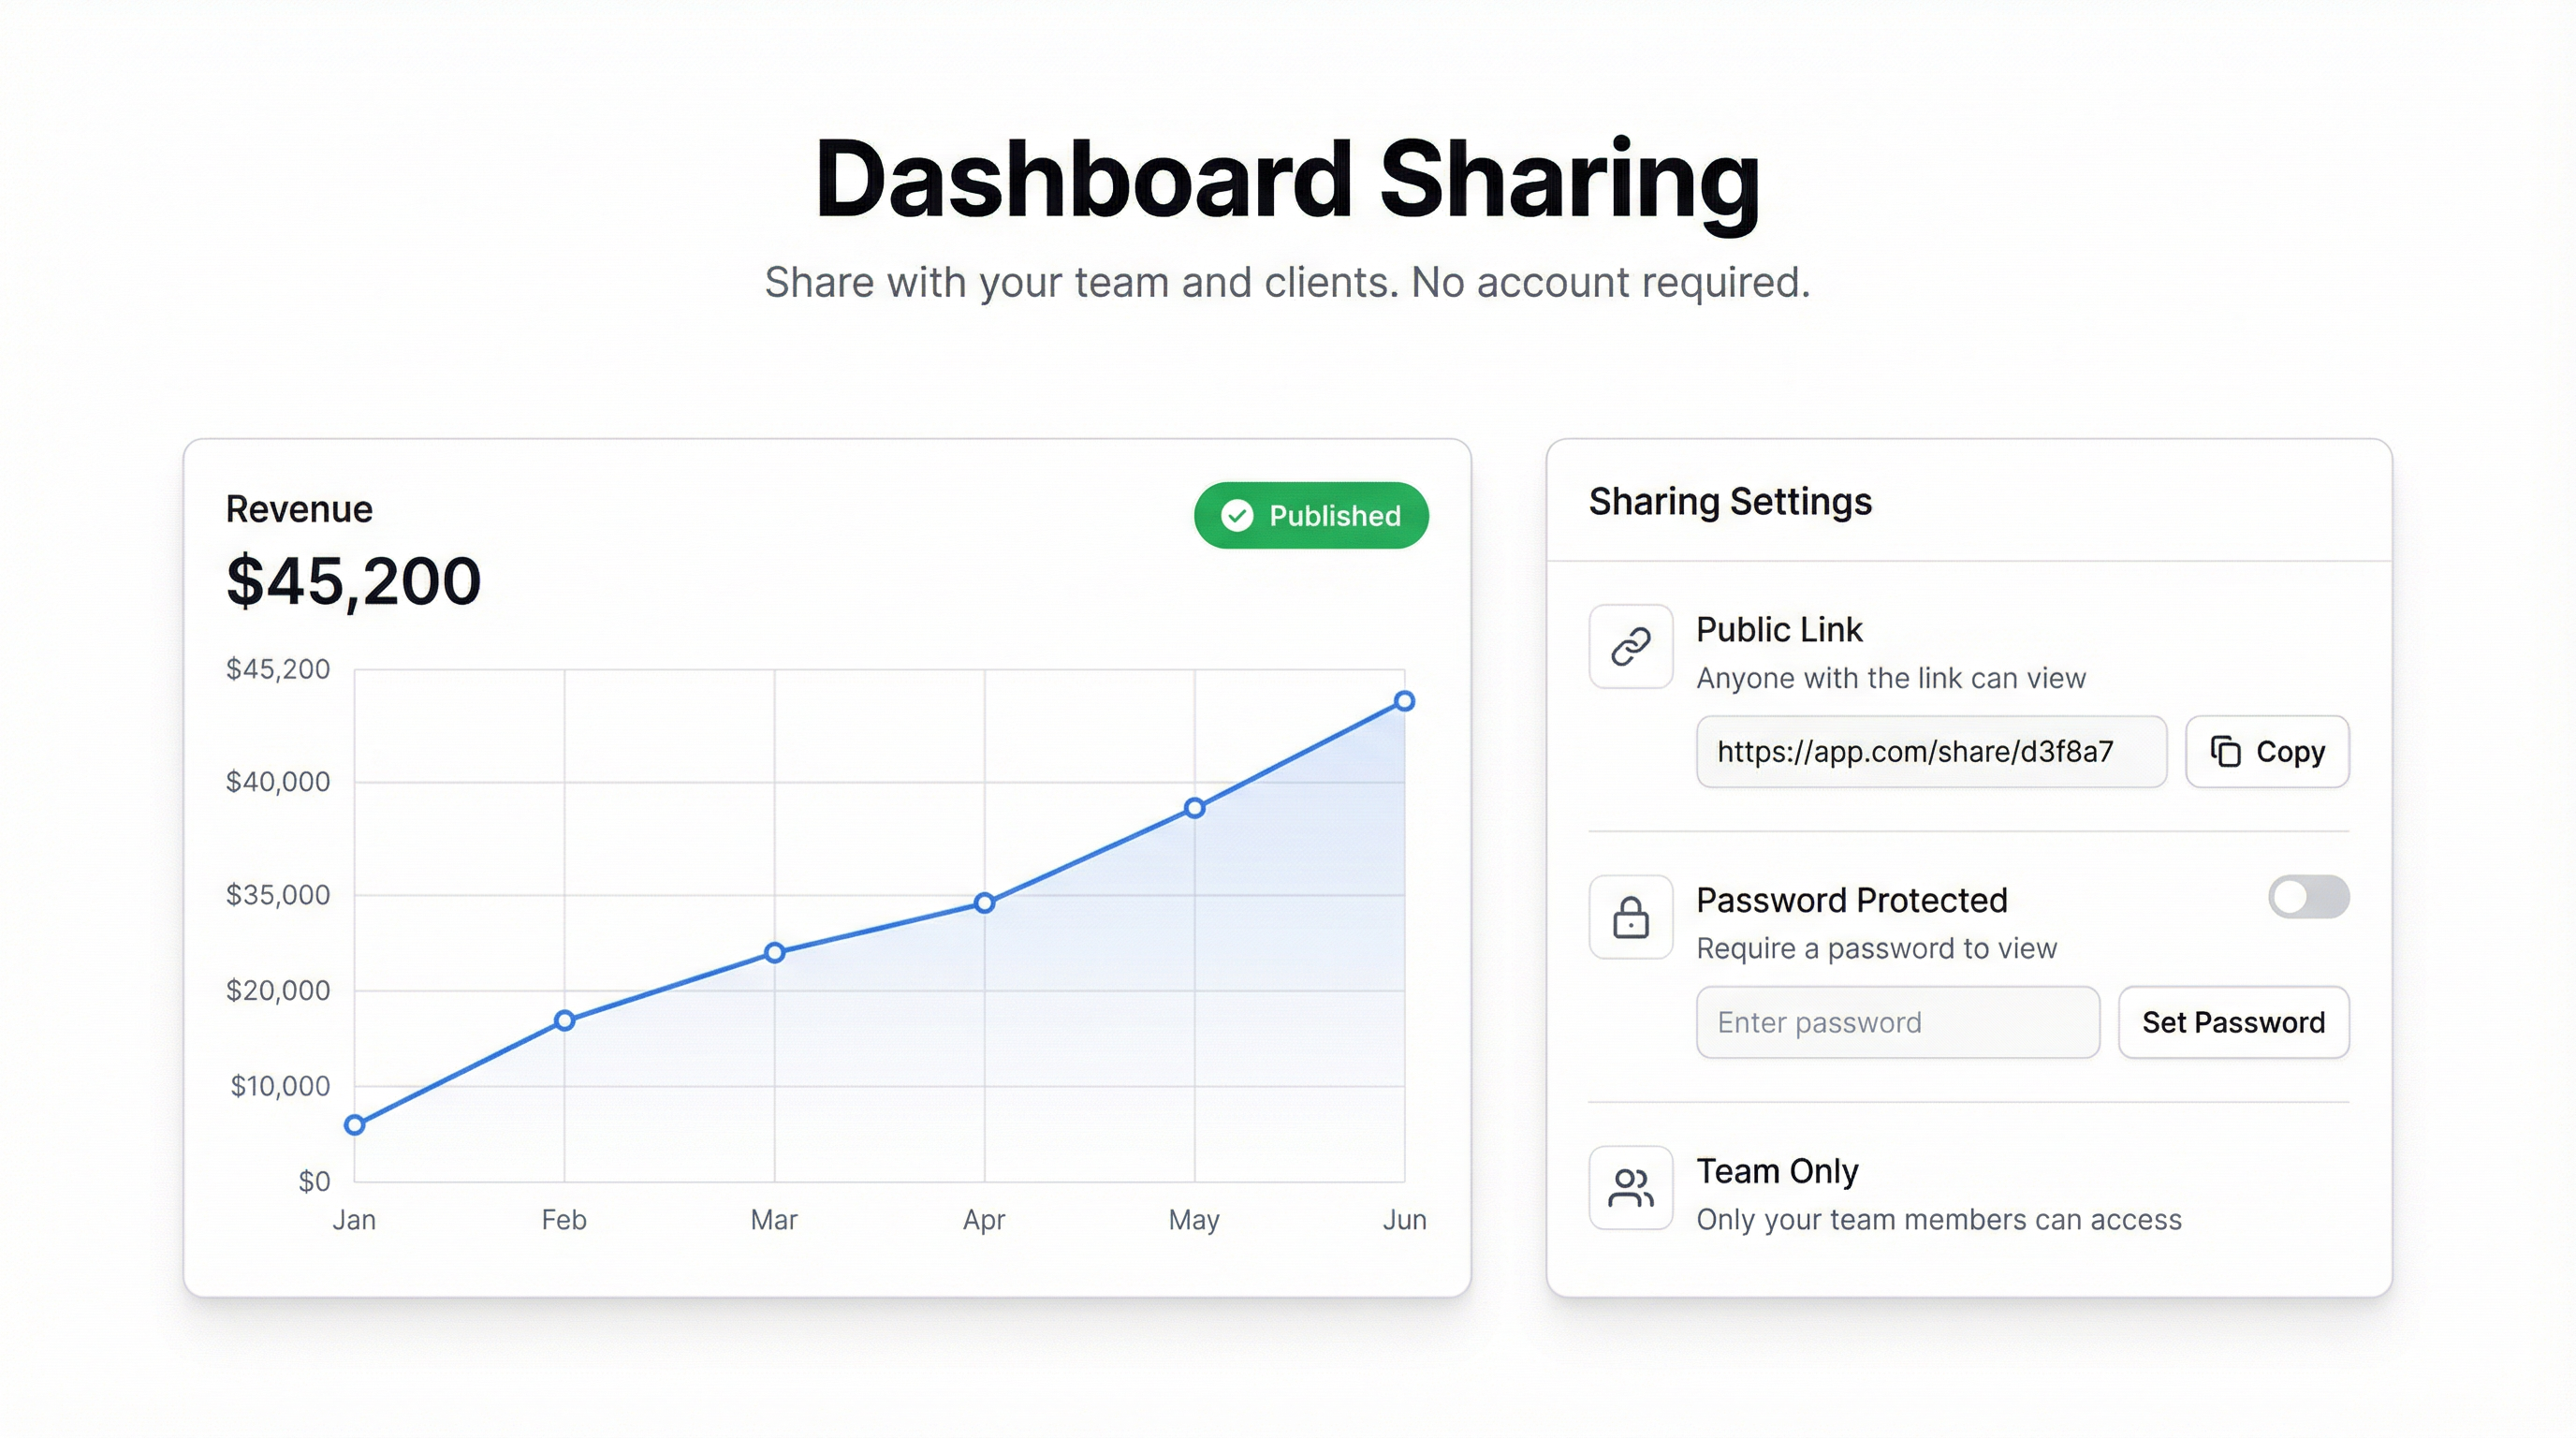
Zero Lock-In
Themes don’t change your data or layout. Switch three times before a meeting. Try one for your investor update and a different one for your team standup. The same dashboard, different visual treatment based on who’s looking at it.
One of our team members switches to Notebook for screenshots in docs and back to Darkmatter for their actual workspace. Takes two clicks.
Try It
The theme picker is live in every dashboard right now. Palette icon, bottom toolbar.
Pick a theme. If it doesn’t feel right, pick another one. It costs you about a second.