Most security teams are working across a SIEM, a ticketing system, and a compliance spreadsheet that someone promised to automate last year. The data is there. The visibility isn’t. When an incident report is due or an audit is approaching, someone manually pulls numbers from three tools into a slide deck.
That’s not a security problem. It’s a visibility problem. And it’s fixable without a six-figure platform purchase.
A cybersecurity dashboard built from your existing exports — incident logs, vulnerability scan CSVs, compliance checklists — gives you one place to see what’s happening, what’s unresolved, and where your exposure is trending.
The metrics that belong in a security dashboard
Security data is broad. These are the KPIs that give a meaningful operational picture across threat monitoring, incident management, and compliance posture.
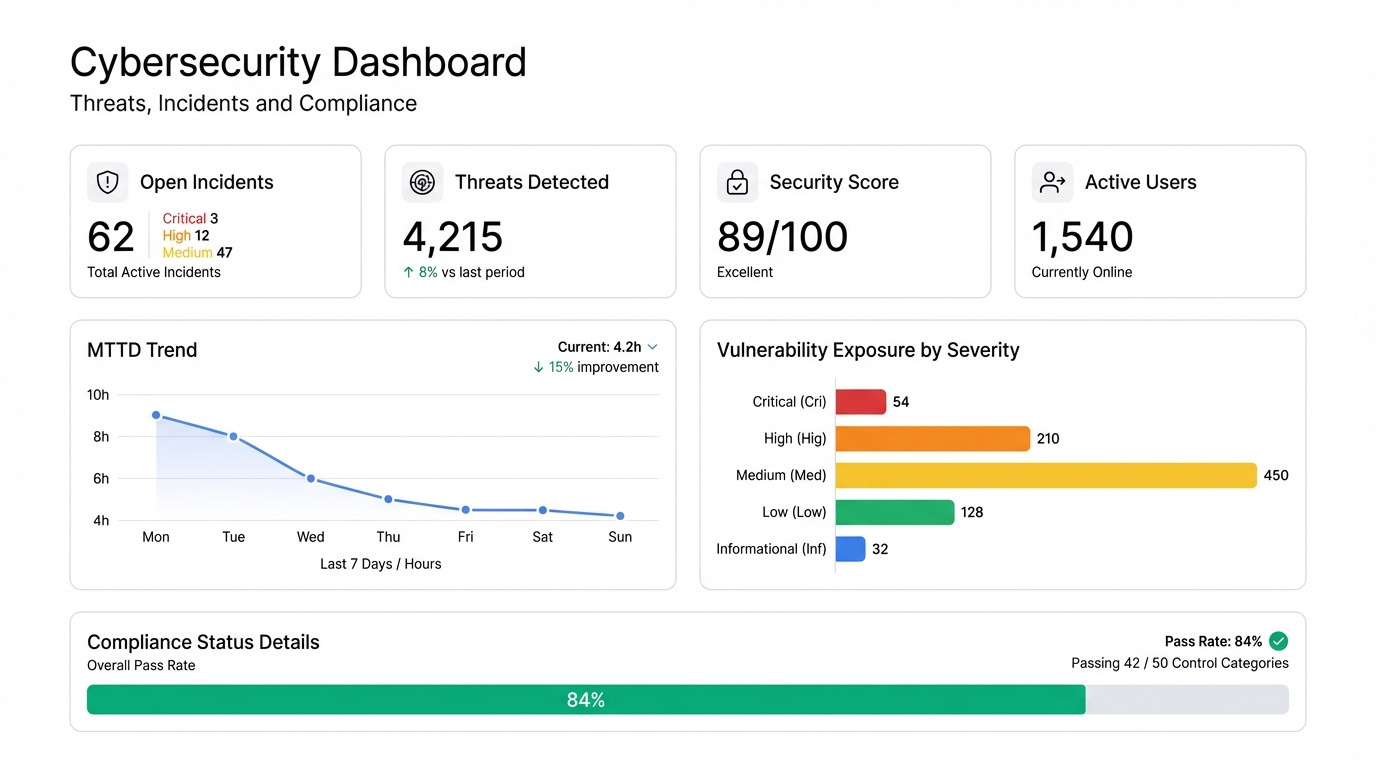
Open incidents by severity — critical, high, medium, low. The raw count matters less than the severity distribution. Three critical open incidents is a very different situation from thirty low-severity ones, and a dashboard makes that distinction obvious at a glance.
Mean time to detect (MTTD) — how long between when an event occurred and when it was flagged. Tracking this over time reveals whether your detection capability is improving or degrading. A rising MTTD is often an early signal that alert fatigue is setting in.
Mean time to respond (MTTR) — how long from detection to containment or resolution. MTTR by incident type shows where your playbooks are working and where they’re breaking down.
Incident volume over time — daily or weekly incident counts. Spikes in incident volume often precede larger events. A baseline makes the spikes obvious. Without one, you’re reacting to each incident in isolation.
Vulnerability exposure — open vulnerabilities by age, severity, and asset type. A vulnerability that’s been open for 90 days on a production server is a different risk profile than a medium-severity finding on a dev machine. The dashboard should show both the count and the age distribution.
Compliance status — controls assessed, controls passing, controls failing or overdue. Compliance work generates a lot of activity but often lacks a clear picture of overall posture. A single percentage — controls currently passing — is easier to act on than a 200-row spreadsheet.
The three-tool problem
The standard security team setup creates invisible gaps. Your SIEM generates alerts and logs. Your ticketing system — ServiceNow, Jira, whatever — tracks incidents and remediation. Your compliance tool or spreadsheet tracks control assessments and audit evidence.
Each tool has accurate data within its domain. None of them talk to each other in a way that gives you the full picture.
An analyst tracking a specific incident has to cross-reference between the SIEM event data, the ticket, and potentially a vulnerability record to understand the full scope. A manager trying to understand overall security posture has to manually compile from all three. An auditor asking for compliance status for a specific time period needs data from multiple places.
The dashboard doesn’t replace any of those tools. It pulls from their exports and puts the picture together in one view. CSV exports from your SIEM. Ticket data from Jira. Compliance spreadsheets from your GRC tool. Upload them to Infograph, describe what you want to see, and the dashboard builds itself.
Building a cybersecurity dashboard in Infograph
The process starts with whatever data you’re already exporting. Most security teams export incident data weekly for reporting purposes. Vulnerability scan results come out of tools like Qualys, Tenable, or Rapid7 as CSV or Excel files. Compliance checklists often live in Excel or Google Sheets.
- Upload your incident log CSV — columns like date, severity, type, status, time-to-detect, time-to-resolve
- Upload your vulnerability scan export — asset, CVE, severity, discovery date, status
- Connect your compliance tracker if it’s in Google Sheets or Excel Online
- Prompt Infograph: “Show me open incidents by severity, MTTD and MTTR trends over 90 days, vulnerability exposure by age and severity, and compliance control pass rate”
The AI reads the structure of each file, figures out the right joins and transformations, and builds the dashboard. No schema configuration. No data model to define. If your incident log uses “P1/P2/P3” and your prompt says “critical/high/medium,” it maps them correctly.
What the dashboard looks like in practice
A security operations dashboard typically has a clear hierarchy of information.
At the top: the current state. Open incidents right now, broken down by severity. Current vulnerability count by severity. Compliance pass rate as a single number. These are the numbers that tell you whether today is normal or not.
Below that: trends. MTTD and MTTR over the last 90 days — are they getting better or worse? Incident volume week over week — are we seeing more events than usual? Vulnerability age distribution — is the backlog growing or shrinking?
Then the details that support investigation. Incidents by type to show which threat categories are most active. Vulnerabilities by asset to identify which systems carry the most exposure. Compliance controls by domain to see where the gaps are concentrated.
The top section is for the morning standup. The trend section is for the weekly review. The detail section is for the analyst who needs to dig in.
Access and sharing
Security dashboards have obvious access control requirements. Not everyone in the organization needs to see open vulnerability counts or incident severity breakdowns.
In Infograph, you can restrict dashboard access to your team — only logged-in members of your organization see it. You can share with specific external parties (auditors, a board committee) via password protection. Or you can make a summary version public for stakeholder reporting.
When you upload a new week’s data, the dashboard reflects it. The structure doesn’t change — you’re just feeding it fresh data. Over time, the trends become genuinely useful. A year of weekly uploads turns into a clear picture of whether your security posture is improving.
The visibility you already have the data for
The information in a good cybersecurity dashboard already exists somewhere in your organization. Incident logs, scan results, compliance trackers — most teams have all of it. The gap is that it’s in three different places in three different formats.
Bringing it together used to require a data engineering project. Now it takes a prompt.