“Portfolio dashboard” means two completely different things depending on who you ask.
Ask an investor, and they picture allocation breakdowns, return percentages, sector exposure, and performance vs. benchmark. Ask a project manager or a creative, and they picture a board of work — active projects, completion status, deliverable timelines, client distribution.
Both are right. And both can be built the same way.
The Investment Portfolio Dashboard
For investors — whether you’re managing a personal brokerage account, a retirement portfolio, or tracking multiple asset classes — the goal is identical: see the full picture without logging into five different platforms.
The numbers that belong on an investment portfolio dashboard:
Total portfolio value and change — Your balance today, vs. last week, last month, last year. The trend line matters as much as the number.
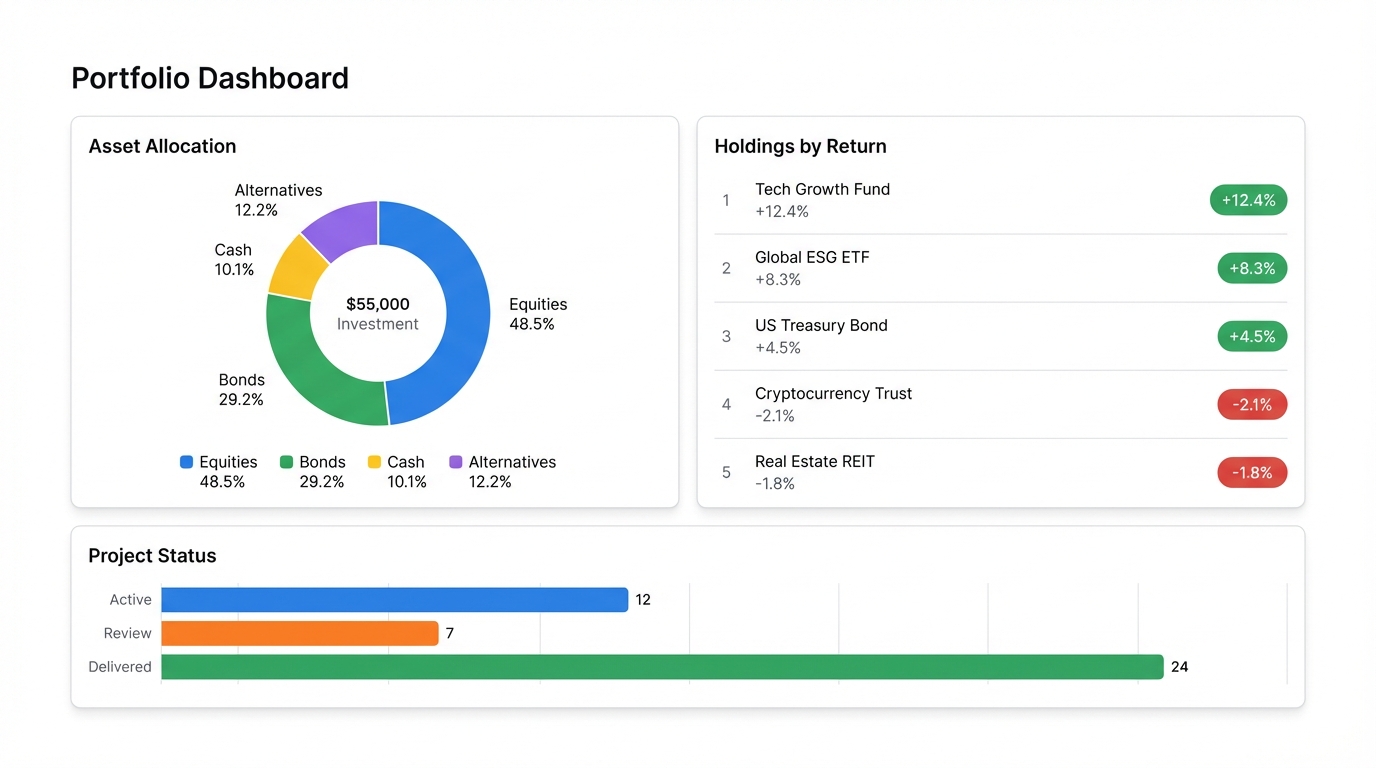
Asset allocation — How is the portfolio split across equities, bonds, cash, alternatives, crypto, real estate? A donut chart here is worth a hundred spreadsheet rows. If your target allocation is 70/30 and you’ve drifted to 58/42, you want to see that immediately.
Holdings performance — Individual positions sorted by return %. Which holdings are carrying the portfolio? Which are dragging it? Seeing this ranked makes rebalancing decisions obvious.
Sector and geography exposure — For equity-heavy portfolios, are you overconcentrated in tech? Underweight international? This view catches the risks that aren’t visible in the top-line numbers.
Dividends and income — Monthly or quarterly income from dividends, interest, or distributions. Especially relevant for income-focused investors.
To build this in Infograph: export your holdings from your brokerage (most have a “Portfolio CSV” download), upload it, and describe what you want. If you track multiple accounts, upload all of them together. The AI handles the consolidation.
The Project or Creative Portfolio Dashboard
For project managers and creatives, the portfolio dashboard answers a different question: what are we working on, how is it going, and what’s coming next?
The useful views here are:
Project status board — How many projects are in each stage (scoping, active, review, delivered, on hold)? A quick count by status tells you immediately whether you’re overloaded or underutilized.
Delivery performance — On-time vs. late delivery rates over the last quarter. Budget adherence. These are the numbers that go into a performance review or a client renewal conversation.
Workload by owner or team — If you’re managing multiple people, this view shows who’s carrying too much and who has capacity.
Revenue or value by client — For agencies, freelancers, or client-facing teams: which relationships drive the most revenue? Which clients consume the most time relative to what they pay?
Upcoming deadlines — A timeline view of what’s due in the next 30, 60, 90 days. The kind of view that makes resourcing conversations concrete.
Export your project data from whatever tool you’re using — a project tracker spreadsheet, a CSV from your PM software, a custom Excel workbook — and upload it. Describe the views you want and the dashboard builds around your data structure.
Same Workflow, Either Use Case
This is what makes AI-built dashboards different from traditional BI tools. You don’t configure a schema or write queries. You describe what you want in plain language, and the AI figures out how your data maps to those views.
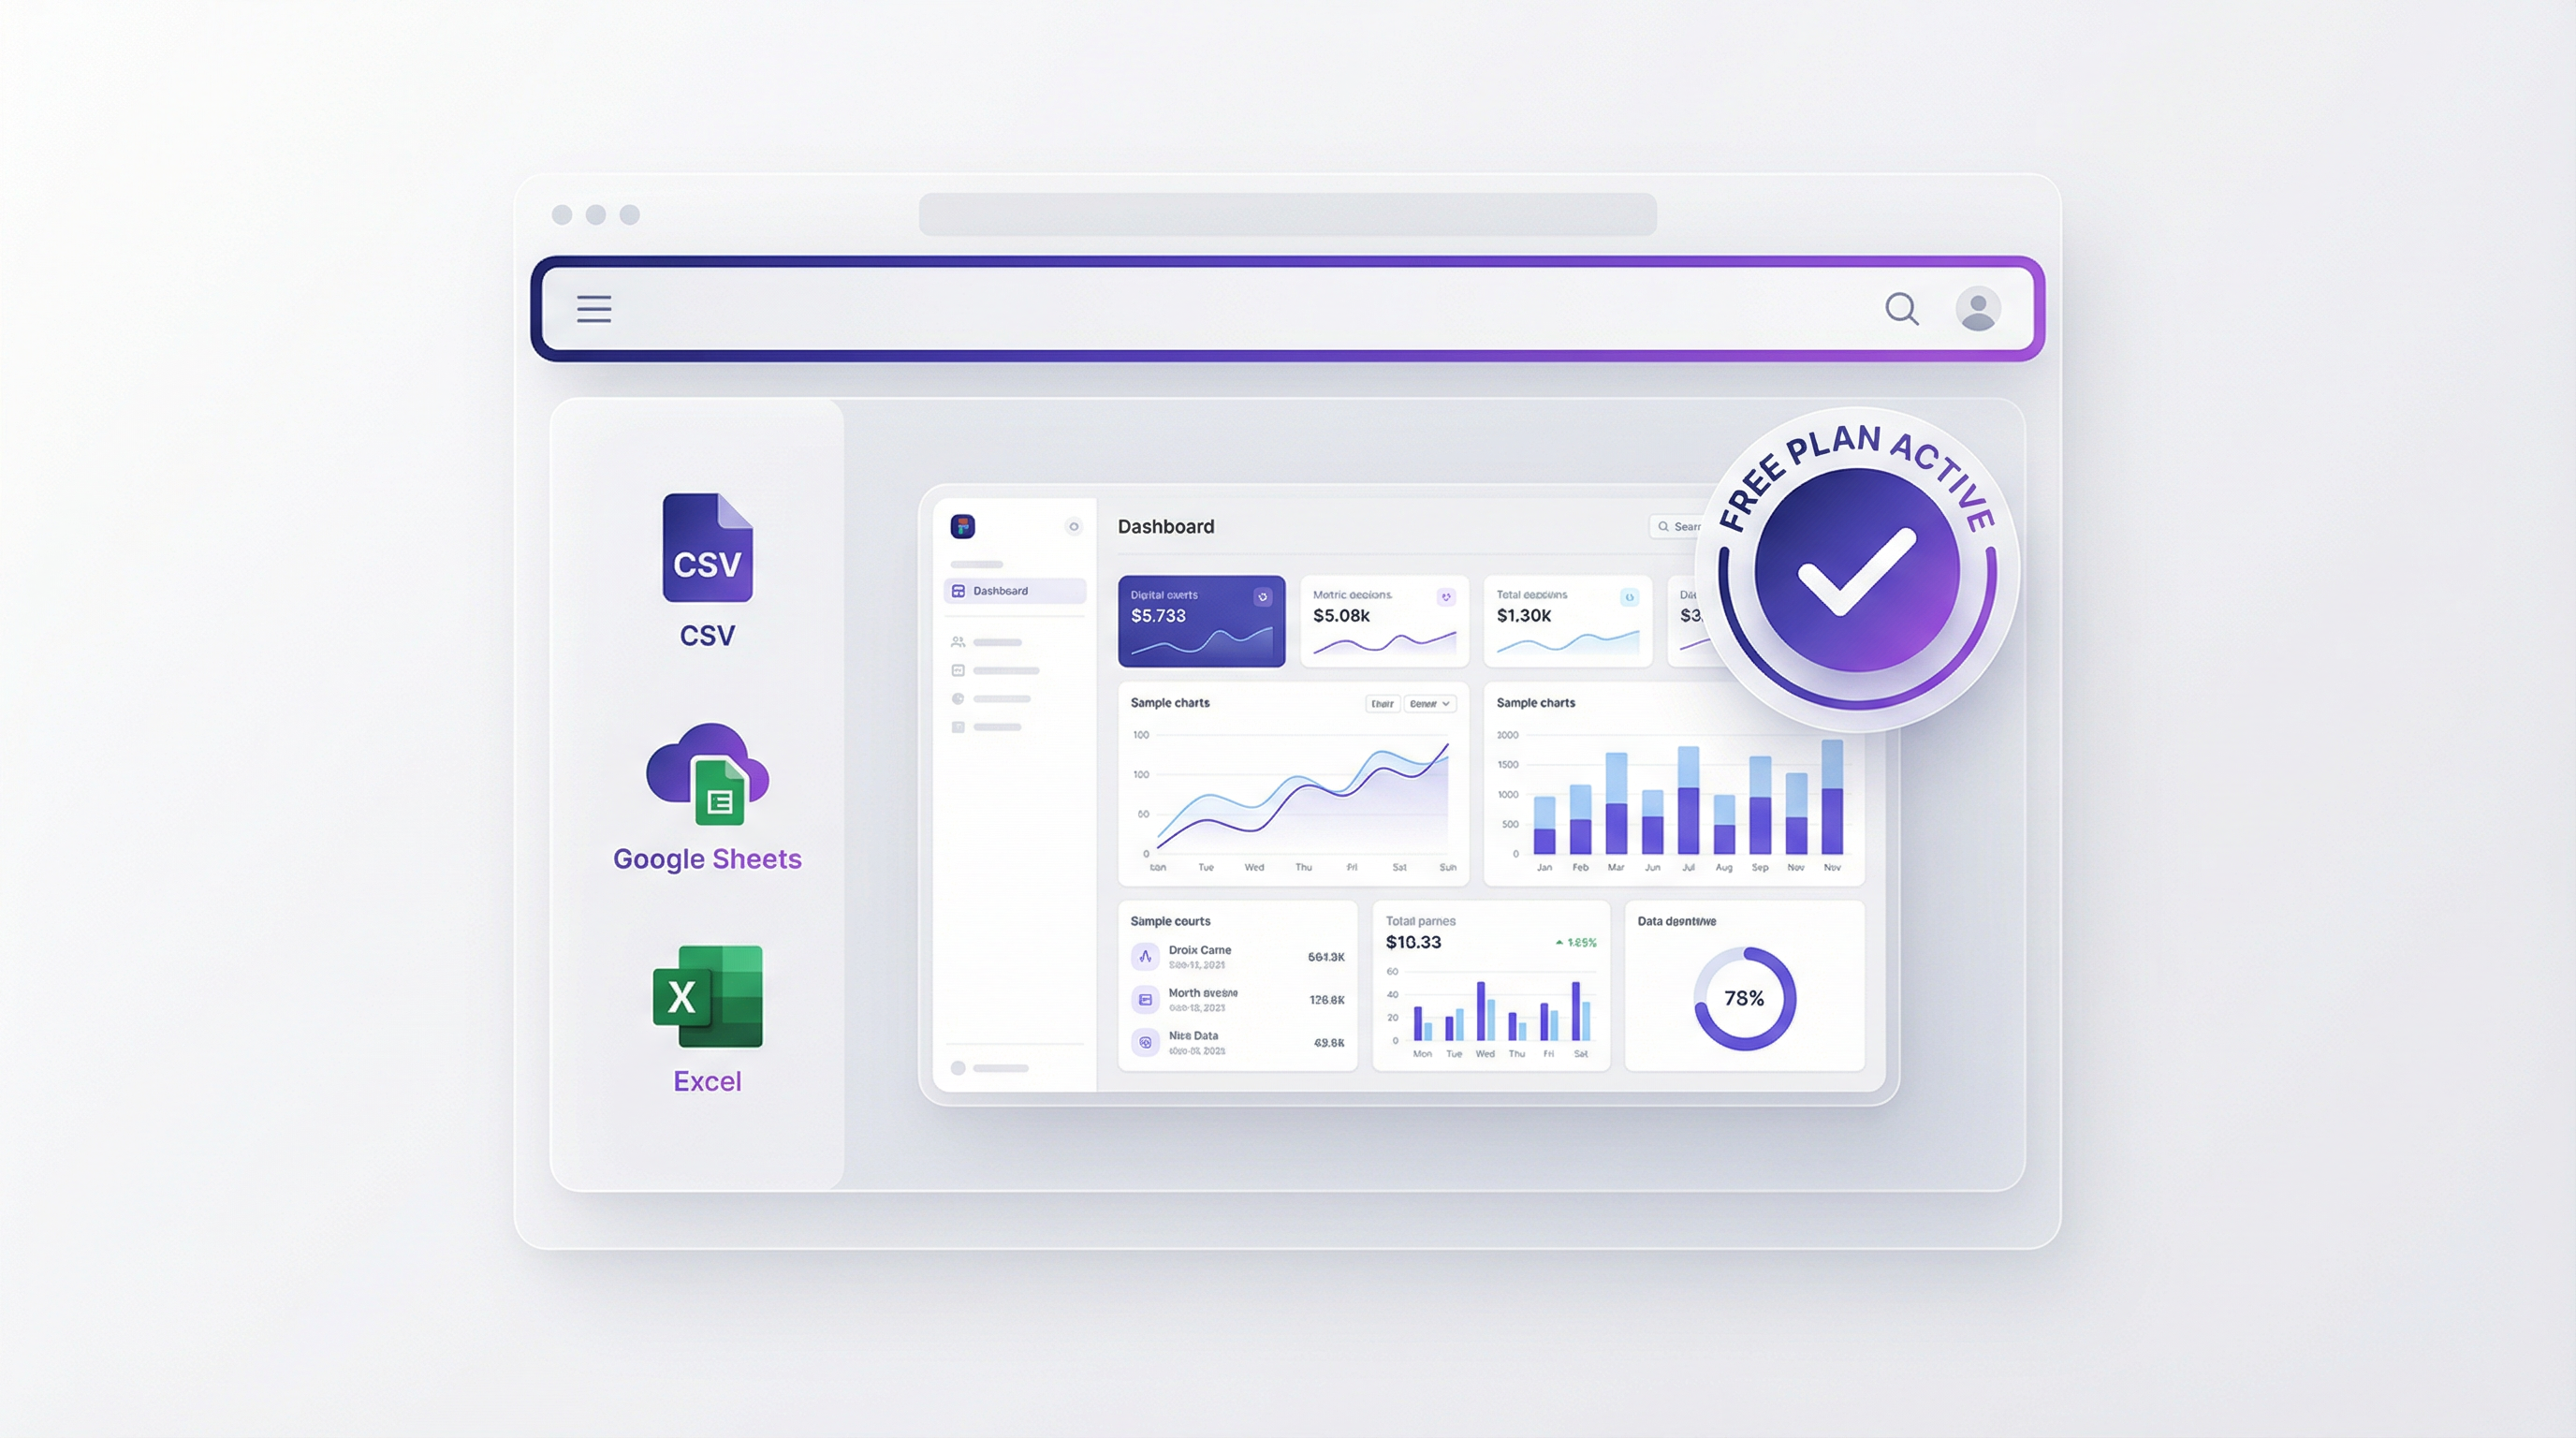
Upload your data. CSV, Excel, Google Sheets — whatever format your portfolio lives in. Multiple files work fine; upload them all together if you’re consolidating across sources.
Describe your dashboard. For investments: “Show me portfolio allocation by asset class, top holdings by return, and monthly dividend income.” For projects: “Show me project status breakdown, on-time delivery rate, and upcoming deadlines by client.”
Adjust in plain language. Change a chart type, add a filter, reorder the panels. Type what you want changed and it updates.
Connect live data for automatic updates. If your portfolio tracker or project list lives in Google Sheets or Excel Online, connect it directly. The dashboard refreshes when the spreadsheet updates — no re-uploading, no manual refresh.
The Difference a Dashboard Makes
Spreadsheets can hold all of this data. But scrolling through rows doesn’t give you a picture of your portfolio — it gives you numbers. A dashboard turns those numbers into something you can actually read in 30 seconds.
For investors, that means knowing your risk exposure before the market opens. For project managers, it means walking into a Monday standup with the full picture already in your head. For creatives, it means being able to show a client — or a potential employer — exactly what you’ve shipped and how it performed.
The data is already there. Building the view around it is the part that used to take days. Now it takes a prompt.