Your production data lives in six different spreadsheets. One for output, one for downtime, one for quality rejections, another that someone built in 2019 and nobody fully understands. You know the numbers — somewhere — but by the time you pull them together, the shift has already changed.
That’s the real problem with manufacturing operations: the data exists, but it’s scattered. A manufacturing dashboard brings it into one view, live, so you’re responding to what’s happening now instead of what happened yesterday.
Here’s exactly what to put in one and how to build it without a data team.
What a Manufacturing Dashboard Should Show
The best factory dashboards are ruthlessly focused. They don’t try to show everything — they show the metrics that determine whether today was a good shift or a bad one.
OEE (Overall Equipment Effectiveness) is the headline number. It’s availability × performance × quality, expressed as a percentage. World-class is 85%. Most plants are in the 60s. If your OEE is trending down and you don’t know why, that’s a problem the dashboard is designed to surface.
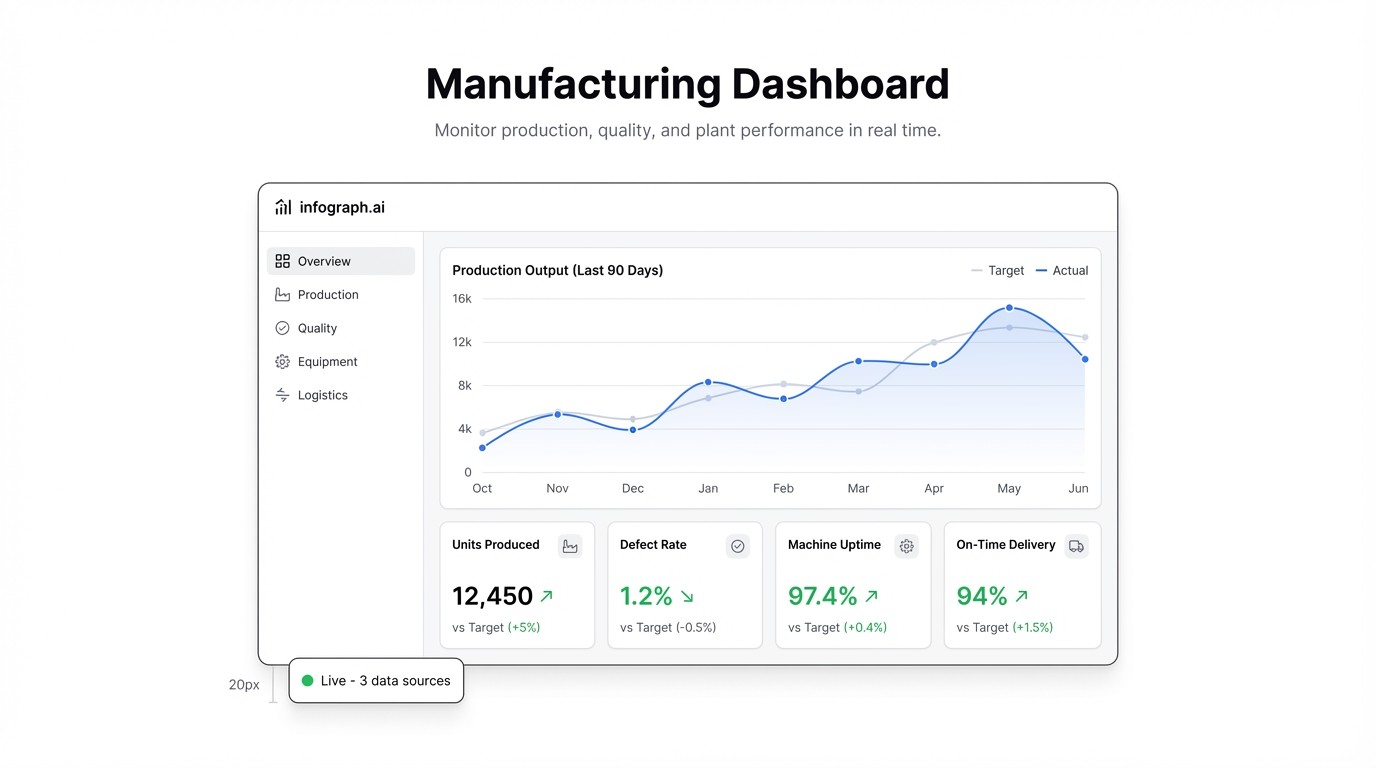
Production output vs. target tells you whether you’re hitting plan. Not just total units — units per hour, per line, per shift. The gap between target and actual is where you find problems.
Downtime by reason is where dashboards earn their keep. “Machine stopped for 47 minutes” is useful. “Machine stopped 11 times this week for changeover, 6 times for unplanned maintenance, and twice because the operator was waiting for materials” is actionable. Categorise your downtime and you’ll find the patterns fast.
Quality rejection rate — defects as a percentage of total output. Track it by shift, by line, by product type. A spike on night shift that doesn’t show up on days is telling you something specific.
Machine utilization shows you what percentage of available time each machine is actually running. Low utilization isn’t always bad (it might mean you’re not at capacity) but unexplained drops are worth investigating.
The Spreadsheet Problem
Most manufacturing teams track this in Excel. The daily production report, the downtime log, the quality inspection sheet — they all exist, they’re just separate, manually updated, and living on someone’s desktop.
The result: you get a weekly summary at best, and by then you’re managing history instead of operations.
The fix isn’t a $200,000 MES system. It’s connecting what you already have to a live dashboard.
How to Build a Manufacturing Dashboard with Infograph
If your team exports data from your PLC, MES, or ERP into CSV or Excel files, you can connect that directly to Infograph. If you log production data manually in a spreadsheet, Google Sheets or Excel Online works too.
Step 1: Get your data into a single sheet
You don’t need it to be perfect. You need: date, shift, line, units produced, units target, downtime minutes, downtime reason, defects, and total inspected. If you have that — even in a rough format — you’re ready.
Step 2: Connect to Infograph
Go to app.infograph.ai. Upload your CSV or Excel file, or connect your Google Sheet directly if you’re logging data live. The connection takes about 30 seconds.
Step 3: Describe what you want
Type something like: “Show OEE trend by week, daily output vs target as a bar chart, downtime breakdown by reason as a pie chart, and rejection rate by shift.”
The AI builds the dashboard. If something’s off, adjust the prompt. No formulas, no drag-and-drop layout editor, no SQL.
Step 4: Share with your team
Once it’s right, publish the dashboard. Share it with the plant manager, the maintenance team, the line supervisors. Set it up on a screen on the factory floor. When the data in the sheet updates, the dashboard updates with it.
What a Good Manufacturing KPI Dashboard Changes
When everyone is looking at the same numbers in real time, things shift quickly:
- Maintenance knows which machines are causing the most downtime before a supervisor flags it
- Quality issues get caught during the shift, not in the morning debrief
- Supervisors can see output vs. target without waiting for the end-of-day report
- Management gets a clean view across all lines without calling anyone
The spreadsheet doesn’t go away — but it stops being the end point. It becomes the input.
Get Started
Infograph is free to start — one dashboard, no credit card required. If you need multiple dashboards or want to connect a live Google Sheet or Excel Online file, Pro is $19.99/month.
A production dashboard that updates itself is not a luxury. It’s how you stop managing yesterday’s problems.


