Airtable is genuinely good at what it does. The flexible base structure, the combination of spreadsheet and database thinking, the views — it’s a tool people actually enjoy using. If you’re tracking projects, managing a content calendar, or running a CRM out of Airtable, it probably works well.
The dashboards, though. That’s where things get complicated.
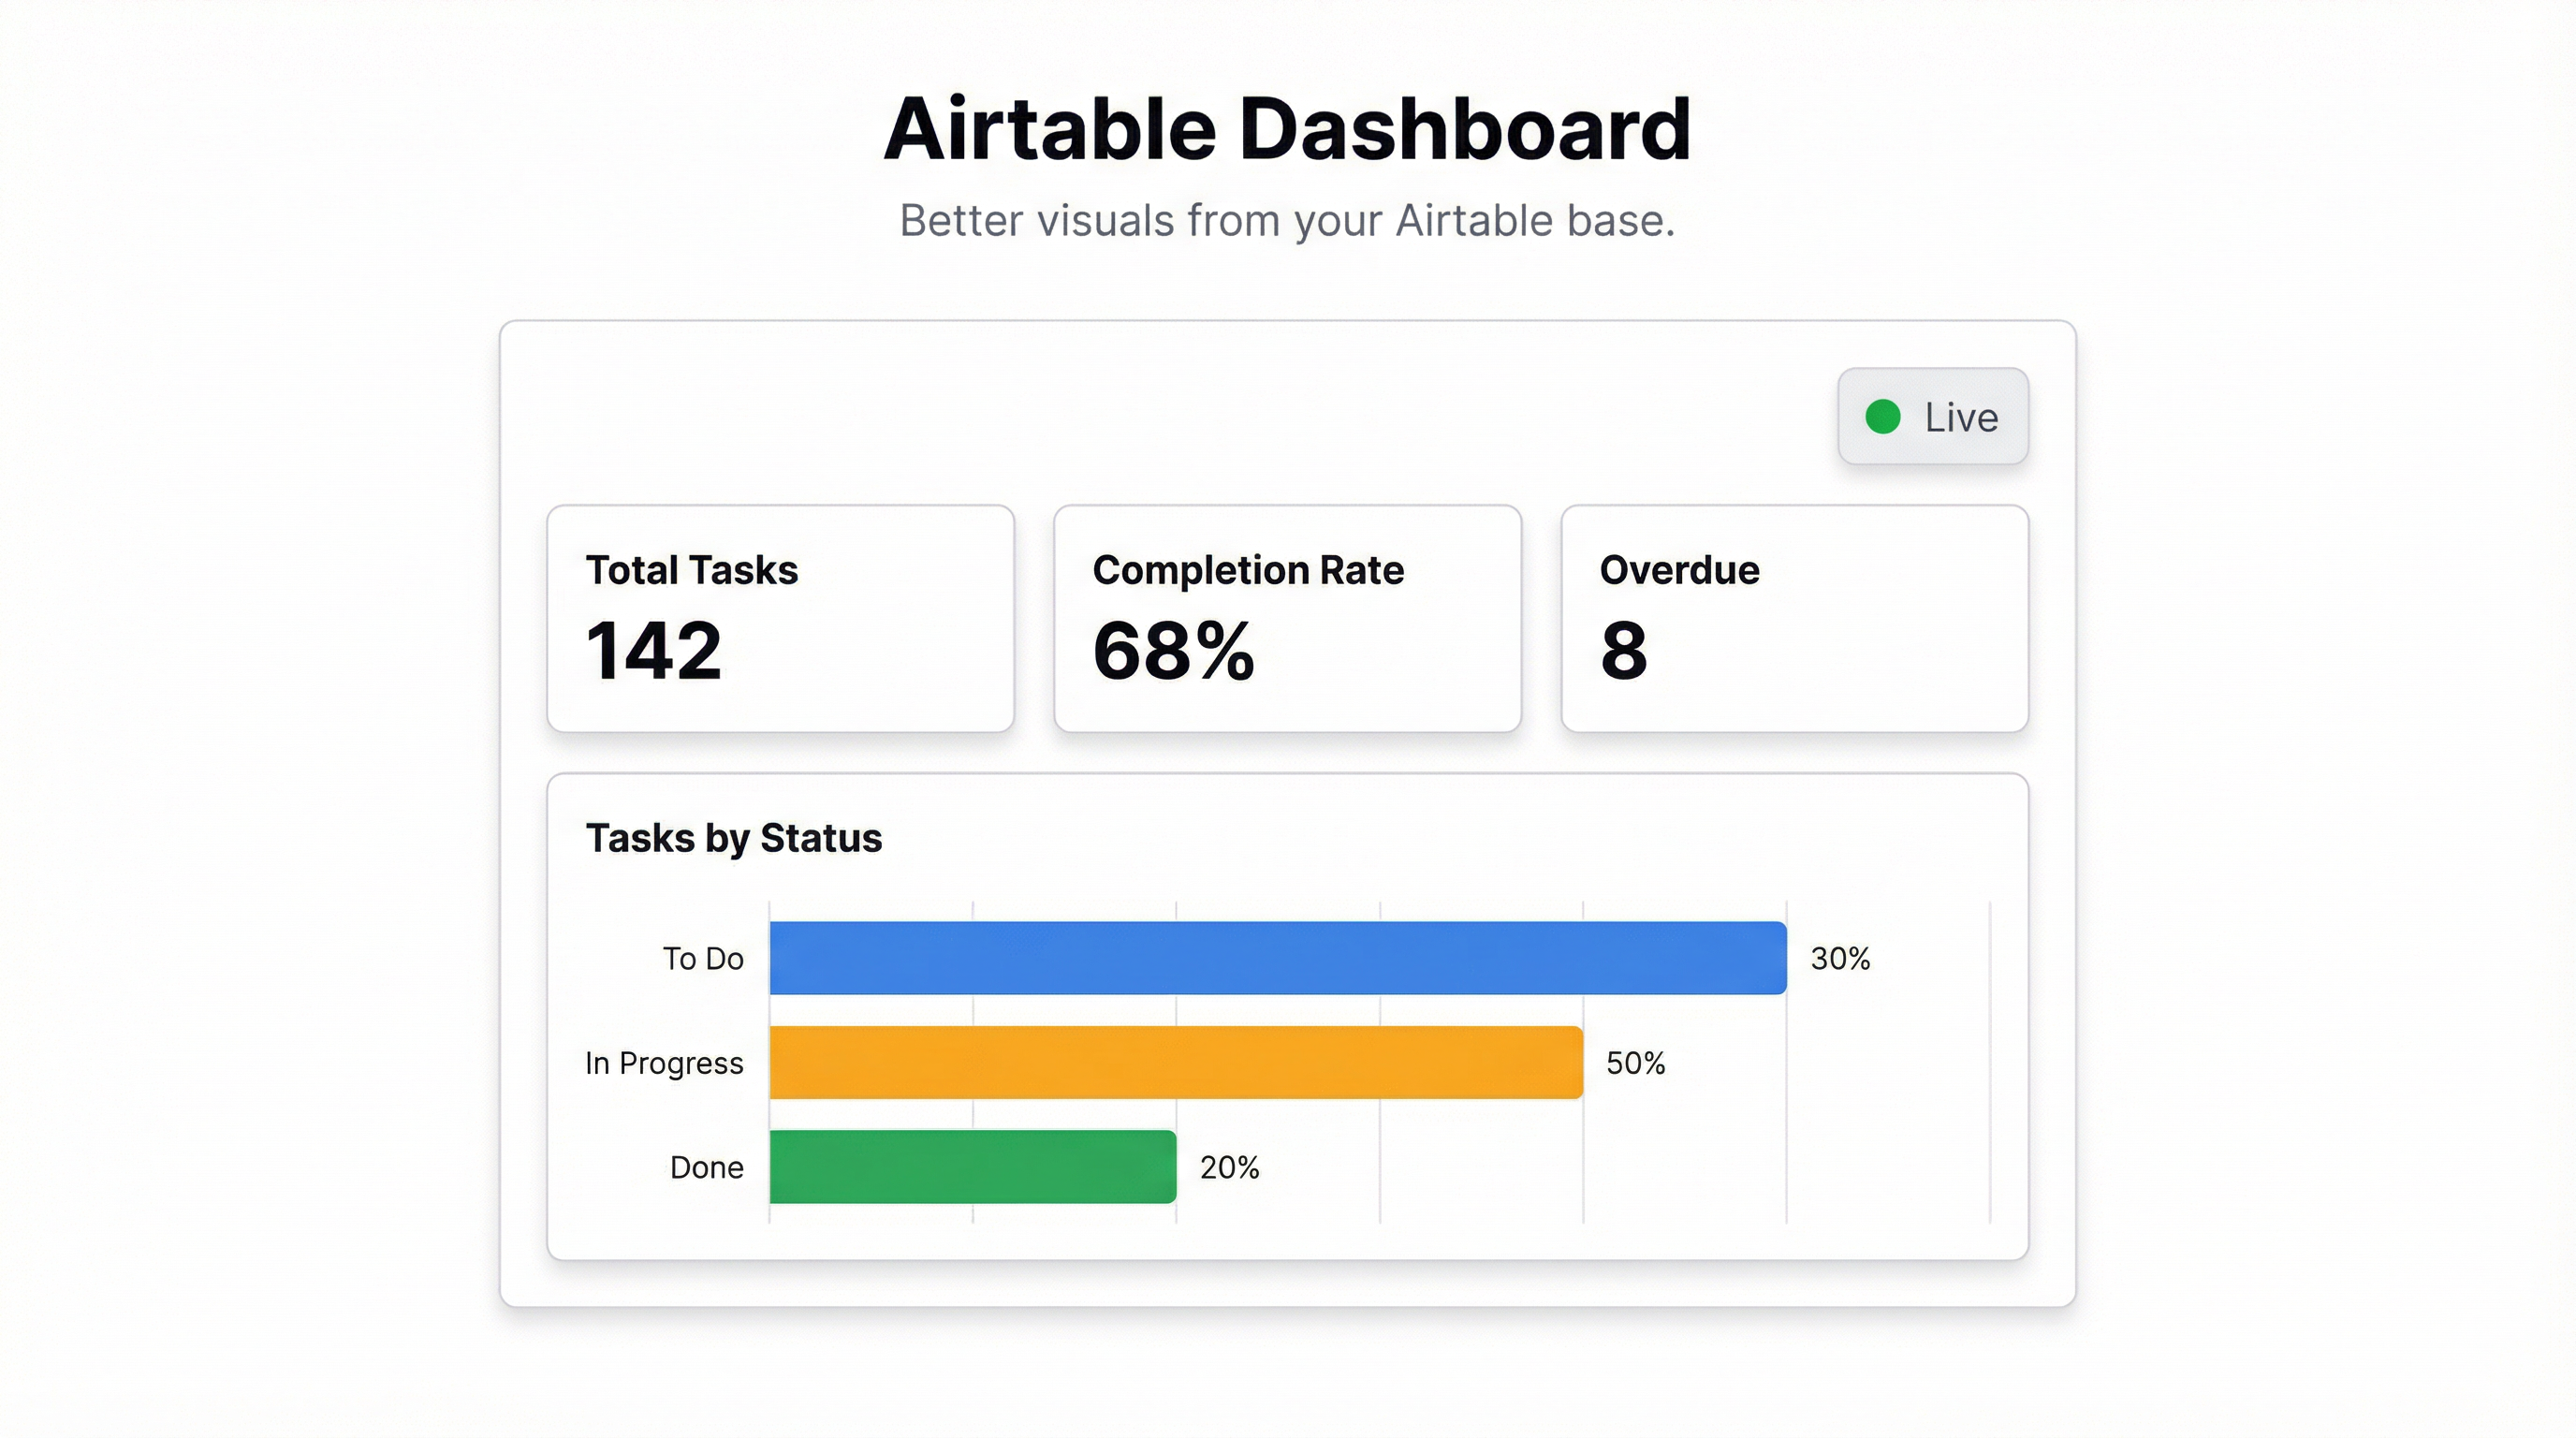
Airtable has an Interface Designer and a set of dashboard extensions. They’re not bad for simple use cases. A bar chart showing tasks by status, a count of records in different categories — fine. But the moment you want something more than that, you start running into walls fast.
What Airtable’s Dashboard Tools Actually Do
The Interface Designer (the newer offering) lets you build interfaces on top of your base data. You can embed charts, galleries, and record detail views. It’s reasonably polished.
The extensions — the ones you add to the “Extensions” sidebar — include chart types from Vega-Lite, pivot table capabilities, and a few specialised tools.
Here’s where it breaks down in practice:
You can’t combine data from multiple bases in a single chart. If your project data lives in one base and your revenue data in another, you’re not building a cross-base summary dashboard inside Airtable. That’s a hard limitation.
The chart customisation is limited. You get what the extensions give you: basic control over chart type, some color options, axis labels. If you want a specific layout, precise formatting, or chart types beyond the basics, you’re out of luck.
And the sharing story isn’t great. Sharing an Interface page requires giving people access to your base — there’s no “publish a public dashboard link” option like you’d find in a proper dashboard tool.
Getting More From Your Airtable Data
There are a few directions you can go.
Export and rebuild elsewhere. Airtable supports CSV export from any view. If you need a one-time report or a presentation, exporting the relevant records and building a dashboard in another tool is the fastest path to something polished.
The downside: it’s a snapshot. You export, you build, your data goes stale. For anything that needs to stay current, this doesn’t scale.
Use Airtable automations to sync data. Airtable’s automation layer can push data to Google Sheets on a schedule or trigger. If you set this up, you can use a dashboard tool that connects to Sheets directly — and get a live dashboard that reflects your Airtable data without re-exporting.
It’s some setup, but it works.
Connect directly to a proper dashboard tool. This is the cleanest option if you want dashboards that genuinely update.
Using Infograph with Your Airtable Data
Infograph connects directly to Google Sheets and Microsoft Excel Online. So the workflow looks like this:
- Set up an Airtable → Google Sheets sync (using Airtable automations, or a tool like Zapier/Make)
- Connect the Google Sheet to Infograph
- Describe the dashboard you want in plain language
From there, the AI builds it. “Show me tasks by status this week, with a trend line for completion rate over the last 30 days, and flag anything overdue.” You get a dashboard. Edit it in plain language from there.
The live connection means your dashboard reflects the current state of your Airtable data — not a CSV you exported last Tuesday.
You can share the dashboard publicly, behind a password, or restricted to your team. No one needs an Airtable account to see it.
What to Build When You Get There
A few dashboard types that work particularly well with Airtable data:
Project tracking dashboards. Task counts by status, completion rate over time, tasks per assignee, overdue items highlighted in red. Exactly the overview that Airtable’s own interfaces hint at but don’t quite deliver.
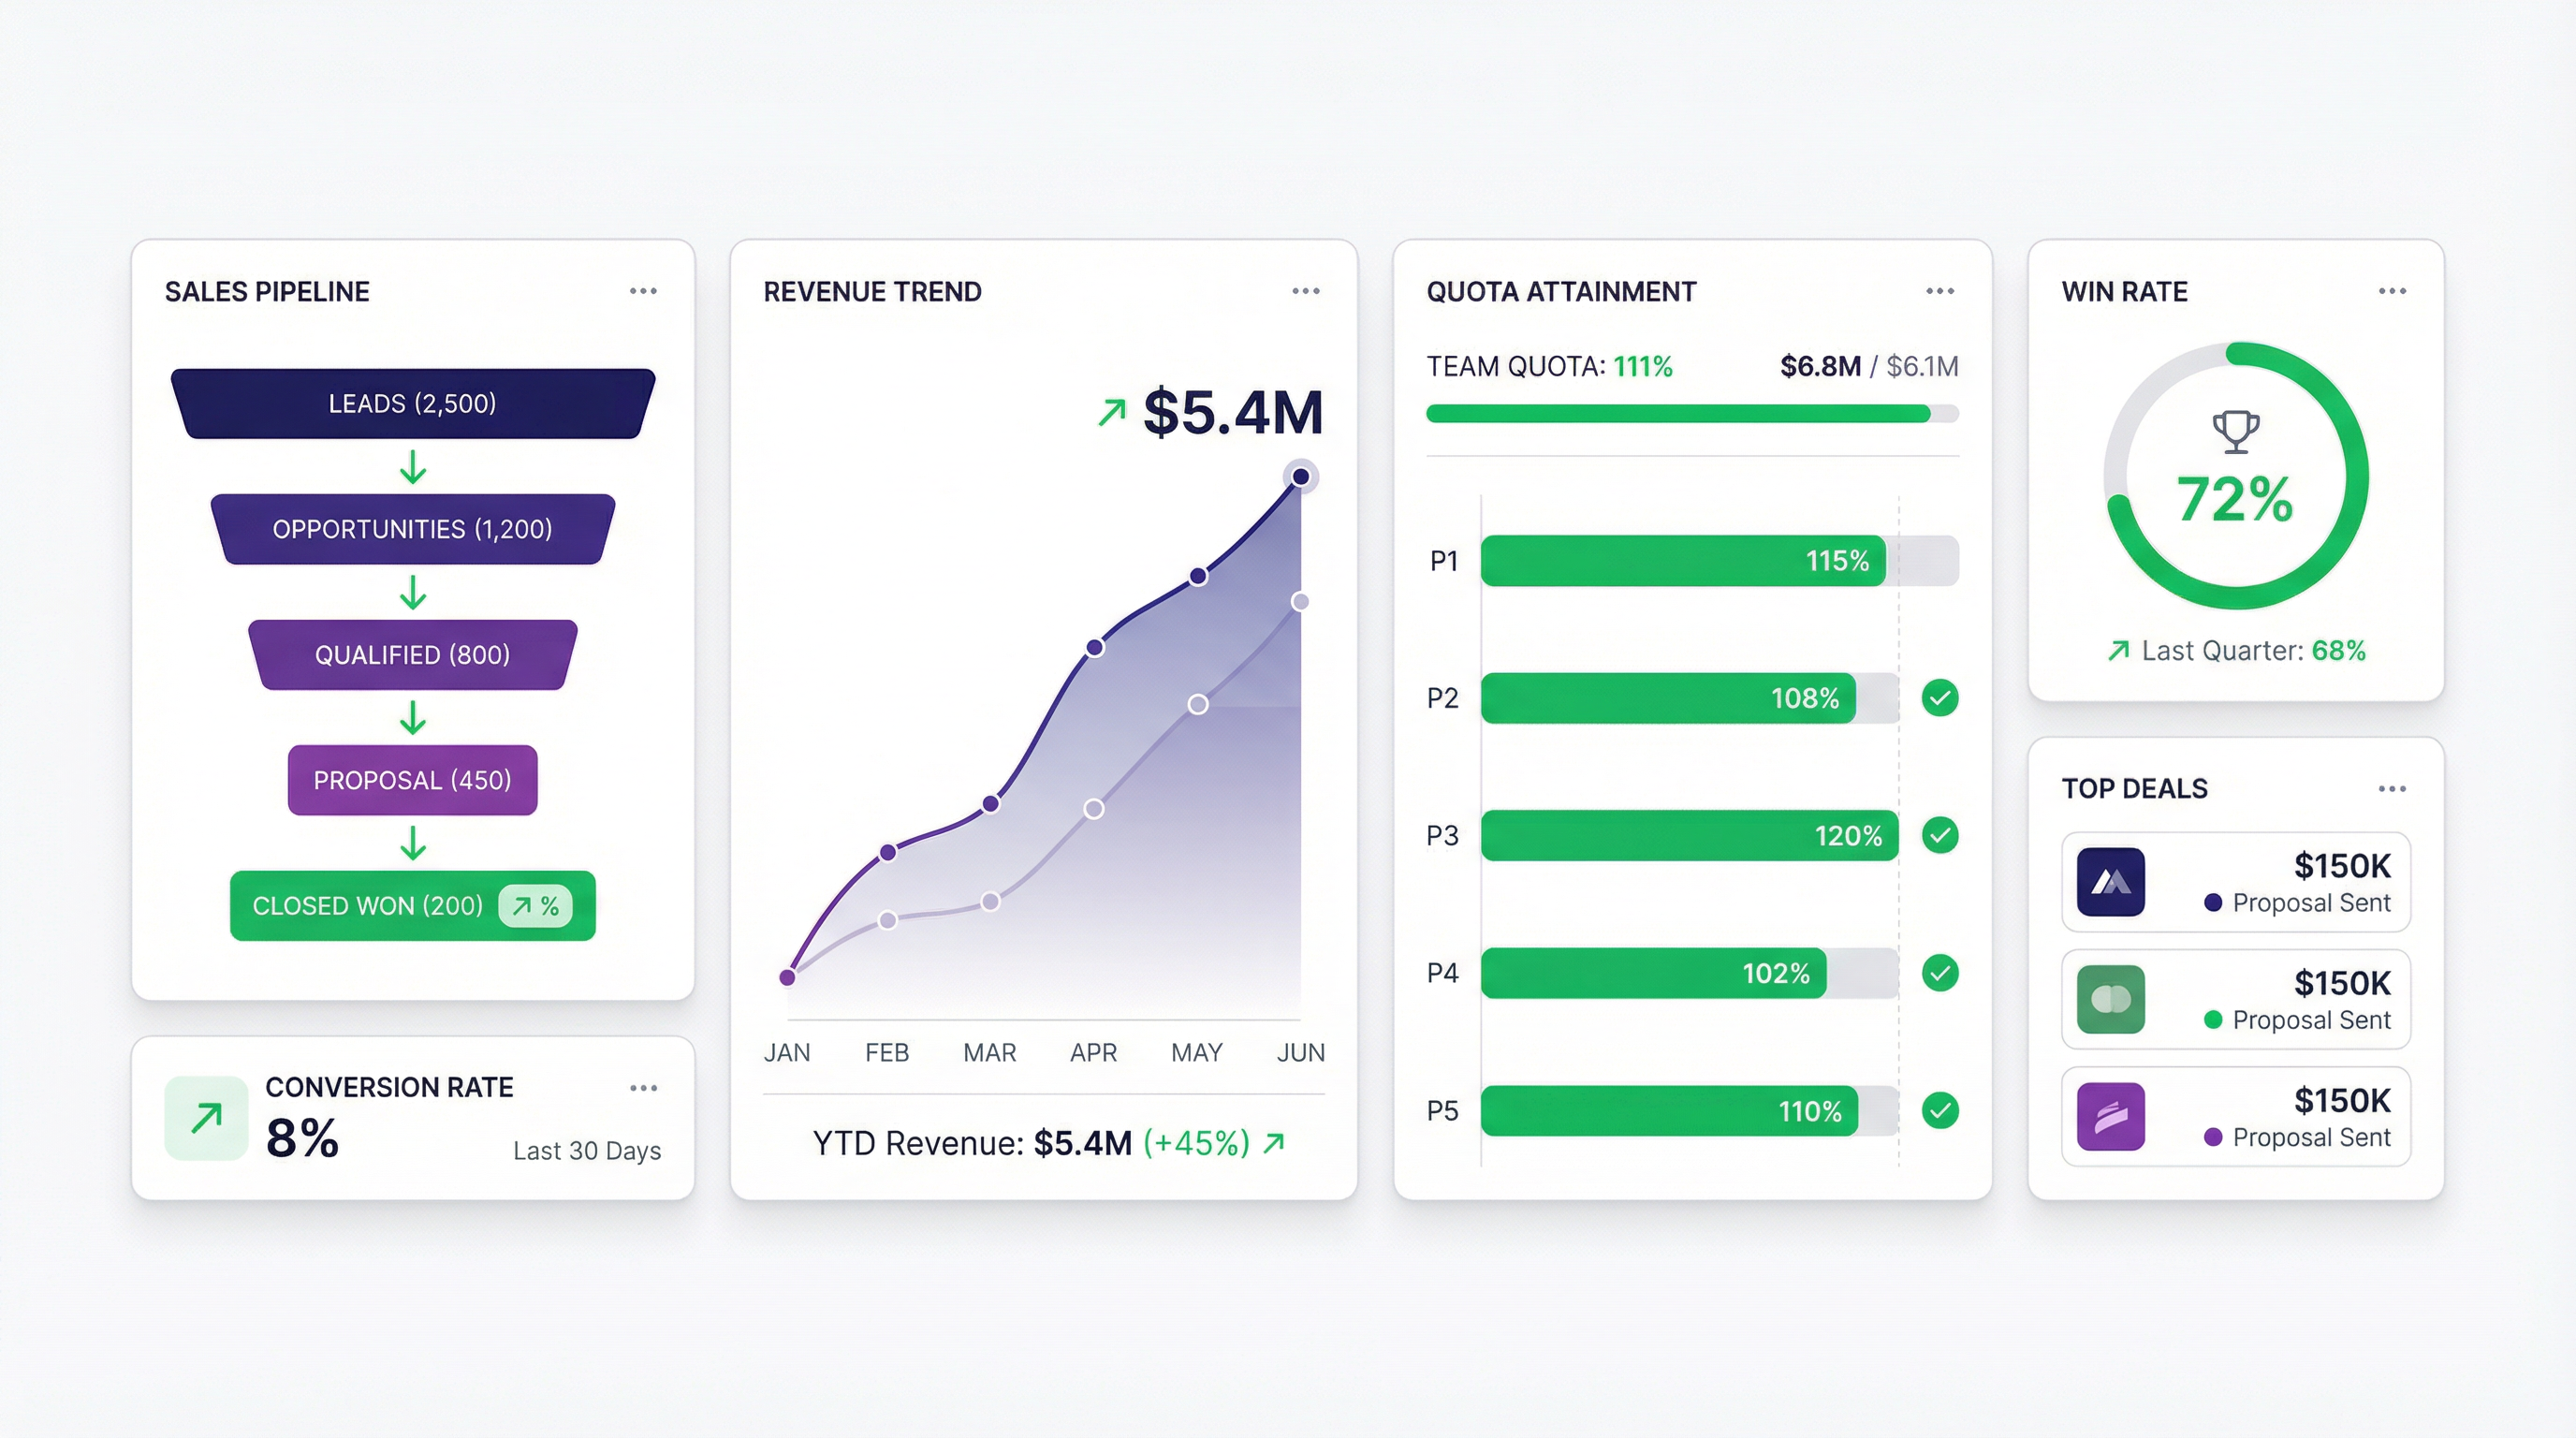
CRM pipeline dashboards. If you’re running your sales pipeline in Airtable, a dashboard showing deals by stage, average time in each stage, and closed-won by month is the view your leadership team actually wants.
Content calendar dashboards. Pieces by status, publish dates on a timeline, writers by volume. The kind of overview that makes a content calendar useful beyond the people actively editing it.
Inventory or product tracking. Stock levels, reorder triggers, supplier breakdown — if the data’s in Airtable, the dashboard is a prompt away.
The Honest Assessment
Airtable isn’t a dashboard tool. It’s a database tool with some dashboard capabilities bolted on. For a lot of teams, those built-in capabilities are enough. For teams that need dashboards that are genuinely shareable, live, and customisable — Airtable’s own tools will eventually disappoint.
The path forward is connecting your Airtable data to something built specifically for dashboards. The sync setup takes an afternoon. The dashboard itself takes a few minutes.
If your Airtable data is worth tracking, it’s worth building a dashboard that actually shows it clearly. Start with Infograph for free — connect your Sheet, describe what you need.