Managing a portfolio of client accounts without a dashboard is like managing a portfolio of investments without looking at prices. You technically could do it — but you’re flying blind, and something will go wrong that you could have caught earlier.
An agency dashboard gives you visibility across all accounts at once: which clients are performing, which campaigns are off track, and where your team’s time is being spent.
What an Agency Dashboard Tracks
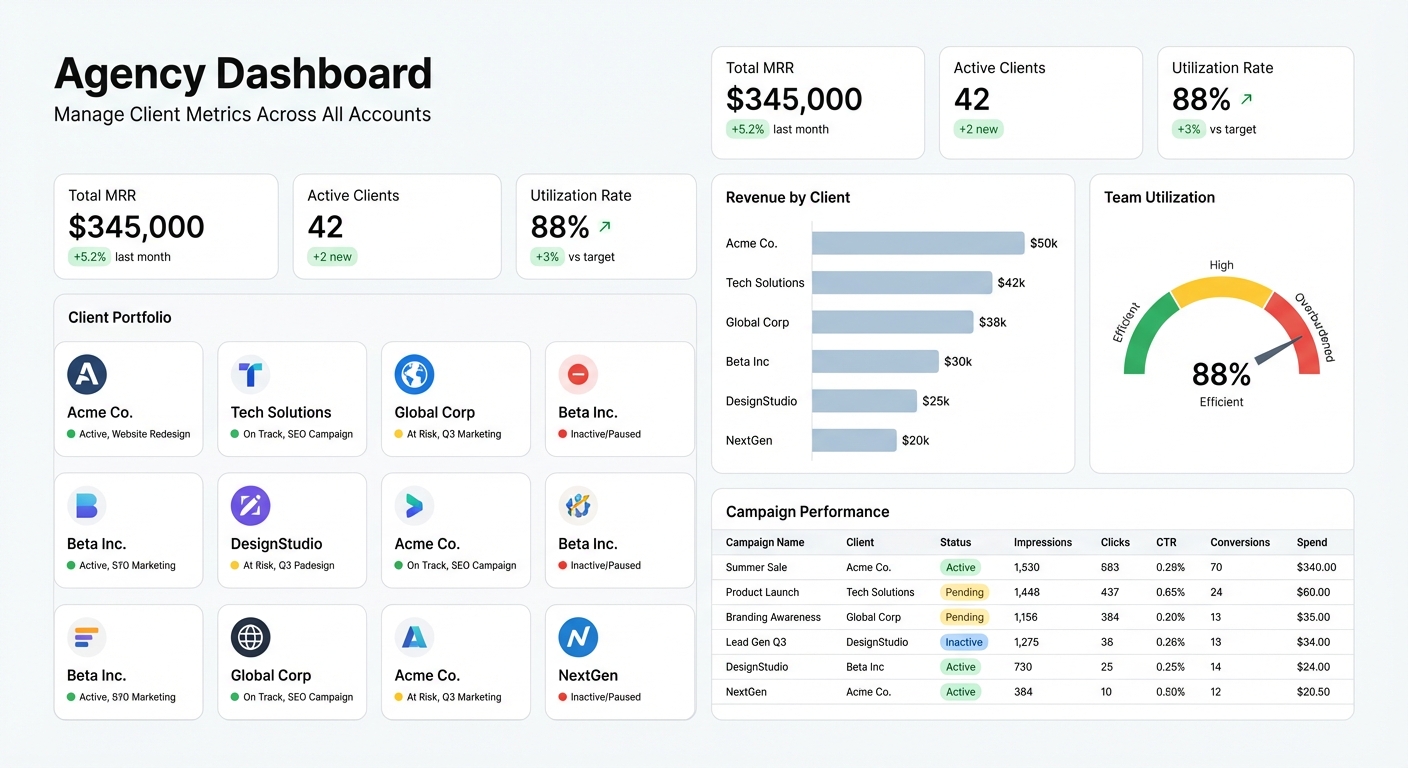
Client Portfolio Overview
The top-level view every agency needs:
- Active clients and status (healthy, at-risk, churning)
- Revenue by client — MRR, project revenue, or retainer value
- Clients up for renewal in the next 60/90 days
- NPS or CSAT scores by client — where do you have detractors?
At-risk flagging is the most valuable part of this view. When you can see which clients haven’t had a check-in in 30 days, or which accounts have shown declining engagement scores for two months straight, you can act before they cancel.
Campaign Performance by Client
For marketing and advertising agencies:
- Spend vs budget this month, by client and channel
- Key performance metrics by client — clicks, conversions, ROAS, CPC depending on the channel
- Campaign pacing — on track to hit monthly targets, or overspending/underspending?
- Performance trend — improving week over week, or declining?
The tricky part of multi-client dashboards is that metrics aren’t always comparable. Client A cares about ROAS, Client B cares about brand impressions, Client C cares about lead cost. A good agency dashboard handles this by showing each client’s primary KPI at the portfolio level, with a detail view that goes deeper per account.
Team and Capacity Metrics
- Billable hours by team member vs capacity
- Hours by client — are any accounts getting more time than they’re paying for?
- Utilization rate — what percentage of available hours are billable?
- Project milestone status — which deliverables are on track, behind, or at risk?
Utilization is where most agencies leak money. A team member at 65% billable utilization isn’t a staffing problem — it might be a scoping problem, or a process problem, or just poor visibility into where time is going. The dashboard surfaces it; the agency fixes it.
Financial Health
- Revenue vs forecast this month and quarter
- Outstanding invoices and aged receivables
- Profit margin by client — some clients cost more to serve than the revenue justifies
- New business pipeline — upcoming contracts, proposals, and their estimated values
Profit margin by client is the uncomfortable analysis most agencies avoid. Some clients are high-maintenance, require constant revisions, and take twice the hours budgeted. Others are smooth, self-sufficient, and highly profitable. Knowing the difference lets you price, staff, and prioritize accordingly.
Building Your Agency Dashboard
Agency data is scattered across many tools: project management (Asana, Monday, Jira), time tracking (Harvest, Toggl), advertising platforms (Google Ads, Meta), and spreadsheets where the rest lives.
The practical approach for most agencies: export weekly summaries from each tool into a central Google Sheet or Excel file, then build the dashboard on top of that.
Using Infograph for Multi-Client Dashboards
Infograph connects to Google Sheets or Excel Online and builds multi-client dashboards from a prompt.
Connect your master tracking spreadsheet and prompt: “Show revenue by client as a ranked bar chart, utilization rate by team member, campaign spend vs budget for each active client, clients sorted by NPS score, and accounts up for renewal in the next 90 days.”
The dashboard builds from that prompt and updates as your data changes. Share separate dashboard links with different audiences — your own leadership team sees everything, individual clients see only their own account data.
The Client Dashboard
One thing agencies often overlook: the dashboard you share with clients.
A client-facing dashboard showing campaign performance, spend pacing, and results to date is a retention tool. Clients who can see their results in real time ask fewer questions, have more productive check-in calls, and are easier to renew because the value is visible.
Build a client view as a filtered version of your internal dashboard. Show the metrics they care about — hide the ones they don’t. Share it as a read-only link that updates automatically.
When clients say “I always know what’s happening with my account,” they don’t cancel.
The Agency That Has Visibility Wins
The best agencies are moving fast across many accounts simultaneously. Visibility is the advantage: knowing which client needs attention today, which campaign is off-pace this week, which team member has bandwidth to take on more work.
An agency dashboard doesn’t make decisions for you — it makes sure you’re making decisions with current information instead of outdated reports.
Build your agency dashboard and run your accounts with confidence. Start at app.infograph.ai.