Most customer success teams manage churn risk the same way: a shared spreadsheet, a color-coded column called “health,” and a lot of gut feel. It works until it doesn’t — usually around the time your customer count doubles and the spreadsheet becomes a liability instead of an asset.
A proper customer success dashboard doesn’t replace judgment. It makes judgment faster and more accurate by surfacing the signals that actually predict churn before it’s too late to act.
Here’s what belongs on one.
The metrics that matter for CS
Health score is the most important and the hardest to get right. It’s a composite — typically a weighted average of product usage, support ticket volume, NPS response, and contract stage. The weights depend on your product. For a tool people use daily, login frequency matters. For a tool that runs quarterly processes, it doesn’t. Know the difference before you build it.
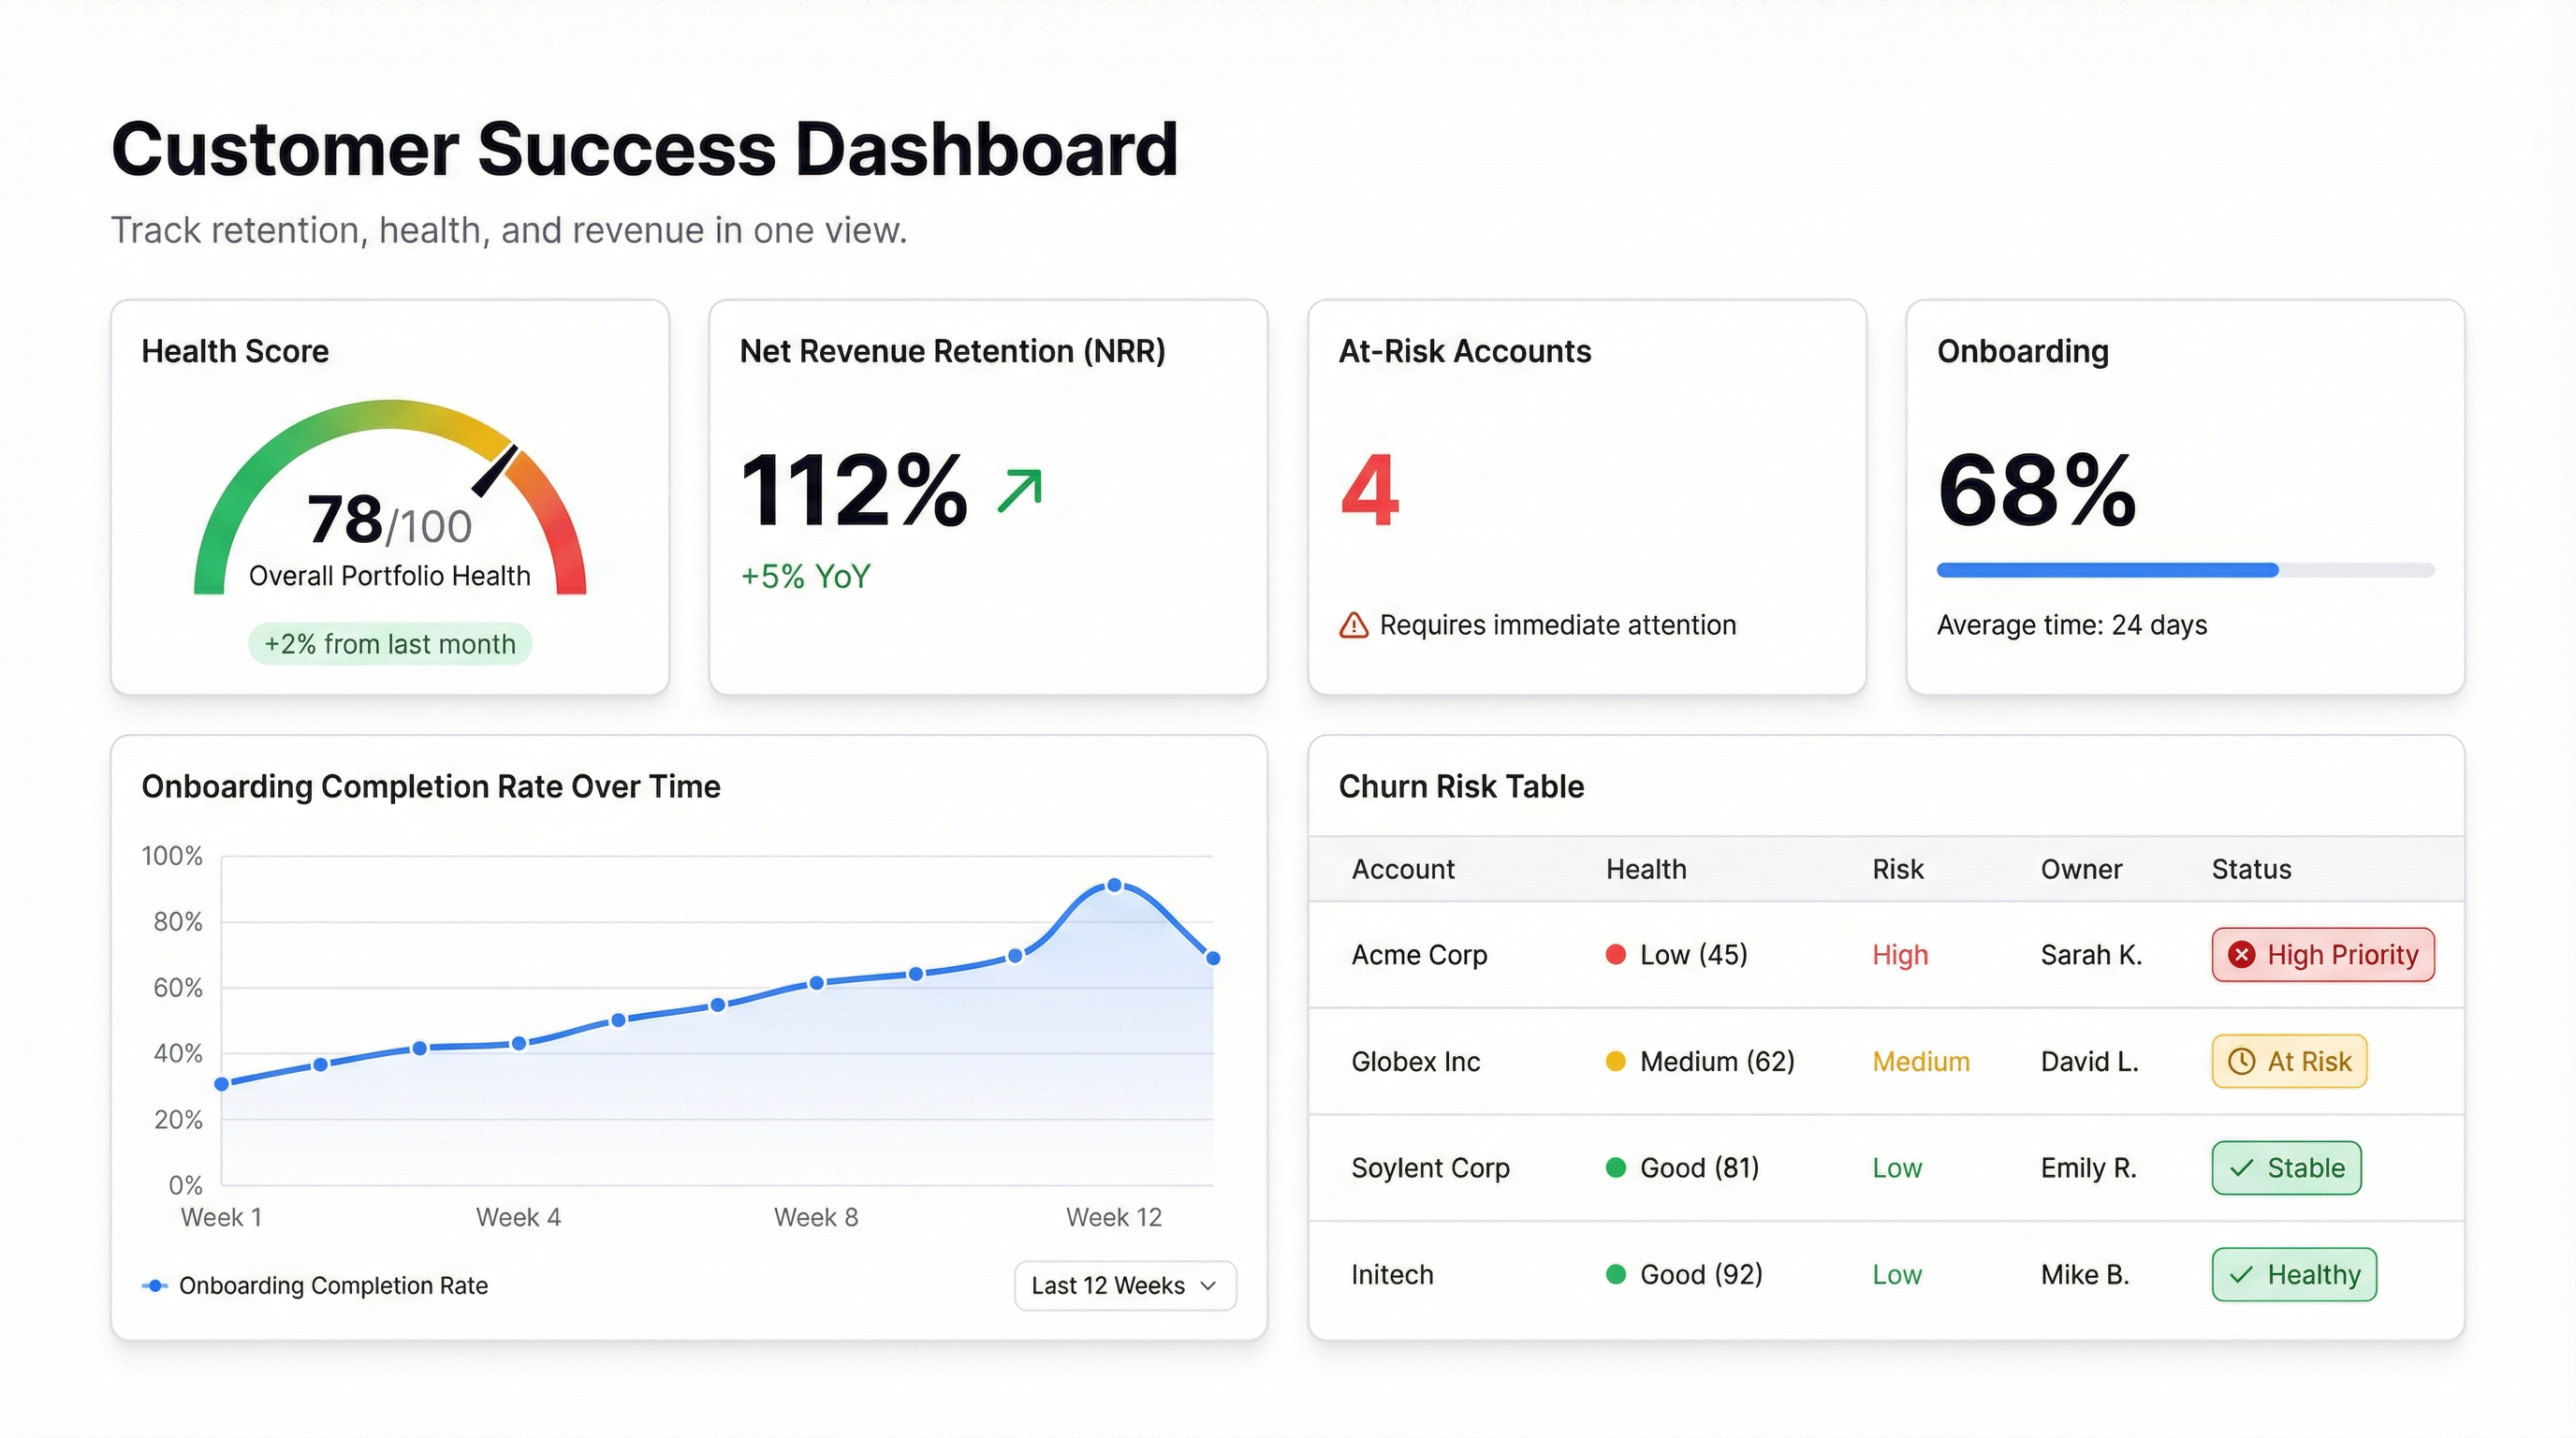
Net Revenue Retention (NRR) tells you whether your existing customer base is growing or shrinking, independent of new sales. If NRR is above 100%, expansion is covering churn. If it’s below 90%, you have a retention problem that no amount of new business will fix. This number belongs at the top of every CS review.
Churn risk cohort — not just a count of at-risk accounts, but a segmented view: which accounts, what tier, how much ARR, and what’s driving the risk signal. “12 accounts at risk” is useless. “12 accounts at risk, $340K ARR, all triggered by 30-day usage drops” tells you exactly where to spend Tuesday morning.
Onboarding completion rate is the early warning system. Customers who don’t complete onboarding churn at a rate that would make your head spin. Track it by cohort, by CSM, and by plan tier. If one cohort stalls at step 3, that’s a product problem. If one CSM’s book has low completion across the board, that’s a coaching conversation.
Product adoption by feature shows you whether customers are using the parts of your product that create stickiness. A customer using one feature is fragile. A customer using five is embedded. This view is also useful for expansion conversations — low adoption of a premium feature by a customer on a lower tier is a natural upsell signal.
Time to first value is the metric almost nobody tracks and almost everybody should. How long from signup to the first meaningful outcome? For a dashboard tool, that might be “first shared dashboard.” For a CRM, it might be “first deal closed.” If this number is measured in weeks, your onboarding has a problem.
Why spreadsheets break down
The issue isn’t that spreadsheets can’t hold this data — they can. The issue is that they’re static. By the time someone updates the health column and shares the file, the underlying data has moved. A customer who was green on Monday might have gone dark by Thursday, and nobody knows until next week’s sync.
A live CS dashboard pulls from your CRM, your product analytics, and your billing system simultaneously. When a customer’s usage drops below threshold at 9am, it shows up on the dashboard at 9am — not at the next meeting.
The second problem is that spreadsheets don’t scale with your team. When you have 50 customers, a single shared file is fine. At 200, you need filtering by CSM, by region, by tier. At 500, you need alerts and automated workflows. The spreadsheet doesn’t grow with you.
Building a CS dashboard in Infograph
If your CRM exports to CSV or connects via Google Sheets, you can have a working version in under an hour.
Start with the data you have. Most teams have account data in their CRM, usage data from their product (even if it’s just login counts from an admin panel), and billing data from Stripe or their billing system. Export all three to separate sheets.
Connect them in Infograph. Describe what you want — “show me customer health by CSM, flag any account with a usage drop of more than 20% in the last 30 days” — and the AI builds the view. Adjust as needed. Add your health score formula once you’ve agreed on the weights.
Share it with your team. A live dashboard that every CSM can open from their phone before a customer call is worth more than a weekly deck that nobody updates.
The customers who churn don’t usually disappear overnight. They go quiet, they stop logging in, they stop expanding. A dashboard that shows you those signals when they’re still reversible is the difference between retention and a cancellation email.
Build the view. Then act on what it shows you.


