Your CRM has all the data. That’s never the problem.
The problem is that getting anything useful out of it requires either a BI analyst, a Salesforce admin with three hours free, or a HubSpot report that technically answers your question but makes you re-read it three times before you’re sure.
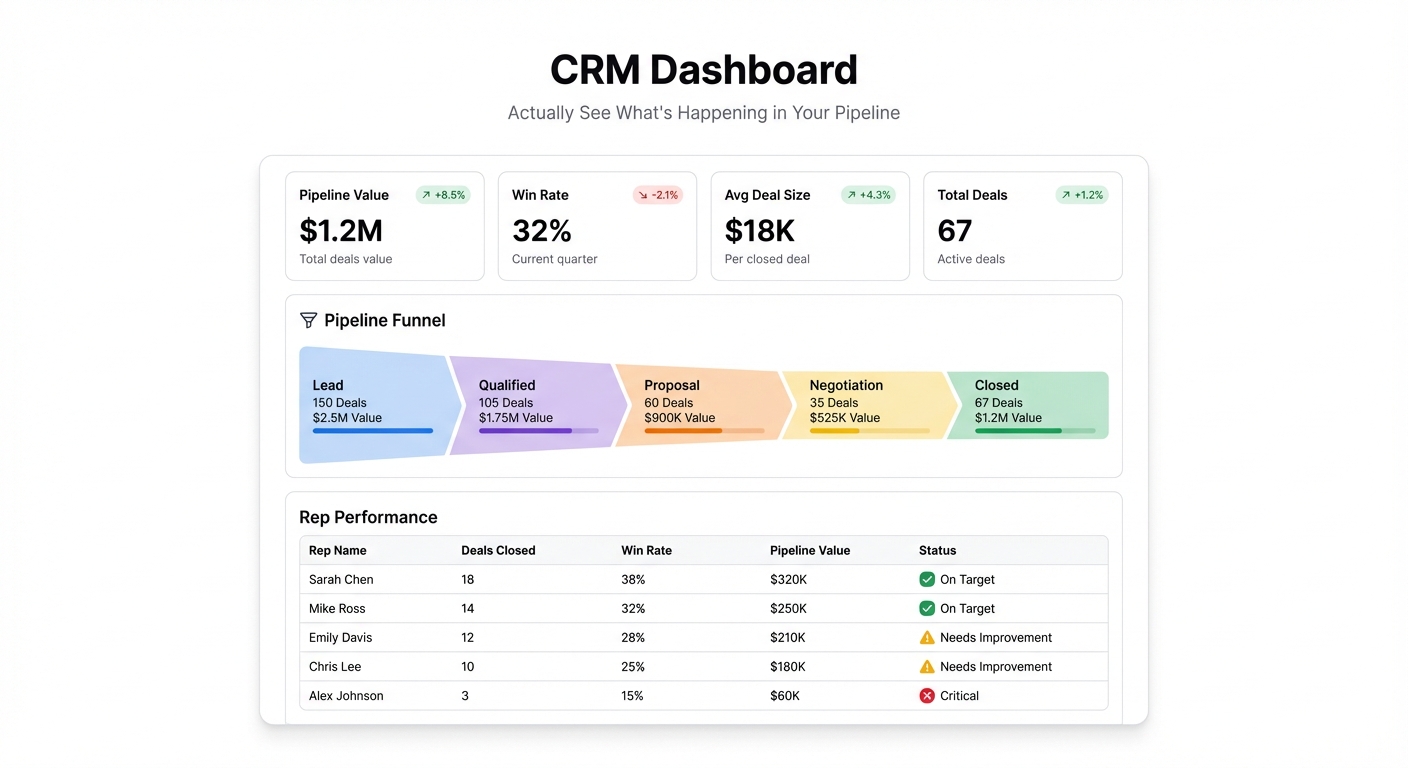
A CRM dashboard should tell you the thing you actually need to know before your Monday pipeline review. Not after clicking through six sub-reports.
What a CRM dashboard is actually for
Most teams use their CRM as a data entry system. Reps log calls, update stages, add contacts. It’s where the record lives. But the CRM UI was built for data management, not for decision-making.
A dashboard is different. It’s read-only by design — you’re not updating records, you’re reading the state of your pipeline. That distinction matters because the questions a dashboard needs to answer are different from what CRM views are optimized for.
The questions worth answering:
- How much pipeline do we have, and how much of it is real?
- Where are deals stalling, and at which stage?
- Which reps are building pipeline vs. closing it?
- What’s our average deal size trending toward this quarter?
- What’s at risk this month?
That’s the core of a CRM dashboard. Everything else is optional.
The metrics that actually matter
Pipeline value by stage — The most basic view, and still the most useful. Stack it as a funnel or a bar chart by stage. You want to see where the drop-off is, not just the total number.
Deal velocity — How long does a deal spend in each stage before it moves or dies? This is the one that most teams don’t track until they start missing quarters. A deal sitting in “Proposal Sent” for 45 days is not a deal. It’s a ghost.
Win rate by source — Outbound vs. inbound vs. referral. If you’re not tracking this separately, you’re probably misreading your conversion rate by a significant margin.
Rep activity vs. outcomes — Calls and emails logged is a vanity metric on its own. Put it next to closed-won deals and you start to see whether activity is actually correlating with results for each rep.
At-risk deals — Anything that’s been sitting in a stage longer than your average deal cycle. These need a decision: push, disqualify, or escalate. A dashboard that flags them automatically saves the Monday review conversation.
Quota attainment by month — Not just for the quarter overall. Month-by-month shows whether you’re front-loaded (reps close early and coast) or back-loaded (everyone scrambles in week 12).
The data you need and where it lives
If you’re on Salesforce, your pipeline data lives in Opportunities. For HubSpot, it’s Deals. Most teams have either a native export or a data sync into Google Sheets or Excel on some schedule.
The fastest path to a working dashboard: export a clean Opportunities/Deals report with these columns: deal name, stage, amount, close date, owner, created date, last activity date. That CSV becomes your data source.
If your team updates the CRM consistently, a live connection to Google Sheets (synced via Zapier, HubSpot’s native Sheets integration, or Salesforce’s connector) means your dashboard updates without a weekly export ritual.
Building it with Infograph
Connect your deals export — or your live Google Sheet if you have the sync set up — and describe what you want:
“Show me a pipeline funnel by stage with deal count and total value at each stage. Add a bar chart of deal velocity (average days in stage). Then a leaderboard of reps ranked by closed-won this quarter.”
Infograph builds that in one pass. You can follow up: “Add a table of at-risk deals — anything where last activity was more than 14 days ago and close date is this month.” It adds the table.
What used to take a Salesforce admin an afternoon takes about three prompts.
The dashboard lives at a shareable URL. You can password-protect it so only your leadership team sees it, or keep it open for the full sales team. When the underlying sheet updates, the charts update.
A few design decisions worth making upfront
One number at the top. Your pipeline coverage ratio — total open pipeline divided by quota remaining. That number tells you immediately whether you need to worry about sourcing or closing. Put it first, big.
Don’t show activity metrics to reps. Dashboards visible to the whole team that rank activity turn into the wrong incentives fast. Keep those views for managers.
Pick one “at risk” definition and stick to it. Some teams use 14 days of inactivity, some use stage age relative to average cycle time. Either works. Inconsistency creates arguments about whether a deal is actually at risk, which defeats the purpose.
Refresh cadence matters. A dashboard that updates weekly is fine for QBRs. If you want to use it in your Monday standup, it needs to reflect the last 24-48 hours. Build accordingly.
What changes when your whole team uses it
The pipeline review meeting gets shorter. Not because there’s less to discuss — because everyone walked in already knowing the state of the pipeline. The conversation starts at decisions, not status updates.
Reps stop getting surprised by quota conversations. If the dashboard is visible to them, they can see their own numbers without a one-on-one.
The data quality problem surfaces fast. When you can see at a glance that 30% of your pipeline has no close date, that conversation happens. It usually doesn’t happen when the data lives buried in CRM views that only the admin checks.
Your CRM data has been waiting to tell you something. The dashboard is just the thing that makes it audible.


